 Multi-family
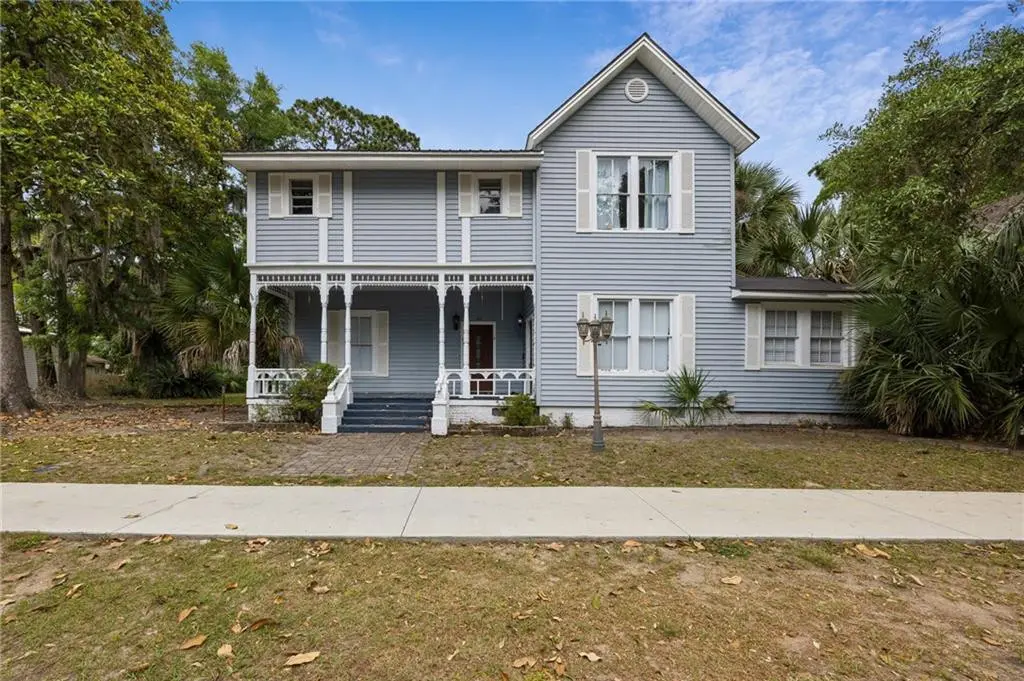
1416 Lee St · Brunswick, GA
Flood risk 8/10 · Major
- FEMA flood zone
- X (shaded)
- Chance of flooding over 30 yrs
- 0.96%
- Est. flood insurance / yr
- $507 – $1,088
Fire risk 5/10 · Moderate
- Est. fire insurance / yr
- $963 – $1,789
Heat risk 10/10 · Severe
- Hot days now (above 108°F)
- 7 days/yr
- Hot days in 30 yrs
- 20 days/yr
Wind risk 9/10 · Severe
- Chance of severe wind over 30 yrs
- 99.0%
Air-quality risk 4/10 · Minor
- Unhealthy air days now
- 5 days/yr
- Unhealthy air days in 30 yrs
- 5 days/yr
Risk factors via First Street. Map © Google.
Why this score? — see what drove the B- grade
The composite is a weighted blend of 9 inputs, each scored 0–100. Each bar is that input's sub-score; the figure is the points it added to the 100-point composite (weight × sub-score).
- Cash flow +27.4/30.0
- DSCR +9.6/10.0
- 1% rule +7.5/10.0
- ARV discount +7.5/15.0
- Rent growth +3.8/5.0
- Condition / age +3.8/5.0
- Schools +3.4/10.0
- Livability +3.0/5.0
- Appreciation +0.0/10.0
$519,900
🖨 Deal sheet 📄 Offer letter ✓ Due diligence
Multi-family units
County records classify this as Multi-Family (2-4 Unit). Listing-text estimate: 1 unit. estimate disagrees with records
Listing remarks MLS
Step into a rare opportunity to own a piece of Brunswick history! This beautifully maintained multi-family property, originally built in 1890, offers charm, character, and income-producing potential all in one! The property features five separate apartment units, including one spacious 3-bedroom, 2-bath unit and four additional 1-bedroom, 1-bath units. Each apartment has its own private entrance and individually metered electricity for added convenience. CURRENTLY ALL UNITS ARE TENANT-OCCUPIED MAKING THIS AN EXCELLENT OPPORTUNITY FOR INVESTORS SEEKING IMMEDIATE RENTAL INCOME! Located in Brunswick’s Historic District, the property is within walking distance to downtown restaurants, shops, and local attractions, while also being just a short drive from St. Simons Island and Jekyll Island. Schedule your tour today and add this unique property to your investment portfolio!
Key facts
- Private entrance
- Historic district
- 0.39 acre lot
Tags
Property features AI
Finance
- Other: Lot approximately 0.39 acres; Listing accepts Cash, Conventional, FHA, and VA financing
- HOA & community: No HOA
Exterior
- Parking: Off-street parking
- Utilities: Public water; Public sewer; Individual water meters
- Home design: Residential income property; Multi-family structure
- Construction: Built in 1890
- Exterior features: Vinyl siding; Block construction; Property updated/remodeled
Interior
- Heating & cooling: Electric central heating; Central air conditioning; Window AC units; Individual electric meters
- Interior features: Two levels; Updated/remodeled condition; No basement; Five-unit building
Neighborhood map
What this means for you Summary
Snapshot
- This is a multifamily listed at $520k. Condition is rated good.
Deal economics
- At list price, monthly cash flow is $1k ($18k/yr) — positive.
- The deal already cash-flows at list — no discount required.
- Meets the 1% rule at list price ($6k rent vs $520k).
- Recommended offer: $504k (3.0% below list) — sets the bar for market timing.
- Cap rate 9.8% vs local median 4.1% in Brunswick — top-decile yield for the area; either an underpriced asset or a hidden risk that comps aren't pricing in. Stress-test before assuming the spread holds.
Location & tenants
- Location reads 59/100 on livability (#401 in GA) — a working-class tenant base; expect higher turnover. Strengths: cost of living A+, housing B+; Watch: crime D, amenities F, commute F.
- Glynn County (other): math 37% / reading 42% proficiency, ranked #47 of 174 in GA (top 27%) — families likely to look elsewhere, expect single-tenant / working-renter base with shorter leases.
- Zoned schools: Glynn Middle (math 42% / reading 58%, grade C, #68 of 470 statewide, top 15%, 815 students, 51% FRL) — zoned schools at 51% FRL track the district average.
- Market conditions: Rents rising fast (+5.1%/yr); 183 active listings in the ZIP; 8 comparable units currently listed for rent nearby; rentals lingering (median 44d on market — plan ~5-8 weeks vacancy on turnover, expect pricing pressure); 62% of comp listings sitting > 30 days — soft ceiling on asking rent; lower-income renter base — watch delinquency; 734 units permitted in Glynn County in 2024 (136 in 5+ unit buildings).
- At $6,480/mo this rent would consume 194% of the median local household income ($40k/yr) (locally 1406% of renters already pay >50% of income on rent) — very limited rent-growth headroom before tenants either downsize or default.
Forward outlook
- Local home prices are declining (-3.0%/yr); year-one equity from $4k of loan paydown is wiped out by about $16k of value loss. Plan a longer hold.
- Glynn County population projected at +13% by 2050 — modest demand growth; plan on rents tracking national, not racing it.
- At projected returns (-3.0% appreciation + 5.1% rent growth), your $146k cash investment doubles in ~8 years — after that, you're playing with house money.
Negotiation context
- It's been on market 36 days — a 3% lower offer ($504k) is reasonable based on typical stale-listing flexibility.
- 10 sale attempts since 12y ago with the ask held roughly flat each time — persistent listings suggest the price (not the market) is what's stuck; bring a comps-based counter.
Risks & watch-outs
- Watch-outs: flood insurance adds $66/mo; built in 1890 — expect roof / HVAC / electrical / plumbing capex.
- Climate carrying-cost: severe flood risk; severe wind risk, 99% chance of damaging wind over 30y; moderate wildfire risk; extreme-heat days projected 7→20/yr by 2055 (HVAC capex compounding) — expect insurance premiums to compound above CPI over the hold.
Questions for the listing agent
- It's been on market 36 days. Have you received any prior offers? Is the seller open to a 3% concession, seller financing, or rate buy-down credit?
- Built in 1890 — when were the roof, HVAC, electrical panel, plumbing, and water heater last replaced?
- What's the actual annual flood-insurance premium (NFIP or private), and is the property in a SFHA with mandatory coverage?
- Is there a deadline driving the sale (1031 exchange, divorce, estate, relocation)? That informs how much negotiation room exists.
- Schools are D-rated, which usually means shorter tenancies and higher turnover. Who's the typical renter profile here, and what's been the actual vacancy rate?
- Crime grade is D in this area — have there been break-ins, vandalism, or insurance claims at this property in the last 3 years? What carrier currently insures it and at what premium?
- What's the average days-on-market for RENTAL listings here right now (not sales)? A rising rental-DOM trend means longer vacancies and softer asking-rent achievability than the comps imply.
- What's the recent tenant-quality profile in this submarket — average credit score on applications, eviction rate, late-payment / NSF rate, and stable-employment percentage? A property-management company in the area should have these aggregated.
- How much new apartment / multifamily construction is in the pipeline within 1–3 miles? Heavy new supply (>2% of stock underway) typically softens rents 12–24 months out; light construction supports rent growth.
Investment metrics
- 1% rule
- 1.25% ✓
- Cap rate
- 9.82%
- Cash-on-cash
- 12.58%
- DSCR
- 1.56
- GRM
- 6.7
CMA / ARV
- ARV (median comp)
- $304,037
- List price
- $519,900
- Delta
- 71.00%
- Verdict
- OVERPRICED
- Comps
- 20 within 1.0 mi
Show comp detail 8 sales within ~0.75 mi
| Address | Dist | Beds/Ba | Sqft | Sold | Price | $/sf | Match |
|---|---|---|---|---|---|---|---|
| 1608,1608.5,1610,1610.5 Stonewall St | 0.19mi | 4/4.0 | 1,760 | 17mo | $175,000 | $99 | 65 |
| 1620/1622 Martin Luther King Jr Blvd #5 | 0.24mi | 8/4.0 | 2,756 | 18mo | $260,000 | $94 | 61 |
| 1512 Jf Mann Way | 0.32mi | 3/3.0 | 2,452 | 17mo | $180,000 | $73 | 58 |
| 911 Union St | 0.69mi | 7/— | — | 2mo | $435,000 | — | 54 |
| 600 Mansfield St | 0.53mi | 4/3.0 | 2,516 | 13mo | $335,000 | $133 | 52 |
| 1915 Union St | 0.69mi | 3/3.0 | 1,900 | 10mo | $380,000 | $200 | 48 |
| 920 & 922 Richmond St | 0.71mi | 6/3.0 | 3,024 | 13mo | $355,000 | $117 | 44 |
| 2208- 2214 K St | 0.68mi | 8/4.0 | 2,450 | 19mo | $287,500 | $117 | 40 |
Match score weights: distance 35% · size 25% · config 20% · recency 20%. Top-matched comps best support the ARV.
Projected returns pro-forma
-3.0% appreciation · 5.08% rent growth · sell at horizon
- IRR
- 3.9%
- Equity multiple
- 1.16×
- Total profit
- $22,712
- Equity at exit
- $77,519
- IRR
- 15.4%
- Equity multiple
- 2.37×
- Total profit
- $199,336
- Equity at exit
- $44,951
Cash invested: $145,572 (down + closing). Projections, not guarantees.
Landlord ↔ Tenant lean methodology
- Overall (STATE)
- 90 Strongly Landlord-Friendly
- State Georgia
- 90 Strongly Landlord-Friendly · R+3
- County
- — inherits STATE
- City
- — inherits STATE
ZIP-level market 31520
- Rents YoY
- 5.1%
- Active inventory
- 183
- Price-to-rent
- 31.0×
Monthly cashflow live
- Estimated rent
- $6,480 high interval (Pro) →
- Mortgage (P&I)
- −$2,726
- Tax est. 1.5%
- −$650 /mo · $7,798/yr
- Insurance
- −$217
- Flood insurance flood zone
- −$66 /mo · $798/yr
- HOA
- −$0
- Vacancy / Maint / Mgmt
- −$1,361
- Net cashflow
- $1,460
Break-even live
5-unit breakdown (identical units grouped — click to expand)
| Units | Beds | Baths | Est. rent |
|---|---|---|---|
| 1× unit | 3 | 2 | $1,397 |
| 4× units | 1 | 1 | $5,084 |
| #2 | 1 | 1 | $1,271 |
| #3 | 1 | 1 | $1,271 |
| #4 | 1 | 1 | $1,271 |
| #5 | 1 | 1 | $1,271 |
| Total (5 units) | $6,480 | ||
UW: 25.0% down · 7.5% · 30yr · 1.5% tax · 5.0% vac · 8.0% maint · 8.0% mgmt
Financing live
Cash to close
- Down payment
- $129,975
- Closing costs
- $15,597
- Reserves months
- —
- Total cash needed
- —
Loan-product check · same deal, 3 products live
Conventional
25% down · 7.5% · 30yr
- Down + closing
- —
- Monthly P&I
- —
- Monthly cashflow
- —
- DSCR
- —
- Eligible?
- —
Personal DTI + credit; lowest rate.
DSCR
20% down · 8.5% · 30yr
- Down + closing
- —
- Monthly P&I
- —
- Monthly cashflow
- —
- DSCR
- —
- Eligible?
- —
No personal income docs; deal must DSCR.
Hard money
10% down · 12.0% · 12mo
- Down + closing
- —
- Monthly P&I
- —
- Monthly cashflow
- —
- DSCR
- —
- Eligible?
- —
Short-term bridge; refi at stabilization.
Rent comps 8 comps
| Address | Beds | Baths | Sqft | Rent | $/sqft | DOM | Units | Dist |
|---|---|---|---|---|---|---|---|---|
| 1501 G St Brunswick, GA | 3.0 | 2.0 | 1064 | $1,200 | $1.13 | 44d | 1 | 0.26mi |
| 1801 Goodyear Ave Unit A Brunswick, GA | 2.0 | 2.0 | — | $1,000 | — | 44d | 1 | 0.43mi |
| 1801 Goodyear Ave Unit B Brunswick, GA | 2.0 | 1.0 | — | $850 | — | 44d | 1 | 0.43mi |
| 1105 Grant St Brunswick, GA | 2.0 | 1.0 | 925 | $2,600 | $2.81 | 24d | 1 | 0.69mi |
| 502 Prince St Apt B Brunswick, GA | 2.0 | 1.5 | 928 | $1,100 | $1.19 | 16d | 1 | 0.76mi |
| 502 Prince St Unit A Brunswick, GA | 2.0 | 1.0 | 928 | $1,100 | $1.19 | 3d | 1 | 0.76mi |
| 2408 Gordon St Brunswick, GA | 3.0 | 2.0 | 1100 | $1,550 | $1.41 | 44d | 1 | 0.93mi |
| 2328 Union St Brunswick, GA | 1.0 | 1.0 | 600 | $1,125 | $1.88 | 44d | 1 | 0.99mi |
Listing history 41 events
-
2026-06-19days on market $519,900 Active 36 DOM
-
2026-06-18days on market $519,900 Active 35 DOM
-
2026-06-17days on market $519,900 Active 34 DOM
-
2026-06-16days on market $519,900 Active 33 DOM
-
2026-06-15days on market $519,900 Active 32 DOM
-
2026-06-14days on market $519,900 Active 30 DOM
-
2026-06-13days on market $519,900 Active 29 DOM
-
2026-06-10days on market $519,900 Active 27 DOM
-
2026-06-09days on market $519,900 Active 26 DOM
-
2026-06-08days on market $519,900 Active 25 DOM
-
2026-06-07days on market $519,900 Active 24 DOM
-
2026-06-05days on market $519,900 Active 21 DOM
-
2026-06-03days on market $519,900 Active 20 DOM
-
2026-06-02days on market $519,900 Active 19 DOM
-
2026-06-01days on market $519,900 Active 18 DOM
-
2026-05-31days on market $519,900 Active 17 DOM
-
2026-05-30days on market $519,900 Active 16 DOM
-
2026-05-14$519,900 Active 897-char remark
Show marketing remark (897 chars)
Step into a rare opportunity to own a piece of Brunswick history! This beautifully maintained multi-family property, originally built in 1890, offers charm, character, and income-producing potential all in one! The property features five separate apartment units, including one spacious 3-bedroom, 2-bath unit and four additional 1-bedroom, 1-bath units. Each apartment has its own private entrance and individually metered electricity for added convenience. CURRENTLY ALL UNITS ARE TENANT-OCCUPIED MAKING THIS AN EXCELLENT OPPORTUNITY FOR INVESTORS SEEKING IMMEDIATE RENTAL INCOME! Located in Brunswick’s Historic District, the property is within walking distance to downtown restaurants, shops, and local attractions, while also being just a short drive from St. Simons Island and Jekyll Island. Schedule your tour today and add this unique property to your investment portfolio!
-
2026-05-07$519,900 New
-
2024-03-15historical
-
2024-03-05historical
-
2024-01-25status Back On Market
-
2024-01-25status Active
-
2024-01-24status Under Contract
-
2024-01-22status Pending
-
2023-12-22price $400,000
-
2023-12-22price $400,000
-
2023-12-13status Active
-
2023-11-21price $450,000
-
2023-10-01price $450,000
-
2023-08-08price $475,000
-
2023-06-30price $499,000
-
2023-06-29status Back On Market
-
2023-06-29status Active
-
2023-06-29price $499,000
-
2023-06-19status Under Contract
-
2023-06-16status Pending
-
2023-06-03$549,900 New
-
2023-06-03$549,900 Active
-
2014-09-22historical
-
2014-03-22$369,000
ⓘ Source: listings_history table (triggers on properties + properties_extension) + one-shot
backfill from property_details.listing_events for pre-trigger history.
Climate risk First Street
- Flood 8/10 Severe FEMA zone X (shaded) · 96% chance over 30 yrs
- Wildfire 5/10 Major
- Heat 10/10 Extreme 7 d/yr ≥108°F today · 20 d/yr by 30 yrs out
- Wind 9/10 Extreme 99% chance of damaging wind over 30 yrs
- Air quality 4/10 Moderate 5 unhealthy d/yr today · 5 by 30 yrs out
Nearby sold comps map
Loading sold comps map…
Walkable amenities ~0.75 mi
Loading nearby amenities…
Taxation est. · year 1
- Rental income
- $77,760
- − Mortgage interest
- −$29,122
- − Property taxes
- −$7,798
- − Insurance
- −$3,397
- − Repairs & maintenance
- −$6,221
- − Management
- −$6,221
- − Depreciation
- −$15,124
- Taxable income
- $9,876
- Est. tax owed @ 24.0%
- −$2,370
- After-tax cash flow
- $15,148/yr
For passive investors: Depreciation is non-cash, so a rental often shows a tax loss while cash-flowing — sheltering income. Rental losses are passive: they offset passive income freely, and up to $25,000/yr can offset ordinary (W-2) income if you actively participate and your MAGI is under $100k (phasing out to $0 by $150k); unused losses carry forward. On sale, claimed depreciation is recaptured at up to 25%, and gains may owe capital-gains tax (a 1031 exchange can defer both). Figures are a year-1 estimate at your 24.0% rate — not tax advice; consult a CPA.
Condition & rehab AI · 12 photos
This multi-family property is in good condition with minimal repairs needed. It offers a great opportunity for investors seeking immediate rental income and potential for future value appreciation.
Value-add opportunities
- Both Paint the exterior siding — Painting the exterior siding can enhance the curb appeal and increase the property's value.
- Both Replace the windows — Replacing the windows can improve energy efficiency and increase the property's value.
- Both Update the kitchen appliances — Updating the kitchen appliances can make the kitchen more functional and attractive, increasing both resale and rental value.
- Both Update the flooring — Updating the flooring can make the living areas more attractive and functional, increasing both resale and rental value.
- Both Update the paint — Updating the paint can make the interior more attractive and functional, increasing both resale and rental value.
Renovation cost estimate screening
Value-add ROI direction
- Both Paint the exterior siding — Painting the exterior siding can enhance the curb appeal and increase the property's value. ↑
- Both Replace the windows — Replacing the windows can improve energy efficiency and increase the property's value. ↑
- Both Update the kitchen appliances — Updating the kitchen appliances can make the kitchen more functional and attractive, increasing both resale and rental value. ↑
- Both Update the flooring — Updating the flooring can make the living areas more attractive and functional, increasing both resale and rental value. ↑
- Both Update the paint — Updating the paint can make the interior more attractive and functional, increasing both resale and rental value. ↑
ⓘ Cost ranges are severity-bucket heuristics (US national rule-of-thumb). Get contractor quotes + a written scope before underwriting a rehab budget.
Schools (NCES district)
- District
- Glynn County
- NCES district ID
- 1302400
- Math proficiency
- 37% ▼ -9.00%
- Reading proficiency
- 42% ▼ -7.00%
- Median HH income
- $47,554
- Composite
- 33.83/100
- National rank
- #5359
- State rank
- #47 of 174 in GA
Livability — Brunswick
- Score
- 59/100
- State rank
- #401
- US rank
- #19832
Category grades
Schools grade is shown separately in the Schools card above.
Census & demographics
- Census place
- Brunswick, GA
- County
- Glynn County · 69,019 people
- City population
- 51,239
- Metro
- Brunswick, GA
- Population (ZIP)
- 22,313
- Household income
- $40,071
- Rent vs Own
- Severe rent burden
- 1406.0
Population outlook (Glynn County) Hauer SSP2
- Today (2025)
- 91,404 people
- By 2030
- 94,806 · +3.7%
- By 2040
- 100,060 · +9.5%
- By 2050
- 103,258 · +13.0%
- By 2075
- 107,970 · +18.1%
- By 2100
- 103,363 · +13.1%
Race, ethnicity, and origin ACS 2023
- Neighborhood character
- Diverse neighborhood (Simpson 0.63)
- Race & ethnicity
- Black 50% White 33% Hispanic / Latino 11% Two or more races 9% Asian 1%
- Hispanic origin (detail)
- Mexican 7%
- Common ancestry
- Italian 2% Slovak 1% Serbian 1%
- Foreign-born
- 8% · Canada, South Korea
- Languages at home
- 87% English-only · Spanish 10% French/Haitian/Cajun 1% Korean 1%
Political lean MEDSL · Glynn
- 2024 margin
- Strong R (+26.0) · D 36.8% · R 62.8%
- 2008→2024 swing
- -2.6pp toward R · 2008: -23.4pp · 2024: -26.0pp
- All cycles
- 2024: R+26.0 2020: R+23.2 2016: R+28.6 2012: R+27.0 2008: R+23.4
Not yet ingested
- Civics
- —
Market trends
- HPI YoY
- ▼ -274.83%
- Current HPI
- 180.4581
- Rent YoY
- ▲ 5.08%
- Metro
- Brunswick, GA
- State GDP YoY
- ▲ 2.66%
- F500 in state
- 28
Industry mix (Fortune 500 HQ in GA)
| Industry | F500 HQs | Revenue |
|---|---|---|
| Paper / Packaging | 2 | $29B |
|
||
| Retail | 1 | $160B |
|
||
| Transportation / Logistics | 1 | $91B |
|
||
| Airlines | 1 | $62B |
|
||
| Consumer Goods | 1 | $47B |
|
||
| Utilities | 1 | $25B |
|
||
Price history
+40.9% since first listed24 events — show timeline
- 2026-05-14 Listed $519,900 GIAR
- 2026-05-07 Listed $519,900 GAMLS
- 2024-03-15 Listing Removed — GAMLS
- 2024-03-05 Listing Removed — GIAR
- 2024-01-25 Relisted — GAMLS
- 2024-01-25 Relisted — GIAR
- 2024-01-24 Pending — GAMLS
- 2024-01-22 Pending — GIAR
- 2023-12-22 Price Changed $400,000 GAMLS
- 2023-12-22 Price Changed $400,000 GIAR
- 2023-12-13 Relisted — GIAR
- 2023-11-21 Price Changed $450,000 GAMLS
- 2023-10-01 Price Changed $450,000 GIAR
- 2023-08-08 Price Changed $475,000 GIAR
- 2023-06-30 Price Changed $499,000 GAMLS
- 2023-06-29 Relisted — GAMLS
- 2023-06-29 Relisted — GIAR
- 2023-06-29 Price Changed $499,000 GIAR
- 2023-06-19 Pending — GAMLS
- 2023-06-16 Pending — GIAR
- 2023-06-03 Listed $549,900 GIAR
- 2023-06-03 Listed $549,900 GAMLS
- 2014-09-22 Listing Removed — GIAR
- 2014-03-22 Listed $369,000 GIAR
Cash-flow waterfall
monthlySold comps — $/sqft
last 12 mo · ≤1 miLoading sold comps…