 Duplex
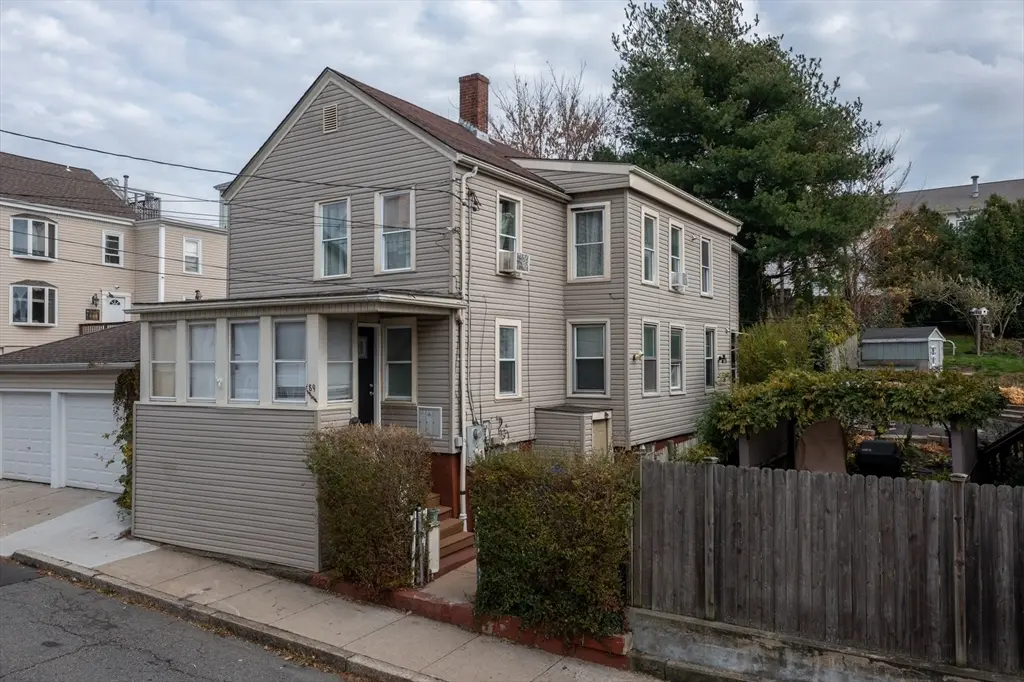
89 Oak St · Fall River, MA
Flood risk 1/10 · Minimal
- FEMA flood zone
- X (unshaded)
- Chance of flooding over 30 yrs
- 0.0%
- Est. flood insurance / yr
- $473 – $860
Fire risk 1/10 · Minimal
- Est. fire insurance / yr
- $915 – $1,699
Heat risk 6/10 · Moderate
- Hot days now (above 96°F)
- 7 days/yr
- Hot days in 30 yrs
- 15 days/yr
Wind risk 8/10 · Major
- Chance of severe wind over 30 yrs
- 80.0%
Air-quality risk 2/10 · Minimal
- Unhealthy air days now
- 1 days/yr
- Unhealthy air days in 30 yrs
- 2 days/yr
Risk factors via First Street. Map © Google.
Why this score? — see what drove the C- grade
The composite is a weighted blend of 9 inputs, each scored 0–100. Each bar is that input's sub-score; the figure is the points it added to the 100-point composite (weight × sub-score).
- Cash flow +19.6/30.0
- ARV discount +11.9/15.0
- DSCR +6.2/10.0
- 1% rule +4.4/10.0
- Rent growth +3.9/5.0
- Livability +3.1/5.0
- Condition / age +2.5/5.0
- Schools +1.9/10.0
- Appreciation +0.0/10.0
$439,900
🖨 Deal sheet 📄 Offer letter ✓ Due diligence
Multi-family units
County records classify this as Multi-Family (2-4 Unit). Listing-text estimate: 2 units. confirmed
Listing remarks MLS
Two-family in Fall River. Each apt. 2 bedrooms. Newer windows, roof and appliances, plus more updates. Wood flooring. Great for owner-occupied or investment! Investors- this is the one!
Key facts
- Updated electrical
- Renovated duplex
- Floors refinished
Tags
Property features AI
Finance
- Other: Building total area about 1,594 (with approximately 797 below-grade finished area)
- HOA & community: Community amenities nearby: public transportation, shopping, pool, tennis courts, park, walk/jog trails, medical facility, laundromat, highway access, house of worship, marina, public school
Exterior
- Parking: No open parking spaces listed
- Utilities: Public water; Public sewer
- Home design: Two-family, up/down configuration; 2 stories
- Construction: Frame construction; Concrete perimeter foundation; Shingle roof; Built (year per public records)
- Exterior features: Fenced/enclosed yard; Deck; Level lot; Paved, public road frontage (40' frontage)
Interior
- Flooring: Wood flooring
- Bathrooms: 2 full bathrooms
- Interior features: Total of 10 rooms; Full walk-out basement (unfinished) with concrete construction
Neighborhood map
What this means for you Summary
Snapshot
- This is a 2 × 3-bed/1.0-bath units multifamily listed at $440k.
Deal economics
- At list price, monthly cash flow is $511 ($6k/yr) — positive. Per door: $255/mo.
- The deal already cash-flows at list — no discount required.
- To meet the 1% rule (rent ≥ 1% of price), the offer needs to be $416k (5.5% below list).
- Recommended offer: $416k (5.5% below list) — sets the bar for 1% rule.
- Cap rate 7.7% vs local median 3.6% in Fall River — top-decile yield for the area; either an underpriced asset or a hidden risk that comps aren't pricing in. Stress-test before assuming the spread holds.
Location & tenants
- Location reads 61/100 on livability (#221 in MA) — a middle-class / working-renter tenant base. Strengths: health & safety A+; Watch: cost of living D+, schools D, crime F.
- Fall River (suburban): math 17% / reading 28% proficiency, ranked #288 of 302 in MA (top 95%) — low school quality limits family demand, transient renter base, plan for 1-2y turnover; 68% free/reduced lunch — lower-income household profile, screen leases tightly.
- Market conditions: Rents rising fast (+5.8%/yr); 62 active listings in the ZIP; 40 comparable units currently listed for rent nearby; rentals at typical pace (median 24d on market — plan ~3-4 weeks tenant-placement turnaround); 42% of comp listings sitting > 30 days — soft ceiling on asking rent; 760 units permitted in Bristol County in 2024 (142 in 5+ unit buildings).
- At $4,155/mo this rent would consume 80% of the median local household income ($62k/yr) (locally 2239% of renters already pay >50% of income on rent) — very limited rent-growth headroom before tenants either downsize or default.
Forward outlook
- Local home prices are declining (-3.0%/yr); year-one equity from $3k of loan paydown is wiped out by about $13k of value loss. Plan a longer hold.
- Bristol County population projected to shrink 3% by 2050 — rents likely to lag national; underwrite the cash flow, not the appreciation.
Negotiation context
- It's been on market 38 days — a 3% lower offer ($427k) is reasonable based on typical stale-listing flexibility.
- 4 sale attempts since 26y ago with the ask held roughly flat each time — persistent listings suggest the price (not the market) is what's stuck; bring a comps-based counter.
- Current owner paid $80k; list at $440k implies a 450% gain — meaningful room to come down on a strong offer.
Risks & watch-outs
- Watch-outs: built in 1921 — expect roof / HVAC / electrical / plumbing capex.
- Climate carrying-cost: severe wind risk, 80% chance of damaging wind over 30y; extreme-heat days projected 7→15/yr by 2055 (HVAC capex compounding) — expect insurance premiums to compound above CPI over the hold.
Questions for the listing agent
- It's been on market 38 days. Have you received any prior offers? Is the seller open to a 6% concession, seller financing, or rate buy-down credit?
- Can we see the unit-by-unit rent roll, current vacancy, and any below-market leases? What's the average tenancy length?
- What capital expenditures (roof, boiler, parking lot, exteriors) have been made in the last 5 years, and what's planned in the next 2?
- Built in 1921 — when were the roof, HVAC, electrical panel, plumbing, and water heater last replaced?
- Is there a deadline driving the sale (1031 exchange, divorce, estate, relocation)? That informs how much negotiation room exists.
- Schools are D-rated, which usually means shorter tenancies and higher turnover. Who's the typical renter profile here, and what's been the actual vacancy rate?
- Crime grade is F in this area — have there been break-ins, vandalism, or insurance claims at this property in the last 3 years? What carrier currently insures it and at what premium?
- What's the average days-on-market for RENTAL listings here right now (not sales)? A rising rental-DOM trend means longer vacancies and softer asking-rent achievability than the comps imply.
- What's the recent tenant-quality profile in this submarket — average credit score on applications, eviction rate, late-payment / NSF rate, and stable-employment percentage? A property-management company in the area should have these aggregated.
- How much new apartment / multifamily construction is in the pipeline within 1–3 miles? Heavy new supply (>2% of stock underway) typically softens rents 12–24 months out; light construction supports rent growth.
Investment metrics
- 1% rule
- 0.94% ✗
- Cap rate
- 7.69%
- Cash-on-cash
- 4.98%
- DSCR
- 1.22
- GRM
- 8.8
CMA / ARV
- ARV (median comp)
- $487,536
- List price
- $439,900
- Delta
- -9.77%
- Verdict
- FAIR
- Comps
- 20 within 1.0 mi
Show comp detail 4 sales within ~0.75 mi
| Address | Dist | Beds/Ba | Sqft | Sold | Price | $/sf | Match |
|---|---|---|---|---|---|---|---|
| 104 Grove St | 0.16mi | 4/4.0 | 1,758 (+10%) | 6mo | $595,000 | $338 | 62 |
| 55 Tremont St | 0.36mi | 5/2.5 (+1) | 1,652 (+4%) | 11mo | $549,900 | $333 | 61 |
| 376 Linden St | 0.35mi | 4/2.0 | 1,700 (+7%) | 14mo | $400,000 | $235 | 61 |
| 658 Third | 0.72mi | 4/2.0 | 1,685 (+6%) | 1mo | $510,000 | $303 | 56 |
Match score weights: distance 35% · size 25% · config 20% · recency 20%. Top-matched comps best support the ARV.
Projected returns pro-forma
-3.0% appreciation · 5.76% rent growth · sell at horizon
- IRR
- -5.7%
- Equity multiple
- 0.78×
- Total profit
- $-27,002
- Equity at exit
- $65,591
- IRR
- 6.7%
- Equity multiple
- 1.56×
- Total profit
- $69,444
- Equity at exit
- $38,035
Cash invested: $123,172 (down + closing). Projections, not guarantees.
Landlord ↔ Tenant lean methodology
- Overall (STATE)
- 20 Strongly Tenant-Friendly
- State Massachusetts
- 20 Strongly Tenant-Friendly · D+15
- County
- — inherits STATE
- City
- — inherits STATE
ZIP-level market 02720
- Home prices YoY
- -15.1%
- Rents YoY
- 5.8%
- Active inventory
- 62
- Price-to-rent
- 17.6×
Monthly cashflow live
- Estimated rent
- $4,155 high interval (Pro) →
- Mortgage (P&I)
- −$2,307
- Tax from tax record
- −$282 /mo · $3,379/yr
- Insurance
- −$183
- HOA
- −$0
- Vacancy / Maint / Mgmt
- −$873
- Net cashflow
- $511
Break-even live
2-unit breakdown (identical units grouped — click to expand)
| Units | Beds | Baths | Est. rent |
|---|---|---|---|
| 2× units | 3 | 1 | $4,154 |
| #1 | 3 | 1 | $2,077 |
| #2 | 3 | 1 | $2,077 |
| Total (2 units) | $4,155 | ||
UW: 25.0% down · 7.5% · 30yr · 1.5% tax · 5.0% vac · 8.0% maint · 8.0% mgmt
Financing live
Cash to close
- Down payment
- $109,975
- Closing costs
- $13,197
- Reserves months
- —
- Total cash needed
- —
Loan-product check · same deal, 3 products live
Conventional
25% down · 7.5% · 30yr
- Down + closing
- —
- Monthly P&I
- —
- Monthly cashflow
- —
- DSCR
- —
- Eligible?
- —
Personal DTI + credit; lowest rate.
DSCR
20% down · 8.5% · 30yr
- Down + closing
- —
- Monthly P&I
- —
- Monthly cashflow
- —
- DSCR
- —
- Eligible?
- —
No personal income docs; deal must DSCR.
Hard money
10% down · 12.0% · 12mo
- Down + closing
- —
- Monthly P&I
- —
- Monthly cashflow
- —
- DSCR
- —
- Eligible?
- —
Short-term bridge; refi at stabilization.
Rent comps 40 comps
| Address | Beds | Baths | Sqft | Rent | $/sqft | DOM | Units | Dist |
|---|---|---|---|---|---|---|---|---|
| 1 6th St Unit 1 Fall River, MA | 3.0 | 1.0 | 1200 | $2,300 | $1.92 | 4d | 1 | 0.06mi |
| 140 Ogrady St Fall River, MA | 3.0 | 2.0 | 2048 | $2,500 | $1.22 | 20d | 1 | 0.12mi |
| 105 6th St Unit 3 Fall River, MA | 3.0 | 1.0 | 1200 | $2,100 | $1.75 | 4d | 1 | 0.16mi |
| 484 Walnut St Unit 2E Fall River, MA | 3.0 | 2.0 | 1500 | $2,500 | $1.67 | 43d | 1 | 0.34mi |
| 26 Hanover St Unit 1 Fall River, MA | 3.0 | 1.0 | 1200 | $2,500 | $2.08 | 11d | 1 | 0.36mi |
| 489 Spring St Unit 1 Fall River, MA | 3.0 | 1.0 | 1400 | $2,600 | $1.86 | 43d | 1 | 0.37mi |
| 196 Rodman St Unit 2 Fall River, MA | 4.0 | 1.0 | 1400 | $2,200 | $1.57 | 4d | 1 | 0.41mi |
| 709 Maple St Unit 3 Fall River, MA | 3.0 | 1.0 | 1200 | $2,000 | $1.67 | 10d | 1 | 0.42mi |
| 118 Locust St Unit 2w Fall River, MA | 3.0 | 1.0 | 1200 | $2,000 | $1.67 | 43d | 1 | 0.44mi |
| 118 Locust St Apt 2 Fall River, MA | 3.0 | 1.0 | 1200 | $1,900 | $1.58 | 23d | 1 | 0.44mi |
| 177 Highland Ave Unit 1 Fall River, MA | 3.0 | 1.0 | 1600 | $1,700 | $1.06 | 20d | 1 | 0.49mi |
| 60 Prospect St Unit 3 Fall River, MA | 3.0 | 1.0 | 1100 | $1,950 | $1.77 | 17d | 1 | 0.58mi |
| 670 Prospect St Unit 1 Fall River, MA | 3.0 | 1.0 | 1200 | $2,300 | $1.92 | 23d | 1 | 0.61mi |
| 255 Columbia St Unit 2nd Floor Fall River, MA | 3.0 | 1.0 | 1600 | $2,500 | $1.56 | 43d | 1 | 0.63mi |
| 554 2nd St Unit 3 Fall River, MA | 3.0 | 1.0 | 1200 | $1,750 | $1.46 | 43d | 1 | 0.63mi |
| 487 4th St Unit 2R Fall River, MA | 3.0 | 1.0 | 1200 | $1,650 | $1.38 | 3d | 1 | 0.63mi |
| 351 Tecumseh St Unit 2 Fall River, MA | 3.0 | 1.0 | 1300 | $2,000 | $1.54 | 43d | 1 | 0.76mi |
| 344 Snell St Unit 2 Fall River, MA | 3.0 | 1.0 | 1050 | $1,600 | $1.52 | 43d | 1 | 0.78mi |
| 60 Park St Fall River, MA | 3.0 | 1.0 | 1100 | $1,850 | $1.68 | 3d | 1 | 0.80mi |
| 85 Park St Fall River, MA | 3.0 | 1.0 | 1200 | $1,975 | $1.65 | 4d | 1 | 0.80mi |
| 341 Belmont St Unit 2 Fall River, MA | 3.0 | 1.0 | 1296 | $2,000 | $1.54 | 17d | 1 | 0.83mi |
| 820 Second St Unit 2 Fall River, MA | 3.0 | 1.0 | 1100 | $1,600 | $1.45 | 23d | 1 | 0.84mi |
| 820 Second St Fall River, MA | 3.0 | 1.0 | 1100 | $1,600 | $1.45 | 16d | 1 | 0.84mi |
| 194 Buffinton St Unit 1 Fall River, MA | 3.0 | 1.0 | 1100 | $2,200 | $2.00 | 43d | 1 | 0.85mi |
| 425 Division St Fall River, MA | 3.0 | 1.0 | 1200 | $3,000 | $2.50 | 43d | 1 | 0.86mi |
| 246 Eagle St Unit 1W Fall River, MA | 3.0 | 1.0 | 1100 | $1,650 | $1.50 | 43d | 1 | 0.86mi |
| 62 Covel St Unit 1 Fall River, MA | 3.0 | 1.0 | 1073 | $1,800 | $1.68 | 17d | 1 | 0.86mi |
| 227 Eagle St Fall River, MA | 4.0 | 1.0 | 1600 | $3,000 | $1.88 | 43d | 1 | 0.87mi |
| 70 Warburton St Unit 3 Fall River, MA | 3.0 | 1.0 | 1350 | $1,675 | $1.24 | 4d | 1 | 0.88mi |
| 159 Covel St Unit 2 Fall River, MA | 3.0 | 1.0 | 1100 | $2,000 | $1.82 | 43d | 1 | 0.89mi |
| 908 Plymouth Ave Unit 3 Fall River, MA | 4.0 | 1.0 | 1100 | $2,500 | $2.27 | 11d | 1 | 0.90mi |
| 42 Mott St Unit 3 Fall River, MA | 4.0 | 1.0 | 1200 | $2,600 | $2.17 | 43d | 1 | 0.90mi |
| 42 Mott St Unit 1 Fall River, MA | 4.0 | 1.0 | 1200 | $2,500 | $2.08 | 16d | 1 | 0.90mi |
| 1026 Rock St Unit 3 Fall River, MA | 3.0 | 1.0 | 1548 | $2,000 | $1.29 | 17d | 1 | 0.91mi |
| 452 Osborn St Unit 3 Fall River, MA | 3.0 | 1.0 | 1502 | $2,300 | $1.53 | 43d | 1 | 0.92mi |
| 17 Canonicus St Fall River, MA | 3.0 | 1.0 | 1500 | $2,300 | $1.53 | 43d | 1 | 0.94mi |
| 318 Broadway Unit 2 Fall River, MA | 3.0 | 1.0 | 1200 | $1,895 | $1.58 | 16d | 1 | 0.94mi |
| 288 Division St Unit 1 First Floor Fall River, MA | 4.0 | 1.0 | 1300 | $2,800 | $2.15 | 4d | 1 | 0.96mi |
| 974 Plymouth Ave Apt 3 Fall River, MA | 3.0 | 1.0 | 1400 | $2,000 | $1.43 | 43d | 1 | 0.96mi |
| 860 President Ave Unit 2 Fall River, MA | 4.0 | 2.0 | 1161 | $2,300 | $1.98 | 43d | 1 | 0.99mi |
Listing history 31 events
-
2026-06-18days on market $439,900 Active 38 DOM
-
2026-06-17days on market $439,900 Active 37 DOM
-
2026-06-16days on market $439,900 Active 36 DOM
-
2026-06-15days on market $439,900 Active 35 DOM
-
2026-06-13statusdays on market $439,900 Active 33 DOM
-
2026-06-09days on market $439,900 Price Changed 29 DOM
-
2026-06-08pricestatusdays on market $439,900 Price Changed 28 DOM
-
2026-06-07days on market $449,000 Active 27 DOM
-
2026-06-05days on market $449,000 Active 24 DOM
-
2026-06-03days on market $449,000 Active 23 DOM
-
2026-06-02days on market $449,000 Active 22 DOM
-
2026-06-01days on market $449,000 Active 21 DOM
-
2026-05-31days on market $449,000 Active 20 DOM
-
2026-05-11$449,000 New 811-char remark
-
2010-05-10soldstatus $80,000 Sold 185-char remark
Show marketing remark (185 chars)
Two-family in Fall River. Each apt. 2 bedrooms. Newer windows, roof and appliances, plus more updates. Wood flooring. Great for owner-occupied or investment! Investors- this is the one!
-
2009-11-10historical Under Agreement 185-char remark
Show marketing remark (185 chars)
Two-family in Fall River. Each apt. 2 bedrooms. Newer windows, roof and appliances, plus more updates. Wood flooring. Great for owner-occupied or investment! Investors- this is the one!
-
2009-10-19price $99,900 Price Changed 185-char remark
Show marketing remark (185 chars)
Two-family in Fall River. Each apt. 2 bedrooms. Newer windows, roof and appliances, plus more updates. Wood flooring. Great for owner-occupied or investment! Investors- this is the one!
-
2009-10-05price $112,500 Price Changed 185-char remark
Show marketing remark (185 chars)
Two-family in Fall River. Each apt. 2 bedrooms. Newer windows, roof and appliances, plus more updates. Wood flooring. Great for owner-occupied or investment! Investors- this is the one!
-
2009-09-29price $119,900 Price Changed 185-char remark
Show marketing remark (185 chars)
Two-family in Fall River. Each apt. 2 bedrooms. Newer windows, roof and appliances, plus more updates. Wood flooring. Great for owner-occupied or investment! Investors- this is the one!
-
2009-09-11price $125,000 Price Changed 185-char remark
Show marketing remark (185 chars)
Two-family in Fall River. Each apt. 2 bedrooms. Newer windows, roof and appliances, plus more updates. Wood flooring. Great for owner-occupied or investment! Investors- this is the one!
-
2009-08-17price $129,900 Price Changed 185-char remark
Show marketing remark (185 chars)
Two-family in Fall River. Each apt. 2 bedrooms. Newer windows, roof and appliances, plus more updates. Wood flooring. Great for owner-occupied or investment! Investors- this is the one!
-
2009-07-14price $139,900 Price Changed 185-char remark
Show marketing remark (185 chars)
Two-family in Fall River. Each apt. 2 bedrooms. Newer windows, roof and appliances, plus more updates. Wood flooring. Great for owner-occupied or investment! Investors- this is the one!
-
2009-06-29price $149,900 185-char remark
Show marketing remark (185 chars)
Two-family in Fall River. Each apt. 2 bedrooms. Newer windows, roof and appliances, plus more updates. Wood flooring. Great for owner-occupied or investment! Investors- this is the one!
-
2009-06-19$159,900 185-char remark
Show marketing remark (185 chars)
Two-family in Fall River. Each apt. 2 bedrooms. Newer windows, roof and appliances, plus more updates. Wood flooring. Great for owner-occupied or investment! Investors- this is the one!
-
2004-04-28soldstatus $155,500
-
2004-04-27soldstatus $155,500
Show marketing remark (76 chars)
WELL KEPT TWO FAMILY, VINYL SIDING, NEWER ROOF, MUST SEE, SEPARATE UTILITIES
-
2004-03-04historical
Show marketing remark (76 chars)
WELL KEPT TWO FAMILY, VINYL SIDING, NEWER ROOF, MUST SEE, SEPARATE UTILITIES
-
2003-01-07$164,900
Show marketing remark (76 chars)
WELL KEPT TWO FAMILY, VINYL SIDING, NEWER ROOF, MUST SEE, SEPARATE UTILITIES
-
2000-10-31soldstatus $67,500
-
2000-10-31soldstatus $67,500
-
2000-03-25$84,950
ⓘ Source: listings_history table (triggers on properties + properties_extension) + one-shot
backfill from property_details.listing_events for pre-trigger history.
Tax reassessment forecast MA · Partial reset (capped growth)
- Current annual tax
- $3,379 · $282/mo
- Projected year-2 tax
- $4,395 · $366/mo
- Expected delta
- +$1,016/yr (+$85/mo · 30.1%)
ⓘ Screening estimate from a state-policy table — verify with the county assessor before closing.
Climate risk First Street
- Flood 1/10 Low FEMA zone X (unshaded) · 0% chance over 30 yrs
- Wildfire 1/10 Low
- Heat 6/10 Major 7 d/yr ≥96°F today · 15 d/yr by 30 yrs out
- Wind 8/10 Severe 80% chance of damaging wind over 30 yrs
- Air quality 2/10 Low 1 unhealthy d/yr today · 2 by 30 yrs out
Nearby sold comps map
Loading sold comps map…
Walkable amenities ~0.75 mi
Loading nearby amenities…
Taxation est. · year 1
- Rental income
- $49,860
- − Mortgage interest
- −$24,641
- − Property taxes
- −$3,379
- − Insurance
- −$2,200
- − Repairs & maintenance
- −$3,989
- − Management
- −$3,989
- − Depreciation
- −$12,797
- Taxable loss
- −$1,134
- Est. tax savings @ 24.0%
- +$272
- After-tax cash flow
- $6,401/yr
For passive investors: Depreciation is non-cash, so a rental often shows a tax loss while cash-flowing — sheltering income. Rental losses are passive: they offset passive income freely, and up to $25,000/yr can offset ordinary (W-2) income if you actively participate and your MAGI is under $100k (phasing out to $0 by $150k); unused losses carry forward. On sale, claimed depreciation is recaptured at up to 25%, and gains may owe capital-gains tax (a 1031 exchange can defer both). Figures are a year-1 estimate at your 24.0% rate — not tax advice; consult a CPA.
Schools (NCES district)
- District
- Fall River
- NCES district ID
- 2504830
- Math proficiency
- 17% ▼ -15.00%
- Reading proficiency
- 28% ▼ -6.00%
- Median HH income
- $35,773
- Composite
- 18.59/100
- National rank
- #8905
- State rank
- #288 of 302 in MA
Livability — Fall River
- Score
- 61/100
- State rank
- #221
- US rank
- #18220
Category grades
Schools grade is shown separately in the Schools card above.
Census & demographics
- Census place
- Fall River, MA
- County
- Bristol County · 342,083 people
- City population
- 93,033
- Metro
- Providence-Warwick, RI-MA
- Population (ZIP)
- 30,940
- Household income
- $62,196
- Rent vs Own
- Severe rent burden
- 2239.0
Population outlook (Bristol County) Hauer SSP2
- Today (2025)
- 570,212 people
- By 2030
- 571,181 · +0.2%
- By 2040
- 565,389 · -0.8%
- By 2050
- 552,141 · -3.2%
- By 2075
- 520,923 · -8.6%
- By 2100
- 474,363 · -16.8%
Race, ethnicity, and origin ACS 2023
- Neighborhood character
- Predominantly White (75%)
- Race & ethnicity
- White 75% Hispanic / Latino 11% Two or more races 8% Black 6% Asian 3%
- Hispanic origin (detail)
- Puerto Rican 5% Dominican 1%
- Common ancestry
- Russian 37% Lithuanian 7% Romanian 2%
- Foreign-born
- 21% · Canada, China, Jamaica
- Languages at home
- 66% English-only · Other Indo-European 21% Spanish 8% French/Haitian/Cajun 2%
Political lean MEDSL · Bristol
- 2024 margin
- Toss-up / Even · D 49.8% · R 48.5% · Other 1.8%
- 2008→2024 swing
- -21.9pp toward R · 2008: 23.2pp · 2024: 1.3pp
- All cycles
- 2024: D+1.3 2020: D+12.0 2016: D+9.3 2012: D+20.5 2008: D+23.2
Not yet ingested
- Civics
- —
Market trends
- HPI YoY
- ▼ -63.98%
- Current HPI
- 360.4882
- Rent YoY
- ▲ 5.76%
- Metro
- Providence-Warwick, RI-MA
- State GDP YoY
- ▲ 2.28%
- F500 in state
- 38
Industry mix (Fortune 500 HQ in MA)
| Industry | F500 HQs | Revenue |
|---|---|---|
| Technology | 3 | $17B |
|
||
| Insurance | 2 | $84B |
|
||
| Retail | 2 | $76B |
|
||
| Life Sciences | 1 | $43B |
|
||
| Energy Technology | 1 | $31B |
|
||
| Aerospace / Defense | 1 | $18B |
|
||
Price history
+417.8% since first listed19 events — show timeline
- 2026-06-08 Price Changed $439,900 MLS PIN
- 2026-05-11 Listed $449,000 MLS PIN
- 2010-05-10 Sold (MLS) $80,000 MLS PIN
- 2009-11-10 Contingent — MLS PIN
- 2009-10-19 Price Changed $99,900 MLS PIN
- 2009-10-05 Price Changed $112,500 MLS PIN
- 2009-09-29 Price Changed $119,900 MLS PIN
- 2009-09-11 Price Changed $125,000 MLS PIN
- 2009-08-17 Price Changed $129,900 MLS PIN
- 2009-07-14 Price Changed $139,900 MLS PIN
- 2009-06-29 Price Changed $149,900 MLS PIN
- 2009-06-19 Listed $159,900 MLS PIN
- 2004-04-28 Sold (Public Records) $155,500 Public Records
- 2004-04-27 Sold (MLS) $155,500 MLS PIN
- 2004-03-04 Listing Removed — MLS PIN
- 2003-01-07 Listed $164,900 MLS PIN
- 2000-10-31 Sold (Public Records) $67,500 Public Records
- 2000-10-31 Sold (MLS) $67,500 MLS PIN
- 2000-03-25 Listed $84,950 MLS PIN
Property tax history
+5.6%/yrLatest (2023): $3,379 · +9.2% YoY. Source: county tax records.
Cash-flow waterfall
monthlySold comps — $/sqft
last 12 mo · ≤1 miLoading sold comps…