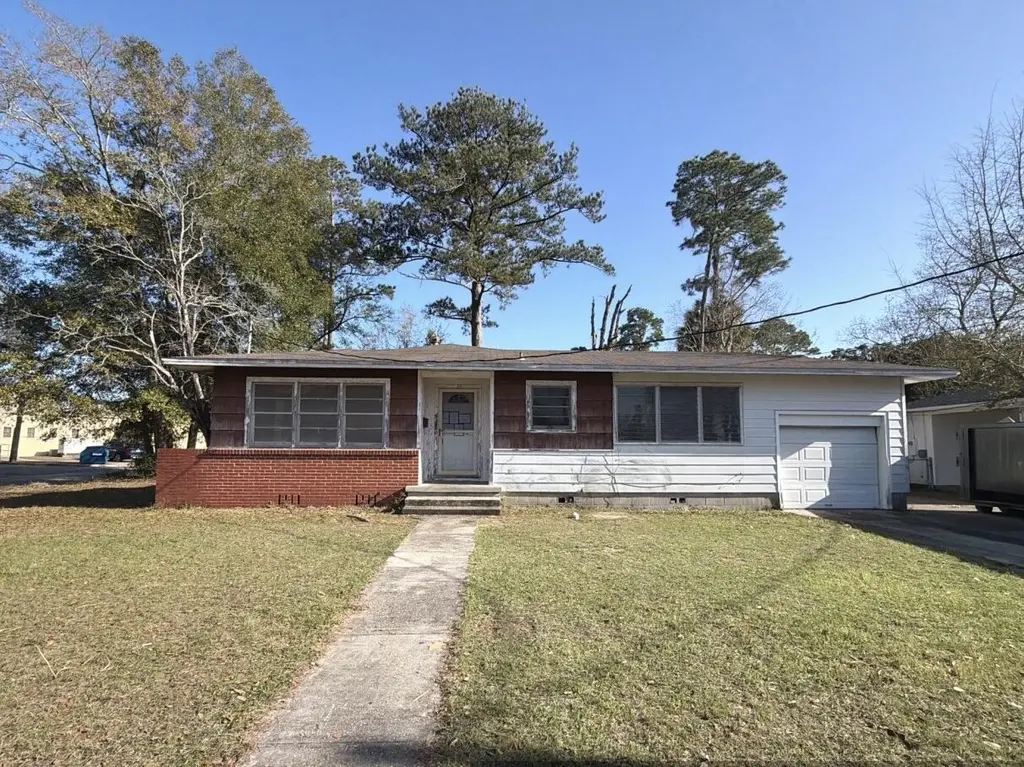
29 Escalona Ave · Pensacola, FL
Flood risk 1/10 · Minimal
- FEMA flood zone
- X (unshaded)
- Chance of flooding over 30 yrs
- 0.0%
- Est. flood insurance / yr
- $507 – $1,088
Fire risk 1/10 · Minimal
- Est. fire insurance / yr
- $947 – $1,759
Heat risk 10/10 · Severe
- Hot days now (above 105°F)
- 7 days/yr
- Hot days in 30 yrs
- 22 days/yr
Wind risk 9/10 · Severe
- Chance of severe wind over 30 yrs
- 99.0%
Air-quality risk 2/10 · Minimal
- Unhealthy air days now
- 0 days/yr
- Unhealthy air days in 30 yrs
- 1 days/yr
Risk factors via First Street. Map © Google.
Why this score? — see what drove the B grade
The composite is a weighted blend of 9 inputs, each scored 0–100. Each bar is that input's sub-score; the figure is the points it added to the 100-point composite (weight × sub-score).
- Cash flow +30.0/30.0
- 1% rule +10.0/10.0
- DSCR +10.0/10.0
- ARV discount +7.5/15.0
- Livability +4.2/5.0
- Schools +3.6/10.0
- Rent growth +3.3/5.0
- Condition / age +2.5/5.0
- Appreciation +0.0/10.0
$89,900
🖨 Deal sheet (PDF) 📄 Offer letter ✓ Due diligence
Listing remarks
Located just a few miles from the bustling down town area and the ever active mall, hospital, and airport, this REO opportunity is just that. .. opportunity knocking. Built originally in the 1950s, this 3 bedroom 1 bath home rests on a large corner lot and comes with both a detached carport (with extra storage) and an attached 1 car garage. The lot is mostly fenced and is a larger corner lot. Home needs repairs and will not qualify for most financing, cash or renovation loans are best. Under FinCEN's new RRE Rule, transfers will be subject to reporting when buyers use entities or trusts to take title to residential real estate, when the transaction is all cash, privately financed or HELOC.
Key facts
- Detached carport
- Extra storage
- Attached garage
Tags
Neighborhood map
What this means for you Summary
Snapshot
- This is a 3-bed/1.0-bath single-family listed at $90k.
Deal economics
- At list price, monthly cash flow is $768 ($9k/yr) — positive.
- The deal already cash-flows at list — no discount required.
- Meets the 1% rule at list price ($2k rent vs $90k).
- Cap rate 16.5% vs local median 3.6% in Pensacola — top-decile yield for the area; either an underpriced asset or a hidden risk that comps aren't pricing in. Stress-test before assuming the spread holds.
Location & tenants
- Location reads 83/100 on livability (#53 in FL, #924 nationally) — a professional / high-income tenant draw. Strengths: commute A+, cost of living A+, housing A+.
- Escambia (suburban): math 40% / reading 45% proficiency, ranked #56 of 73 in FL (top 77%) — families likely to look elsewhere, expect single-tenant / working-renter base with shorter leases.
- Zoned schools: O. J. Semmes Elementary School (math 22% / reading 17%, grade F, #2,105 of 2,144 statewide, top 98%, 302 students, 91% FRL); Washington Senior High School (math 25% / reading 40%, grade F, #411 of 667 statewide, top 62%, 1,733 students, 51% FRL).
- Zoned-school proficiency averages 26% at this address vs 42% district-wide (-16 pts) — the specific schools serving this property underperform the Escambia average; the district grade overstates school quality for this exact location.
- Market conditions: Rents rising (+3.4%/yr); 240 active listings in the ZIP; 10 comparable units currently listed for rent nearby; rentals at typical pace (median 24d on market — plan ~3-4 weeks tenant-placement turnaround); 1,479 units permitted in Escambia County in 2024 (0 in 5+ unit buildings).
- This rent runs 32% of the median local income ($71k/yr) — at the standard rent-burdened threshold; future hikes will face affordability resistance.
Forward outlook
- Local home prices are declining (-3.0%/yr); year-one equity from $622 of loan paydown is wiped out by about $3k of value loss. Plan a longer hold.
- Escambia County population projected at +13% by 2050 — modest demand growth; plan on rents tracking national, not racing it.
- At projected returns (-3.0% appreciation + 3.4% rent growth), your $25k cash investment doubles in ~4 years — after that, you're playing with house money.
Negotiation context
- Only 13 days on market — expect competitive offers; lowballing is unlikely to land.
- Current owner paid $37k; list at $90k implies a 143% gain — meaningful room to come down on a strong offer.
Risks & watch-outs
- Watch-outs: property tax is 2.7% of price; built in 1950 — expect roof / HVAC / electrical / plumbing capex.
- Climate carrying-cost: severe wind risk, 99% chance of damaging wind over 30y; extreme-heat days projected 7→22/yr by 2055 (HVAC capex compounding) — expect insurance premiums to compound above CPI over the hold.
Questions for the listing agent
- Built in 1950 — when were the roof, HVAC, electrical panel, plumbing, and water heater last replaced?
- Property tax is high relative to price — has the assessment been appealed recently, and will the sale trigger a re-assessment?
- Is there a deadline driving the sale (1031 exchange, divorce, estate, relocation)? That informs how much negotiation room exists.
- What's the average days-on-market for RENTAL listings here right now (not sales)? A rising rental-DOM trend means longer vacancies and softer asking-rent achievability than the comps imply.
- What's the recent tenant-quality profile in this submarket — average credit score on applications, eviction rate, late-payment / NSF rate, and stable-employment percentage? A property-management company in the area should have these aggregated.
- How much new for-sale + rental construction is in the pipeline within 1–3 miles? Heavy new supply typically softens prices + rents 12–24 months out; constrained supply supports both.
Investment metrics
- 1% rule
- 2.09% ✓
- Cap rate
- 16.55%
- Cash-on-cash
- 36.63%
- DSCR
- 2.63
- GRM
- 4.0
CMA / ARV
- ARV (on-the-fly)
- $230,278
- Comps found
- 12
Show comp detail 12 sales within ~0.75 mi
| Address | Dist | Beds/Ba | Sqft | Sold | Price | $/sf | Match |
|---|---|---|---|---|---|---|---|
| 1007 E Hayes St | 0.12mi | 3/2.0 | 1,247 (+5%) | 3mo | $210,000 | $168 | 79 |
| 3151 Torres Ave | 0.24mi | 3/1.0 | 1,234 (+4%) | 6mo | $48,000 | $39 | 78 |
| 904 E Texar Dr | 0.17mi | 3/1.5 | 1,036 (-13%) | 2mo | $210,000 | $203 | 67 |
| 2911 N Hayne St | 0.55mi | 4/2.0 (+1) | 1,206 (+2%) | 2mo | $168,000 | $139 | 62 |
| 1109 E Hatton St | 0.45mi | 3/2.0 | 1,250 (+5%) | 7mo | $339,000 | $271 | 61 |
| 2345 N 8th Ave | 0.63mi | 3/2.0 | 1,120 (-6%) | 2mo | $234,000 | $209 | 55 |
| 2412 N 7th Ave | 0.58mi | 3/2.0 | 1,084 (-9%) | 4mo | $210,000 | $194 | 51 |
| 211 E Anderson St | 0.63mi | 3/2.0 | 1,286 (+8%) | 3mo | $249,000 | $194 | 50 |
| 3417 N Tarragona St | 0.61mi | 3/1.0 | 1,064 (-10%) | 7mo | $159,900 | $150 | 49 |
| 205 E Hatton St | 0.74mi | 3/2.0 | 1,064 (-10%) | 2mo | $200,000 | $188 | 43 |
| 2911 N Miller St | 0.72mi | 3/2.0 | 1,345 (+13%) | 2mo | $240,000 | $178 | 39 |
| 1401 E Bobe | 0.71mi | 2/1.0 (-1) | 1,330 (+12%) | 8mo | $329,000 | $247 | 35 |
Match score weights: distance 35% · size 25% · config 20% · recency 20%. Top-matched comps best support the ARV.
Projected returns pro-forma
-3.0% appreciation · 3.39% rent growth · sell at horizon
- IRR
- 33.0%
- Equity multiple
- 2.40×
- Total profit
- $35,197
- Equity at exit
- $13,404
- IRR
- 40.2%
- Equity multiple
- 4.86×
- Total profit
- $97,073
- Equity at exit
- $7,773
Cash invested: $25,172 (down + closing). Projections, not guarantees.
Landlord ↔ Tenant lean methodology
- Overall (STATE)
- 87 Strongly Landlord-Friendly
- State Florida
- 87 Strongly Landlord-Friendly · R+3
- County
- — inherits STATE
- City
- — inherits STATE
ZIP-level market 32503
- Rents YoY
- 3.4%
- Active inventory
- 240
- Price-to-rent
- 4.0×
Monthly cashflow live
- Estimated rent
- $1,877 high interval (Pro) →
- Mortgage (P&I)
- −$471
- Tax from tax record
- −$206 /mo · $2,469/yr
- Insurance
- −$37
- HOA
- −$0
- Vacancy / Maint / Mgmt
- −$394
- Net cashflow
- $768
Break-even live
Sensitivity live
| Price | -10% $819 | -5% $794 | +0% $768 | +5% $743 | +10% $717 |
|---|---|---|---|---|---|
| Rent | -10% $620 | -5% $694 | +0% $768 | +5% $843 | +10% $917 |
| Rate | -1.0pp $814 | -0.5pp $791 | base $768 | +0.5pp $745 | +1.0pp $721 |
UW: 25.0% down · 7.5% · 30yr · 1.5% tax · 5.0% vac · 8.0% maint · 8.0% mgmt
Financing live
Cash to close
- Down payment
- $22,475
- Closing costs
- $2,697
- Reserves months
- —
- Total cash needed
- —
Loan-product check · same deal, 3 products live
Conventional
25% down · 7.5% · 30yr
- Down + closing
- —
- Monthly P&I
- —
- Monthly cashflow
- —
- DSCR
- —
- Eligible?
- —
Personal DTI + credit; lowest rate.
DSCR
20% down · 8.5% · 30yr
- Down + closing
- —
- Monthly P&I
- —
- Monthly cashflow
- —
- DSCR
- —
- Eligible?
- —
No personal income docs; deal must DSCR.
Hard money
10% down · 12.0% · 12mo
- Down + closing
- —
- Monthly P&I
- —
- Monthly cashflow
- —
- DSCR
- —
- Eligible?
- —
Short-term bridge; refi at stabilization.
Rent comps 10 comps
| Address | Beds | Baths | Sqft | Rent | $/sqft | DOM | Units | Dist |
|---|---|---|---|---|---|---|---|---|
| 3131 N 10th Ave Pensacola, FL | 3.0 | 1.5 | 1085 | $1,700 | $1.57 | 24d | 1 | 0.13mi |
| 2115 N 12th Ave Pensacola, FL | 2.0 | 1.5 | 950 | $1,800 | $1.89 | 14d | 1 | 0.76mi |
| 2008 N 8th Ave Pensacola, FL | 3.0 | 2.0 | 1058 | $1,250 | $1.18 | 14d | 1 | 0.85mi |
| 1414 E Mallory St Pensacola, FL | 3.0 | 2.0 | 1323 | $3,400 | $2.57 | 24d | 1 | 1.10mi |
| 407 W Jordan St Unit NA Pensacola, FL | 3.0 | 2.0 | 1300 | $2,200 | $1.69 | 24d | 1 | 1.32mi |
| 1704 E Lee St Pensacola, FL | 3.0 | 2.0 | 1226 | $2,295 | $1.87 | 24d | 1 | 1.37mi |
| 531 Ditmar St Unit B Pensacola, FL | 2.0 | 1.0 | 1094 | $1,450 | $1.33 | 24d | 1 | 1.37mi |
| 721 W Jordan St Pensacola, FL | 3.0 | 2.0 | 1030 | $1,895 | $1.84 | 24d | 1 | 1.41mi |
| 801 E Gonzalez St Pensacola, FL | 3.0 | 2.0 | 1200 | $2,200 | $1.83 | 14d | 1 | 1.48mi |
| 1106 Doctor Martin Luther King Junior Dr Unit A Pensacola, FL | 2.0 | 1.0 | 762 | $1,295 | $1.70 | 14d | 1 | 1.49mi |
Listing history 5 events
-
2026-04-03status Pending
-
2026-03-19$89,900 Active
-
1991-12-01soldstatus $37,000
-
1984-10-01soldstatus $33,500
-
1967-01-01soldstatus $13,000
ⓘ Source: listings_history table (triggers on properties + properties_extension) + one-shot
backfill from property_details.listing_events for pre-trigger history.
Tax reassessment forecast FL · Resets to sale price
- Current annual tax
- $2,469 · $206/mo
- Projected year-2 tax
- $2,469 · $206/mo
- Expected delta
- $0/yr ($0/mo · 0.0%)
ⓘ Screening estimate from a state-policy table — verify with the county assessor before closing.
Climate risk First Street
- Flood 1/10 Low FEMA zone X (unshaded) · 0% chance over 30 yrs
- Wildfire 1/10 Low
- Heat 10/10 Extreme 7 d/yr ≥105°F today · 22 d/yr by 30 yrs out
- Wind 9/10 Extreme 99% chance of damaging wind over 30 yrs
- Air quality 2/10 Low 0 unhealthy d/yr today · 1 by 30 yrs out
Nearby sold comps map
Loading sold comps map…
Walkable amenities ~0.75 mi
Loading nearby amenities…
Taxation est. · year 1
- Rental income
- $22,528
- − Mortgage interest
- −$5,036
- − Property taxes
- −$2,469
- − Insurance
- −$450
- − Repairs & maintenance
- −$1,802
- − Management
- −$1,802
- − Depreciation
- −$2,615
- Taxable income
- $8,353
- Est. tax owed @ 24.0%
- −$2,005
- After-tax cash flow
- $7,216/yr
For passive investors: Depreciation is non-cash, so a rental often shows a tax loss while cash-flowing — sheltering income. Rental losses are passive: they offset passive income freely, and up to $25,000/yr can offset ordinary (W-2) income if you actively participate and your MAGI is under $100k (phasing out to $0 by $150k); unused losses carry forward. On sale, claimed depreciation is recaptured at up to 25%, and gains may owe capital-gains tax (a 1031 exchange can defer both). Figures are a year-1 estimate at your 24.0% rate — not tax advice; consult a CPA.
Schools (NCES district)
- District
- Escambia
- NCES district ID
- 1200510
- Math proficiency
- 40% ▼ -9.00%
- Reading proficiency
- 45% ▼ -4.00%
- Median HH income
- $44,649
- Composite
- 36.04/100
- National rank
- #4773
- State rank
- #56 of 73 in FL
Livability — Pensacola
- Score
- 83/100
- State rank
- #53
- US rank
- #924
Category grades
Schools grade is shown separately in the Schools card above.
Census & demographics
- Census place
- Pensacola, FL
- County
- Escambia County · 301,722 people
- City population
- 237,636
- Metro
- Pensacola-Ferry Pass-Brent, FL
- Population (ZIP)
- 33,559
- Household income
- $71,411
- Rent vs Own
- Severe rent burden
- 948.0
Population outlook (Escambia County) Hauer SSP2
- Today (2025)
- 334,637 people
- By 2030
- 345,779 · +3.3%
- By 2040
- 364,828 · +9.0%
- By 2050
- 378,514 · +13.1%
- By 2075
- 403,220 · +20.5%
- By 2100
- 386,125 · +15.4%
Race, ethnicity, and origin ACS 2023
- Neighborhood character
- Predominantly White (68%)
- Race & ethnicity
- White 68% Black 20% Two or more races 6% Hispanic / Latino 5% Asian 2%
- Common ancestry
- Lithuanian 3% Italian 2% Romanian 2%
- Foreign-born
- 5% · Canada, China
- Languages at home
- 93% English-only · Spanish 3% Arabic 1% Tagalog/Filipino 1%
Political lean MEDSL · Escambia
- 2024 margin
- R (+19.5) · D 39.7% · R 59.2% · Other 1.1%
- 2008→2024 swing
- -0.2pp no change · 2008: -19.3pp · 2024: -19.5pp
- All cycles
- 2024: R+19.5 2020: R+15.1 2016: R+20.6 2012: R+20.6 2008: R+19.3
Not yet ingested
- Civics
- —
Market trends
- HPI YoY
- ▼ -300.02%
- Current HPI
- 294.4873
- Rent YoY
- ▲ 3.39%
- Metro
- Pensacola-Ferry Pass-Brent, FL
- State GDP YoY
- ▲ 3.28%
- F500 in state
- 36
Industry mix (Fortune 500 HQ in FL)
| Industry | F500 HQs | Revenue |
|---|---|---|
| Industrial Technology | 2 | $29B |
|
||
| Insurance | 2 | $17B |
|
||
| Retail | 1 | $60B |
|
||
| Technology Distribution | 1 | $58B |
|
||
| Homebuilding | 1 | $35B |
|
||
| Technology Manufacturing | 1 | $35B |
|
||
Price history
+591.5% since first listed5 events — show timeline
- 2026-04-03 Pending — ECAR
- 2026-03-19 Listed $89,900 ECAR
- 1991-12-01 Sold (Public Records) $37,000 Public Records
- 1984-10-01 Sold (Public Records) $33,500 Public Records
- 1967-01-01 Sold (Public Records) $13,000 Public Records
Property tax history
+22.4%/yrLatest (2025): $2,469 · +10.1% YoY. Source: county tax records.
Cash-flow waterfall
monthlySold comps — $/sqft
last 12 mo · ≤1 miLoading sold comps…