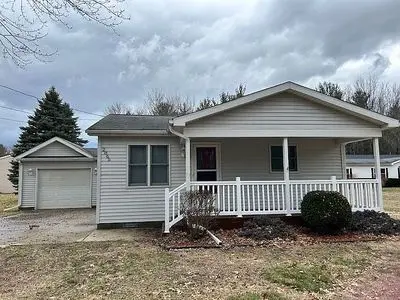
2865 E Burt Rd · Burt, MI
Flood risk 1/10 · Minimal
- FEMA flood zone
- X (unshaded)
- Chance of flooding over 30 yrs
- 0.0%
- Est. flood insurance / yr
- $507 – $1,088
Fire risk 3/10 · Minor
- Est. fire insurance / yr
- $784 – $1,456
Heat risk 2/10 · Minimal
- Hot days now (above 98°F)
- 7 days/yr
- Hot days in 30 yrs
- 14 days/yr
Wind risk 1/10 · Minimal
- Chance of severe wind over 30 yrs
- —
Air-quality risk 2/10 · Minimal
- Unhealthy air days now
- 1 days/yr
- Unhealthy air days in 30 yrs
- 2 days/yr
Risk factors via First Street. Map © Google.
Why this score? — see what drove the C+ grade
The composite is a weighted blend of 9 inputs, each scored 0–100. Each bar is that input's sub-score; the figure is the points it added to the 100-point composite (weight × sub-score).
- Cash flow +26.5/30.0
- DSCR +9.0/10.0
- ARV discount +7.5/15.0
- 1% rule +7.1/10.0
- Schools +3.4/10.0
- Livability +3.4/5.0
- Rent growth +2.5/5.0
- Condition / age +2.5/5.0
- Appreciation +0.0/10.0
$139,900
🖨 Deal sheet (PDF) 📄 Offer letter ✓ Due diligence
Listing remarks
Discover the charm to this thoughtfully laid out 2 Bedroom home built in 1950. Offering 768 sq feet of living space designed for efficiency and cost effective monthly bills. This home is perfect for 1-2 people, appealing to new home owners or someone looking to down size. It is a perfect layout for 1 bedroom and a small office. Living Room is 14x12 Master Bedroom is 12.9x10.5 Bedroom 2/Office Space is 9x8 which leads to nice deck and fenced in backyard. One car garage offering additional storage/work space area. This home has many updates, including City Water, Home Generator, New Air Conditioner, Anderson Windows, Vinyl Siding, New Septic , Fenced in back yard with a beautiful deck area. I
Key facts
- Anderson windows
- New septic
- Home generator
Tags
Neighborhood map
What this means for you Summary
Snapshot
- This is a 2-bed/1.0-bath single-family listed at $140k.
Deal economics
- At list price, monthly cash flow is $369 ($4k/yr) — positive.
- The deal already cash-flows at list — no discount required.
- Meets the 1% rule at list price ($2k rent vs $140k).
- Recommended offer: $138k (1.5% below list) — sets the bar for market timing.
Location & tenants
- Location reads 67/100 on livability (#403 in MI) — a middle-class / working-renter tenant base. Strengths: crime A+, cost of living A+, housing A+; Watch: amenities F, commute F, health & safety F.
- Birch Run Area Schools (rural): math 33% / reading 44% proficiency, ranked #223 of 540 in MI (top 41%) — families likely to look elsewhere, expect single-tenant / working-renter base with shorter leases.
- Zoned schools: North Elementary School (math 29% / reading 41%, grade F, #735 of 1,397 statewide, top 53%, 667 students, 62% FRL); Marshall Greene Middle School (math 37% / reading 42%, grade F, #215 of 493 statewide, top 45%, 548 students, 59% FRL); Birch Run High School (math 32% / reading 62%, grade D-, #187 of 713 statewide, top 29%, 573 students, 50% FRL) — zoned schools average 57% FRL vs 39% district-wide (18 pts higher); higher-poverty schools than district average — tighter screening recommended.
- Market conditions: 10 active listings in the ZIP; 154 units permitted in Saginaw County in 2024 (0 in 5+ unit buildings).
Forward outlook
- Local home prices are declining (-3.0%/yr); year-one equity from $967 of loan paydown is wiped out by about $4k of value loss. Plan a longer hold.
- Saginaw County population projected at -25% by 2050 — secular population decline; favor cash flow + early exit over multi-decade hold.
- At projected returns (-3.0% appreciation + 3.0% rent growth), your $39k cash investment doubles in ~10 years — after that, you're playing with house money.
Negotiation context
- It's been on market 27 days — a 2% lower offer ($138k) is reasonable based on typical stale-listing flexibility.
Risks & watch-outs
- Watch-outs: built in 1950 — expect roof / HVAC / electrical / plumbing capex.
Questions for the listing agent
- Built in 1950 — when were the roof, HVAC, electrical panel, plumbing, and water heater last replaced?
- Is there a deadline driving the sale (1031 exchange, divorce, estate, relocation)? That informs how much negotiation room exists.
- Schools are F-rated, which usually means shorter tenancies and higher turnover. Who's the typical renter profile here, and what's been the actual vacancy rate?
- What's the average days-on-market for RENTAL listings here right now (not sales)? A rising rental-DOM trend means longer vacancies and softer asking-rent achievability than the comps imply.
- What's the recent tenant-quality profile in this submarket — average credit score on applications, eviction rate, late-payment / NSF rate, and stable-employment percentage? A property-management company in the area should have these aggregated.
- How much new for-sale + rental construction is in the pipeline within 1–3 miles? Heavy new supply typically softens prices + rents 12–24 months out; constrained supply supports both.
Investment metrics
- 1% rule
- 1.21% ✓
- Cap rate
- 9.46%
- Cash-on-cash
- 11.31%
- DSCR
- 1.50
- GRM
- 6.9
CMA / ARV
No comps found within radius.
Projected returns pro-forma
-3.0% appreciation · 3.0% rent growth · sell at horizon
- IRR
- 0.6%
- Equity multiple
- 1.02×
- Total profit
- $877
- Equity at exit
- $20,860
- IRR
- 10.2%
- Equity multiple
- 1.80×
- Total profit
- $31,155
- Equity at exit
- $12,096
Cash invested: $39,172 (down + closing). Projections, not guarantees.
Landlord ↔ Tenant lean methodology
- Overall (STATE)
- 62 Landlord-Friendly
- State Michigan
- 62 Landlord-Friendly · EVEN
- County
- — inherits STATE
- City
- — inherits STATE
ZIP-level market 48417
- Home prices YoY
- -29.9%
- Active inventory
- 10
- Price-to-rent
- 6.9×
Monthly cashflow live
- Estimated rent
- $1,691 medium interval (Pro) →
- Mortgage (P&I)
- −$734
- Tax est. 1.5%
- −$175 /mo · $2,098/yr
- Insurance
- −$58
- HOA
- −$0
- Vacancy / Maint / Mgmt
- −$355
- Net cashflow
- $369
Break-even live
Sensitivity live
| Price | -10% $466 | -5% $418 | +0% $369 | +5% $321 | +10% $273 |
|---|---|---|---|---|---|
| Rent | -10% $236 | -5% $303 | +0% $369 | +5% $436 | +10% $503 |
| Rate | -1.0pp $440 | -0.5pp $405 | base $369 | +0.5pp $333 | +1.0pp $296 |
UW: 25.0% down · 7.5% · 30yr · 1.5% tax · 5.0% vac · 8.0% maint · 8.0% mgmt
Financing live
Cash to close
- Down payment
- $34,975
- Closing costs
- $4,197
- Reserves months
- —
- Total cash needed
- —
Loan-product check · same deal, 3 products live
Conventional
25% down · 7.5% · 30yr
- Down + closing
- —
- Monthly P&I
- —
- Monthly cashflow
- —
- DSCR
- —
- Eligible?
- —
Personal DTI + credit; lowest rate.
DSCR
20% down · 8.5% · 30yr
- Down + closing
- —
- Monthly P&I
- —
- Monthly cashflow
- —
- DSCR
- —
- Eligible?
- —
No personal income docs; deal must DSCR.
Hard money
10% down · 12.0% · 12mo
- Down + closing
- —
- Monthly P&I
- —
- Monthly cashflow
- —
- DSCR
- —
- Eligible?
- —
Short-term bridge; refi at stabilization.
Listing history 19 events
-
2026-06-22days on market $139,900 Active 27 DOM
-
2026-06-21days on market $139,900 Active 26 DOM
-
2026-06-21days on market $139,900 Active 25 DOM
-
2026-06-18days on market $139,900 Active 23 DOM
-
2026-06-17days on market $139,900 Active 22 DOM
-
2026-06-16days on market $139,900 Active 21 DOM
-
2026-06-15days on market $139,900 Active 20 DOM
-
2026-06-13days on market $139,900 Active 18 DOM
-
2026-06-12days on market $139,900 Active 17 DOM
-
2026-06-09days on market $139,900 Active 14 DOM
-
2026-06-08days on market $139,900 Active 13 DOM
-
2026-06-07days on market $139,900 Active 12 DOM
-
2026-06-07days on market $139,900 Active 11 DOM
-
2026-06-04days on market $139,900 Active 8 DOM
-
2026-06-02days on market $139,900 Active 7 DOM
-
2026-06-01days on market $139,900 Active 6 DOM
-
2026-05-31days on market $139,900 Active 5 DOM
-
2026-05-31days on market $139,900 Active 4 DOM
-
2026-05-26$139,900 Active
ⓘ Source: listings_history table (triggers on properties + properties_extension) + one-shot
backfill from property_details.listing_events for pre-trigger history.
Climate risk First Street
- Flood 1/10 Low FEMA zone X (unshaded) · 0% chance over 30 yrs
- Wildfire 3/10 Moderate
- Heat 2/10 Low 7 d/yr ≥98°F today · 14 d/yr by 30 yrs out
- Wind 1/10 Low
- Air quality 2/10 Low 1 unhealthy d/yr today · 2 by 30 yrs out
Nearby sold comps map
Loading sold comps map…
Walkable amenities ~0.75 mi
Loading nearby amenities…
Taxation est. · year 1
- Rental income
- $20,296
- − Mortgage interest
- −$7,837
- − Property taxes
- −$2,098
- − Insurance
- −$700
- − Repairs & maintenance
- −$1,624
- − Management
- −$1,624
- − Depreciation
- −$4,070
- Taxable income
- $2,344
- Est. tax owed @ 24.0%
- −$563
- After-tax cash flow
- $3,869/yr
For passive investors: Depreciation is non-cash, so a rental often shows a tax loss while cash-flowing — sheltering income. Rental losses are passive: they offset passive income freely, and up to $25,000/yr can offset ordinary (W-2) income if you actively participate and your MAGI is under $100k (phasing out to $0 by $150k); unused losses carry forward. On sale, claimed depreciation is recaptured at up to 25%, and gains may owe capital-gains tax (a 1031 exchange can defer both). Figures are a year-1 estimate at your 24.0% rate — not tax advice; consult a CPA.
Schools (NCES district)
- District
- Birch Run Area Schools
- NCES district ID
- 2605820
- Math proficiency
- 33% ▼ -7.00%
- Reading proficiency
- 44% ▼ -4.00%
- Median HH income
- $53,432
- Composite
- 33.54/100
- National rank
- #5430
- State rank
- #223 of 540 in MI
Livability — Burt
- Score
- 67/100
- State rank
- #403
- US rank
- #10945
Category grades
Schools grade is shown separately in the Schools card above.
Census & demographics
- Census place
- Burt, MI
- Population (ZIP)
- 2,310
Population outlook (Saginaw County) Hauer SSP2
- Today (2025)
- 180,568 people
- By 2030
- 172,302 · -4.6%
- By 2040
- 153,919 · -14.8%
- By 2050
- 135,519 · -24.9%
- By 2075
- 97,199 · -46.2%
- By 2100
- 65,037 · -64.0%
Race, ethnicity, and origin ACS 2023
- Neighborhood character
- Predominantly White (86%)
- Race & ethnicity
- White 86% Two or more races 10% Hispanic / Latino 7% Asian 1%
- Hispanic origin (detail)
- Mexican 5%
- Common ancestry
- Lithuanian 11% Romanian 9% Slovak 2%
- Foreign-born
- 1%
- Languages at home
- 98% English-only · Spanish 2%
Political lean MEDSL · Saginaw
- 2024 margin
- Toss-up / Even · D 47.7% · R 51.0% · Other 1.4%
- 2008→2024 swing
- -20.6pp toward R · 2008: 17.3pp · 2024: -3.3pp
- All cycles
- 2024: R+3.3 2020: D+0.3 2016: R+1.1 2012: D+11.9 2008: D+17.3
Not yet ingested
- Civics
- —
Market trends
- HPI YoY
- ▼ -86.25%
- Current HPI
- 202.2839
- Rent YoY
- —
- Metro
- —
- State GDP YoY
- ▲ 1.37%
- F500 in state
- 28
Industry mix (Fortune 500 HQ in MI)
| Industry | F500 HQs | Revenue |
|---|---|---|
| Automotive Parts | 3 | $48B |
|
||
| Automotive | 2 | $372B |
|
||
| Chemicals | 1 | $45B |
|
||
| Automotive Retail | 1 | $29B |
|
||
| Healthcare / Medical Devices | 1 | $23B |
|
||
| Automotive Technology | 1 | $20B |
|
||
Price history
1 event — show timeline
- 2026-05-26 Listed $139,900 FSBO.com
Property tax history
-6.4%/yrLatest (2025): $257 · -70.6% YoY. Source: county tax records.
Cash-flow waterfall
monthlySold comps — $/sqft
last 12 mo · ≤1 miLoading sold comps…