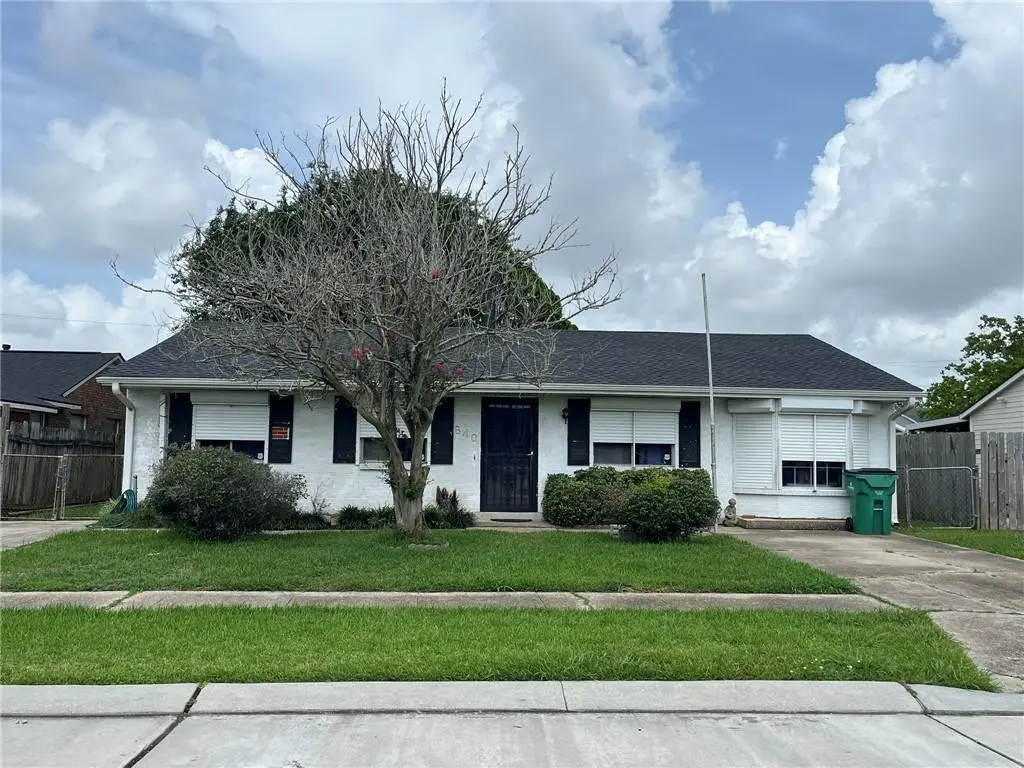
840 Morningside Dr · Terrytown, LA
Flood risk 8/10 · Major
- FEMA flood zone
- X
- Chance of flooding over 30 yrs
- 0.6%
- Est. flood insurance / yr
- $507 – $1,088
Fire risk 1/10 · Minimal
- Est. fire insurance / yr
- $1,269 – $2,357
Heat risk 10/10 · Severe
- Hot days now (above 108°F)
- 7 days/yr
- Hot days in 30 yrs
- 21 days/yr
Wind risk 10/10 · Severe
- Chance of severe wind over 30 yrs
- 99.0%
Air-quality risk 2/10 · Minimal
- Unhealthy air days now
- 2 days/yr
- Unhealthy air days in 30 yrs
- 2 days/yr
Risk factors via First Street. Map © Google.
Why this score? — see what drove the B grade
The composite is a weighted blend of 9 inputs, each scored 0–100. Each bar is that input's sub-score; the figure is the points it added to the 100-point composite (weight × sub-score).
- Cash flow +28.6/30.0
- ARV discount +15.0/15.0
- DSCR +10.0/10.0
- 1% rule +6.9/10.0
- Livability +3.5/5.0
- Rent growth +2.5/5.0
- Schools +2.5/10.0
- Condition / age +2.5/5.0
- Appreciation +0.0/10.0
$145,000
🖨 Deal sheet 📄 Offer letter ✓ Due diligence
Listing remarks
3-bedroom, 2-bath home offering approx 1,410 sq ft of comfortable living space! This property features a brick front with low-maintenance vinyl siding on the remaining sides. The home boasts a newer roof, hurricane shutters, and an enclosed garage for added living area. Enjoy outdoor living under the rear patio in the fully fenced yard. Additionally includes a metal storage shed with electricity and porch, and an additional plastic storage shed. This home is also wired for a generator. A great opportunity with tons of extras, it's just waiting for your personal touches and updates. Won't go FHA or VA, Looking for cash offers. Schedule your showing today! OWNER/AGENT
Key facts
- Enclosed garage
- Brick front
- Newer roof
Tags
Property features AI
Exterior
- Parking: Driveway
- Utilities: Public water; Public sewer
- Home design: Single-story home; Shingle roof; Brick and vinyl siding exterior; Slab foundation; Property in very good condition
- Construction: Built with brick and vinyl siding; Shingle roof; Slab foundation
- Exterior features: Fenced yard; Covered patio/porch; Shed(s); Workshop; City lot; Rectangular lot; Lot dimensions approximately 60 x 115
Interior
- Kitchen: Oven; Range
- Bedrooms: Total rooms: 7
- Bathrooms: 2 full bathrooms
- Heating & cooling: Central heating; Central air conditioning
- Interior features: Attic with pull-down attic stairs; Wood-burning fireplace
- Laundry & utility: Washer hookup; Dryer hookup; Washer (appliance present)
Neighborhood map
What this means for you Summary
Snapshot
- This is a 3-bed/2.0-bath single-family listed at $145k.
Deal economics
- At list price, monthly cash flow is $410 ($5k/yr) — positive.
- The deal already cash-flows at list — no discount required.
- Meets the 1% rule at list price ($2k rent vs $145k).
- Cap rate 10.2% vs local median 4.5% in Terrytown — top-decile yield for the area; either an underpriced asset or a hidden risk that comps aren't pricing in. Stress-test before assuming the spread holds.
Location & tenants
- Location reads 69/100 on livability (#73 in LA) — a middle-class / working-renter tenant base. Strengths: cost of living A+, housing A+, health & safety A; Watch: employment C-, crime F, amenities F.
- Jefferson Parish (suburban): math 24% / reading 34% proficiency, ranked #44 of 98 in LA (top 45%) — low school quality limits family demand, transient renter base, plan for 1-2y turnover; 70% free/reduced lunch — lower-income household profile, screen leases tightly.
- Market conditions: Rents soft (-0.2%/yr); 163 active listings in the ZIP; 39 comparable units currently listed for rent nearby; rentals at typical pace (median 24d on market — plan ~3-4 weeks tenant-placement turnaround); 41% of comp listings sitting > 30 days — soft ceiling on asking rent; 518 units permitted in Jefferson Parish in 2024 (43 in 5+ unit buildings).
- This rent runs 35% of the median local income ($59k/yr) — at the standard rent-burdened threshold; future hikes will face affordability resistance.
Forward outlook
- Local home prices are declining (-3.0%/yr); year-one equity from $1k of loan paydown is wiped out by about $4k of value loss. Plan a longer hold.
Negotiation context
- Only 3 days on market — expect competitive offers; lowballing is unlikely to land.
- 2 sale attempts with the ask held roughly flat each time — persistent listings suggest the price (not the market) is what's stuck; bring a comps-based counter.
Risks & watch-outs
- Watch-outs: flood insurance adds $66/mo.
- Climate carrying-cost: severe flood risk; severe wind risk, 99% chance of damaging wind over 30y; extreme-heat days projected 7→21/yr by 2055 (HVAC capex compounding) — expect insurance premiums to compound above CPI over the hold.
Questions for the listing agent
- Built in 1974 — when were the roof, HVAC, electrical panel, plumbing, and water heater last replaced?
- What's the actual annual flood-insurance premium (NFIP or private), and is the property in a SFHA with mandatory coverage?
- Is there a deadline driving the sale (1031 exchange, divorce, estate, relocation)? That informs how much negotiation room exists.
- Crime grade is F in this area — have there been break-ins, vandalism, or insurance claims at this property in the last 3 years? What carrier currently insures it and at what premium?
- What's the average days-on-market for RENTAL listings here right now (not sales)? A rising rental-DOM trend means longer vacancies and softer asking-rent achievability than the comps imply.
- What's the recent tenant-quality profile in this submarket — average credit score on applications, eviction rate, late-payment / NSF rate, and stable-employment percentage? A property-management company in the area should have these aggregated.
- How much new for-sale + rental construction is in the pipeline within 1–3 miles? Heavy new supply typically softens prices + rents 12–24 months out; constrained supply supports both.
Investment metrics
- 1% rule
- 1.19% ✓
- Cap rate
- 10.24%
- Cash-on-cash
- 14.09%
- DSCR
- 1.63
- GRM
- 7.0
CMA / ARV
- ARV (on-the-fly)
- $238,290
- Comps found
- 12
Show comp detail 12 sales within ~0.75 mi
| Address | Dist | Beds/Ba | Sqft | Sold | Price | $/sf | Match |
|---|---|---|---|---|---|---|---|
| 840 Morningside Dr | 0.00mi | 3/2.0 | 1,410 (0%) | 0mo | $125,000 | $89 | 100 |
| 2152 Legion Dr | 0.20mi | 3/2.0 | 1,400 (-1%) | 2mo | $249,000 | $178 | 88 |
| 828 Mystic Ave | 0.05mi | 3/2.0 | 1,308 (-7%) | 1mo | $220,000 | $168 | 84 |
| 2820 Live Oak Dr | 0.35mi | 3/2.0 | 1,453 (+3%) | 2mo | $265,000 | $182 | 77 |
| 772 Oakwood Dr | 0.21mi | 3/1.5 | 1,312 (-7%) | 4mo | $160,000 | $122 | 74 |
| 2805 Live Oak Dr | 0.35mi | 2/2.0 (-1) | 1,363 (-3%) | 1mo | $244,600 | $179 | 72 |
| 728 Goodson Dr | 0.33mi | 3/2.0 | 1,305 (-7%) | 1mo | $220,000 | $169 | 71 |
| 2446 Ave Mont Martre Ave | 0.67mi | 3/2.0 | 1,415 (+0%) | 2mo | $290,000 | $205 | 67 |
| 2341 N Village Ct | 0.33mi | 2/2.5 (-1) | 1,313 (-7%) | 3mo | $254,000 | $193 | 63 |
| 2336 Carol Sue Ave | 0.50mi | 4/2.0 (+1) | 1,551 (+10%) | 1mo | $135,000 | $87 | 54 |
| 2424 Park Place Dr | 0.63mi | 3/2.0 | 1,550 (+10%) | 2mo | $163,000 | $105 | 53 |
| 2133 Esplanade Pl | 0.73mi | 4/2.0 (+1) | 1,318 (-6%) | 1mo | $170,000 | $129 | 50 |
Match score weights: distance 35% · size 25% · config 20% · recency 20%. Top-matched comps best support the ARV.
Projected returns pro-forma
-3.0% appreciation · 0.0% rent growth · sell at horizon
- IRR
- -1.6%
- Equity multiple
- 0.94×
- Total profit
- $-2,422
- Equity at exit
- $21,620
- IRR
- 4.6%
- Equity multiple
- 1.30×
- Total profit
- $12,000
- Equity at exit
- $12,537
Cash invested: $40,600 (down + closing). Projections, not guarantees.
Landlord ↔ Tenant lean methodology
- Overall (STATE)
- 90 Strongly Landlord-Friendly
- State Louisiana
- 90 Strongly Landlord-Friendly · R+12
- County
- — inherits STATE
- City
- — inherits STATE
ZIP-level market 70056
- Rents YoY
- -0.2%
- Active inventory
- 163
- Price-to-rent
- 7.0×
Monthly cashflow live
- Estimated rent
- $1,723 high interval (Pro) →
- Mortgage (P&I)
- −$760
- Tax from tax record
- −$64 /mo · $762/yr
- Insurance
- −$60
- Flood insurance flood zone
- −$66 /mo · $798/yr
- HOA
- −$0
- Vacancy / Maint / Mgmt
- −$362
- Net cashflow
- $410
Break-even live
UW: 25.0% down · 7.5% · 30yr · 1.5% tax · 5.0% vac · 8.0% maint · 8.0% mgmt
Financing live
Cash to close
- Down payment
- $36,250
- Closing costs
- $4,350
- Reserves months
- —
- Total cash needed
- —
Loan-product check · same deal, 3 products live
Conventional
25% down · 7.5% · 30yr
- Down + closing
- —
- Monthly P&I
- —
- Monthly cashflow
- —
- DSCR
- —
- Eligible?
- —
Personal DTI + credit; lowest rate.
DSCR
20% down · 8.5% · 30yr
- Down + closing
- —
- Monthly P&I
- —
- Monthly cashflow
- —
- DSCR
- —
- Eligible?
- —
No personal income docs; deal must DSCR.
Hard money
10% down · 12.0% · 12mo
- Down + closing
- —
- Monthly P&I
- —
- Monthly cashflow
- —
- DSCR
- —
- Eligible?
- —
Short-term bridge; refi at stabilization.
Rent comps 39 comps
| Address | Beds | Baths | Sqft | Rent | $/sqft | DOM | Units | Dist |
|---|---|---|---|---|---|---|---|---|
| 740 Oakwood Dr Gretna, LA | 4.0 | 2.0 | 1290 | $2,200 | $1.71 | 43d | 1 | 0.30mi |
| 2350 Park Place Dr Gretna, LA | 1.0–3.0 | 1.0–2.0 | 1000 | $1,525 | $1.52 | 43d | 5 | 0.33mi |
| 917 Monterey Ct S Unit b Gretna, LA | 3.0 | 2.0 | 1500 | $1,500 | $1.00 | 43d | 1 | 0.36mi |
| 916 E Monterey Ct Unit A Terrytown, LA | 3.0 | 2.0 | 1400 | $1,600 | $1.14 | 43d | 1 | 0.37mi |
| 937 E Monterey Ct Apt D Terrytown, LA | 4.0 | 2.0 | 1500 | $1,500 | $1.00 | 23d | 1 | 0.42mi |
| 937 E Monterey Ct Apt B Terrytown, LA | 3.0 | 2.0 | 1500 | $1,300 | $0.87 | 23d | 1 | 0.42mi |
| 2425 Oxford Pl #114 Gretna, LA | 2.0 | 1.0 | 917 | $1,350 | $1.47 | 23d | 1 | 0.52mi |
| 2425 Oxford Pl #113 Gretna, LA | 2.0 | 2.0 | 1081 | $2,300 | $2.13 | 43d | 1 | 0.52mi |
| 2425 Oxford Pl #132 Gretna, LA | 2.0 | 1.0 | 1008 | $1,500 | $1.49 | 43d | 1 | 0.52mi |
| 805 Terry Pkwy Terrytown, LA | 3.0 | 2.0 | 1782 | $2,050 | $1.15 | 2d | 1 | 0.52mi |
| 805 Terry Pkwy Terrytown, LA | 3.0 | 2.0 | 1782 | $2,050 | $1.15 | 4d | 1 | 0.52mi |
| 2337 Park Place Dr Gretna, LA | 3.0 | 2.5 | 1800 | $1,650 | $0.92 | 43d | 1 | 0.54mi |
| 701 Fairfax Dr #199 Gretna, LA | 2.0 | 2.0 | 1060 | $1,500 | $1.42 | 43d | 1 | 0.61mi |
| 2424 Park Place Dr Gretna, LA | 3.0 | 2.0 | 1550 | $2,200 | $1.42 | 21d | 1 | 0.61mi |
| 2111 Emerson St Terrytown, LA | 3.0 | 2.5 | 1500 | $1,650 | $1.10 | 43d | 1 | 0.64mi |
| 2448 Oxford Pl Gretna, LA | 3.0 | 2.5 | 1514 | $1,600 | $1.06 | 23d | 1 | 0.67mi |
| 653 Farmington Pl Unit B Terrytown, LA | 2.0 | 1.5 | 975 | $1,250 | $1.28 | 23d | 1 | 0.81mi |
| 500 Behrman Hwy Gretna, LA | 3.0 | 1.5 | 1600 | $1,750 | $1.09 | 4d | 1 | 0.81mi |
| 583 Delmar St Terrytown, LA | 3.0 | 1.5 | 1426 | $1,350 | $0.95 | 43d | 1 | 0.87mi |
| 1932 Faith Pl Unit B Terrytown, LA | 2.0 | 1.5 | 940 | $1,200 | $1.28 | 43d | 1 | 0.87mi |
| 502 Behrman Hwy Gretna, LA | 4.0 | 2.0 | 1600 | $1,750 | $1.09 | 4d | 1 | 0.89mi |
| 1912 Concord Rd Gretna, LA | 3.0 | 2.0 | 1535 | $2,000 | $1.30 | 23d | 1 | 1.02mi |
| 1784 Carol Sue Ave Gretna, LA | 1.0–3.0 | 1.0–1.5 | 850 | $1,035 | $1.22 | 43d | 1 | 1.07mi |
| 2124 DuPont Dr Terrytown, LA | 3.0 | 1.0 | 1127 | $1,800 | $1.60 | 14d | 1 | 1.08mi |
| 517 Diplomat St Terrytown, LA | 3.0 | 2.0 | 1850 | $2,000 | $1.08 | 4d | 1 | 1.09mi |
| 2100 Stumpf Blvd Terrytown, LA | 3.0 | 1.0 | 1100 | $1,800 | $1.64 | 4d | 1 | 1.10mi |
| 1906 Cooper Rd Gretna, LA | 3.0 | 2.0 | 1200 | $1,600 | $1.33 | 4d | 1 | 1.17mi |
| 119 Planters Canal Rd Belle Chasse, LA | 4.0 | 3.0 | 1840 | $2,195 | $1.19 | 23d | 1 | 1.27mi |
| 119 Planters Canal Rd Belle Chasse, LA | 4.0 | 3.0 | 1840 | $2,195 | $1.19 | 43d | 1 | 1.27mi |
| 429 E Butterfly Cir Terrytown, LA | 3.0 | 1.5 | 1300 | $1,650 | $1.27 | 23d | 1 | 1.29mi |
| 429 E Butterfly Cir Terrytown, LA | 3.0 | 1.5 | 1300 | $1,950 | $1.50 | 21d | 1 | 1.29mi |
| 423 E Butterfly Cir Terrytown, LA | 3.0 | 1.5 | 1189 | $1,500 | $1.26 | 23d | 1 | 1.32mi |
| 520 Wall Blvd Gretna, LA | 1.0–3.0 | 1.0–2.0 | 1000 | $1,545 | $1.54 | 43d | 9 | 1.40mi |
| 5200 Timber Crest Dr New Orleans, LA | 4.0 | 2.0 | 1530 | $1,800 | $1.18 | 23d | 1 | 1.40mi |
| 119 Jay St Belle Chasse, LA | 2.0 | 2.0 | 1200 | $900 | $0.75 | 14d | 1 | 1.40mi |
| 528 Grovewood Dr Gretna, LA | 4.0 | 2.0 | 1525 | $2,200 | $1.44 | 23d | 1 | 1.41mi |
| 1810 Stumpf Blvd Gretna, LA | 3.0 | 1.0 | 1000 | $1,650 | $1.65 | 43d | 1 | 1.46mi |
| 349 Cherry Blossom Ln Terrytown, LA | 3.0 | 1.5 | 1225 | $1,600 | $1.31 | 23d | 1 | 1.47mi |
| 3653 Timber Bluff Ln New Orleans, LA | 4.0 | 2.0 | 1800 | $2,500 | $1.39 | 43d | 1 | 1.49mi |
Listing history 4 events
-
2026-06-13remarks 674-char remark
-
2026-06-13statusdays on market $145,000 Pending 3 DOM
-
2026-06-10remarks 673-char remark
-
2026-06-10$145,000 Active 1 DOM
ⓘ Source: listings_history table (triggers on properties + properties_extension) + one-shot
backfill from property_details.listing_events for pre-trigger history.
Tax reassessment forecast LA · Resets to sale price
- Current annual tax
- $762 · $64/mo
- Projected year-2 tax
- $798 · $66/mo
- Expected delta
- +$35/yr (+$3/mo · 4.6%)
ⓘ Screening estimate from a state-policy table — verify with the county assessor before closing.
Climate risk First Street
- Flood 8/10 Severe FEMA zone X · 60% chance over 30 yrs
- Wildfire 1/10 Low
- Heat 10/10 Extreme 7 d/yr ≥108°F today · 21 d/yr by 30 yrs out
- Wind 10/10 Extreme 99% chance of damaging wind over 30 yrs
- Air quality 2/10 Low 2 unhealthy d/yr today · 2 by 30 yrs out
Nearby sold comps map
Loading sold comps map…
Walkable amenities ~0.75 mi
Loading nearby amenities…
Taxation est. · year 1
- Rental income
- $20,674
- − Mortgage interest
- −$8,122
- − Property taxes
- −$762
- − Insurance
- −$1,522
- − Repairs & maintenance
- −$1,654
- − Management
- −$1,654
- − Depreciation
- −$4,218
- Taxable income
- $2,741
- Est. tax owed @ 24.0%
- −$658
- After-tax cash flow
- $4,265/yr
For passive investors: Depreciation is non-cash, so a rental often shows a tax loss while cash-flowing — sheltering income. Rental losses are passive: they offset passive income freely, and up to $25,000/yr can offset ordinary (W-2) income if you actively participate and your MAGI is under $100k (phasing out to $0 by $150k); unused losses carry forward. On sale, claimed depreciation is recaptured at up to 25%, and gains may owe capital-gains tax (a 1031 exchange can defer both). Figures are a year-1 estimate at your 24.0% rate — not tax advice; consult a CPA.
Schools (NCES district)
- District
- Jefferson Parish
- NCES district ID
- 2200840
- Math proficiency
- 24% ▼ -36.00%
- Reading proficiency
- 34% ▼ -30.00%
- Median HH income
- $48,421
- Composite
- 25.19/100
- National rank
- #7511
- State rank
- #44 of 98 in LA
Livability — Terrytown
- Score
- 69/100
- State rank
- #73
- US rank
- #8731
Category grades
Schools grade is shown separately in the Schools card above.
Census & demographics
- Census place
- Terrytown, LA
- County
- Jefferson Parish · 426,999 people
- City population
- 42,471
- Metro
- New Orleans-Metairie, LA
- Population (ZIP)
- 40,348
- Household income
- $59,027
- Rent vs Own
- Severe rent burden
- 1623.0
Population outlook (Jefferson County) Hauer SSP2
- Today (2025)
- 451,696 people
- By 2030
- 455,451 · +0.8%
- By 2040
- 458,308 · +1.5%
- By 2050
- 461,031 · +2.1%
- By 2075
- 476,351 · +5.5%
- By 2100
- 499,377 · +10.6%
Race, ethnicity, and origin ACS 2023
- Neighborhood character
- Highly diverse neighborhood (Simpson 0.71)
- Race & ethnicity
- Black 34% White 32% Hispanic / Latino 26% Two or more races 9% Asian 4%
- Hispanic origin (detail)
- Mexican 3% Dominican 3%
- Common ancestry
- Lithuanian 5% Italian 2% Hispanic 2%
- Foreign-born
- 20% · Canada, Vietnam
- Languages at home
- 67% English-only · Spanish 22% Arabic 5% French/Haitian/Cajun 2%
Political lean MEDSL · Jefferson
- 2024 margin
- R (+12.9) · D 42.5% · R 55.5% · Other 2.1%
- 2008→2024 swing
- +13.6pp toward D · 2008: -26.6pp · 2024: -12.9pp
- All cycles
- 2024: R+12.9 2020: R+11.1 2016: R+14.8 2012: R+18.4 2008: R+26.6
Not yet ingested
- Civics
- —
Market trends
- HPI YoY
- ▼ -100.20%
- Current HPI
- 165.1579
- Rent YoY
- ▼ -0.16%
- Metro
- New Orleans-Metairie, LA
- State GDP YoY
- ▲ 3.29%
- F500 in state
- 10
Industry mix (Fortune 500 HQ in LA)
| Industry | F500 HQs | Revenue |
|---|---|---|
| Telecommunications | 2 | $23B |
|
||
| Utilities | 1 | $12B |
|
||
| Wholesale / Distribution | 1 | $5B |
|
||
| Advertising | 1 | $2B |
|
||
Price history
-21.6% since first listed3 events — show timeline
- 2026-06-09 Listed $145,000 GSREIN
- 2025-05-22 Listed $185,000 AcadianaMLS
- 1978-10-01 Sold (Public Records) — Public Records
Property tax history
+2.0%/yrLatest (2025): $762 · +0.3% YoY. Source: county tax records.
Cash-flow waterfall
monthlySold comps — $/sqft
last 12 mo · ≤1 miLoading sold comps…