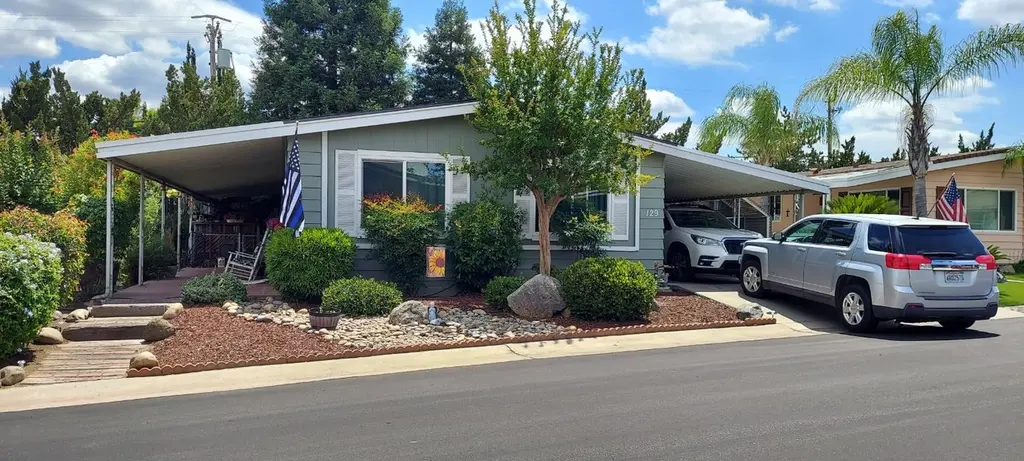
1300 W Olson Ave #129 · Reedley, CA
Flood risk 1/10 · Minimal
- FEMA flood zone
- X (unshaded)
- Chance of flooding over 30 yrs
- 0.0%
- Est. flood insurance / yr
- $507 – $1,088
Fire risk 8/10 · Major
- Est. fire insurance / yr
- $659 – $1,223
Heat risk 8/10 · Major
- Hot days now (above 106°F)
- 7 days/yr
- Hot days in 30 yrs
- 17 days/yr
Wind risk 1/10 · Minimal
- Chance of severe wind over 30 yrs
- —
Air-quality risk 10/10 · Severe
- Unhealthy air days now
- 48 days/yr
- Unhealthy air days in 30 yrs
- 53 days/yr
Risk factors via First Street. Map © Google.
Why this score? — see what drove the B- grade
The composite is a weighted blend of 9 inputs, each scored 0–100. Each bar is that input's sub-score; the figure is the points it added to the 100-point composite (weight × sub-score).
- Cash flow +30.0/30.0
- DSCR +10.0/10.0
- 1% rule +9.7/10.0
- ARV discount +7.5/15.0
- Livability +3.1/5.0
- Schools +2.9/10.0
- Rent growth +2.5/5.0
- Condition / age +2.5/5.0
- Appreciation +0.0/10.0
$125,000
🖨 Deal sheet 📄 Offer letter ✓ Due diligence
Listing remarks MLS
Welcome to this light and airy mobile home in Reedley's beautiful senior park. This park is gated and also provides a community swimming pool and clubhouse. This home has a beautiful open floor plan with both living and dining room plus family room. New Attractive plank flooring In living areas, kitchen and baths. Keep your feet warm on the carpet in both bedrooms. Newer gas cooktop plus double oven in kitchen, with extra room for dinette table or coffee bar. Home also has indoor laundry room with stackable washer and dryer. The exterior has a front covered patio as well as new patio decking off master. A Pet door leads to a deck with a chain link fence for your pets safety. There is covered parking plus extra storage on side. Call soon for a private showing.
Key facts
- Gated community
- Covered car port
- Covered patio
Tags
Property features AI
Finance
- HOA & community: Association fees billed monthly
Exterior
- Parking: Carport
- Utilities: Electric service on; Public sewer; Public utilities
- Home design: Mobile home (Fleetwood); Park space rented
- Construction: Wood siding and metal siding; Wood subfloor foundation; Composition roof
- Exterior features: One level; Covered concrete patio and deck; Shed(s); Front and rear sprinklers; Urban lot setting; Private in-ground gunite pool (fenced, community access)
Interior
- Kitchen: Built-in range/oven; Dishwasher; Disposal; Microwave
- Flooring: Laminate flooring
- Bathrooms: 2 bathrooms
- Heating & cooling: Central heating and cooling
- Interior features: Built-in range/oven, gas appliances, disposal, dishwasher, microwave; Double-pane windows
- Laundry & utility: Utility room
Neighborhood map
What this means for you Summary
Snapshot
- This is a 2-bed/2.0-bath manufactured listed at $125k.
Deal economics
- At list price, monthly cash flow is $592 ($7k/yr) — positive.
- The deal already cash-flows at list — no discount required.
- Meets the 1% rule at list price ($2k rent vs $125k).
- Cap rate 12.0% vs local median 3.8% in Reedley — top-decile yield for the area; either an underpriced asset or a hidden risk that comps aren't pricing in. Stress-test before assuming the spread holds.
Location & tenants
- Location reads 62/100 on livability (#486 in CA) — a middle-class / working-renter tenant base. Strengths: housing A; Watch: commute D+, crime D, health & safety D.
- Kings Canyon Joint Unified (town): math 26% / reading 43% proficiency, ranked #288 of 517 in CA (top 56%) — families likely to look elsewhere, expect single-tenant / working-renter base with shorter leases; 73% free/reduced lunch — lower-income household profile, screen leases tightly.
- Zoned schools: Riverview Elementary (math 45% / reading 57%, grade C-, #379 of 1,571 statewide, top 24%, 437 students, 68% FRL); Reedley High (math 31% / reading 69%, grade D+, #331 of 1,170 statewide, top 28%, 1,848 students, 82% FRL) — zoned schools at 75% FRL track the district average.
- Zoned-school proficiency averages 50% at this address vs 34% district-wide (+16 pts) — the actual schools serving this property are materially stronger than the Kings Canyon Joint Unified average implies; a family-tenant draw the district grade alone would hide.
- Market conditions: 51 active listings in the ZIP; 3 comparable units currently listed for rent nearby; rentals leasing fast (median 2d on market — plan ~1-2 weeks tenant-placement turnaround); 2,426 units permitted in Fresno County in 2024 (296 in 5+ unit buildings).
Forward outlook
- Local home prices are declining (-3.0%/yr); year-one equity from $864 of loan paydown is wiped out by about $4k of value loss. Plan a longer hold.
- Fresno County population projected at +11% by 2050 — modest demand growth; plan on rents tracking national, not racing it.
- At projected returns (-3.0% appreciation + 3.0% rent growth), your $35k cash investment doubles in ~6 years — after that, you're playing with house money.
Negotiation context
- Only 11 days on market — expect competitive offers; lowballing is unlikely to land.
- 7 sale attempts since 15y ago with the ask held roughly flat each time — persistent listings suggest the price (not the market) is what's stuck; bring a comps-based counter.
- Current owner paid $90k; 39% above their basis — modest negotiation headroom, anchor on the comps not their cost.
Risks & watch-outs
- Climate carrying-cost: severe wildfire risk; extreme-heat days projected 7→17/yr by 2055 (HVAC capex compounding) — expect insurance premiums to compound above CPI over the hold.
Questions for the listing agent
- Built in 1979 — when were the roof, HVAC, electrical panel, plumbing, and water heater last replaced?
- Is there a deadline driving the sale (1031 exchange, divorce, estate, relocation)? That informs how much negotiation room exists.
- Crime grade is D in this area — have there been break-ins, vandalism, or insurance claims at this property in the last 3 years? What carrier currently insures it and at what premium?
- What's the average days-on-market for RENTAL listings here right now (not sales)? A rising rental-DOM trend means longer vacancies and softer asking-rent achievability than the comps imply.
- What's the recent tenant-quality profile in this submarket — average credit score on applications, eviction rate, late-payment / NSF rate, and stable-employment percentage? A property-management company in the area should have these aggregated.
- How much new for-sale + rental construction is in the pipeline within 1–3 miles? Heavy new supply typically softens prices + rents 12–24 months out; constrained supply supports both.
Investment metrics
- 1% rule
- 1.47% ✓
- Cap rate
- 11.97%
- Cash-on-cash
- 20.29%
- DSCR
- 1.90
- GRM
- 5.7
CMA / ARV
- ARV (on-the-fly)
- $65,856
- Comps found
- 12
Show comp detail 12 sales within ~0.75 mi
| Address | Dist | Beds/Ba | Sqft | Sold | Price | $/sf | Match |
|---|---|---|---|---|---|---|---|
| 1300 W Olson Ave #127 | 0.00mi | 2/2.0 | 1,440 (+7%) | 0mo | $66,000 | $46 | 88 |
| 1300 W Olson Ave Unit SP 82 | 0.00mi | 2/2.0 | 1,384 (+3%) | 10mo | $120,000 | $87 | 87 |
| 1300 W Olson Ave #52 | 0.10mi | 2/2.0 | 1,440 (+7%) | 4mo | $70,000 | $49 | 80 |
| 1300 W Olson Ave #73 | 0.10mi | 2/2.0 | 1,440 (+7%) | 6mo | $82,500 | $57 | 78 |
| 1300 W Olson Ave #158 | 0.10mi | 2/2.0 | 1,440 (+7%) | 6mo | $69,000 | $48 | 78 |
| 1300 W Olson Ave #29 | 0.10mi | 2/2.0 | 1,440 (+7%) | 8mo | $57,000 | $40 | 77 |
| 1300 W Olson Ave #113 | 0.00mi | 2/2.0 | 1,248 (-7%) | 17mo | $125,000 | $100 | 74 |
| 1300 W Olson Ave #89 | 0.00mi | 3/2.0 (+1) | 1,440 (+7%) | 11mo | $60,000 | $42 | 74 |
| 1300 W Olson Ave #97 | 0.00mi | 2/2.0 | 1,152 (-14%) | 4mo | $70,000 | $61 | 73 |
| 1300 W Olson Ave #75 | 0.10mi | 3/2.0 (+1) | 1,440 (+7%) | 7mo | $40,000 | $28 | 73 |
| 1300 W Olson Ave #75 | 0.10mi | 3/2.0 (+1) | 1,440 (+7%) | 7mo | $40,000 | $28 | 73 |
| 1300 W Olson Ave #131 | 0.10mi | 3/2.0 (+1) | 1,152 (-14%) | 3mo | $60,000 | $52 | 64 |
Match score weights: distance 35% · size 25% · config 20% · recency 20%. Top-matched comps best support the ARV.
Projected returns pro-forma
-3.0% appreciation · 3.0% rent growth · sell at horizon
- IRR
- 12.5%
- Equity multiple
- 1.50×
- Total profit
- $17,458
- Equity at exit
- $18,638
- IRR
- 21.5%
- Equity multiple
- 2.82×
- Total profit
- $63,842
- Equity at exit
- $10,808
Cash invested: $35,000 (down + closing). Projections, not guarantees.
Landlord ↔ Tenant lean methodology
- Overall (STATE)
- 18 Strongly Tenant-Friendly
- State California
- 18 Strongly Tenant-Friendly · D+13
- County
- — inherits STATE
- City
- — inherits STATE
ZIP-level market 93654
- Active inventory
- 51
- Price-to-rent
- 5.7×
Monthly cashflow live
- Estimated rent
- $1,842 medium interval (Pro) →
- Mortgage (P&I)
- −$656
- Tax est. 1.5%
- −$156 /mo · $1,875/yr
- Insurance
- −$52
- HOA
- −$0
- Vacancy / Maint / Mgmt
- −$387
- Net cashflow
- $592
Break-even live
UW: 25.0% down · 7.5% · 30yr · 1.5% tax · 5.0% vac · 8.0% maint · 8.0% mgmt
Financing live
Cash to close
- Down payment
- $31,250
- Closing costs
- $3,750
- Reserves months
- —
- Total cash needed
- —
Loan-product check · same deal, 3 products live
Conventional
25% down · 7.5% · 30yr
- Down + closing
- —
- Monthly P&I
- —
- Monthly cashflow
- —
- DSCR
- —
- Eligible?
- —
Personal DTI + credit; lowest rate.
DSCR
20% down · 8.5% · 30yr
- Down + closing
- —
- Monthly P&I
- —
- Monthly cashflow
- —
- DSCR
- —
- Eligible?
- —
No personal income docs; deal must DSCR.
Hard money
10% down · 12.0% · 12mo
- Down + closing
- —
- Monthly P&I
- —
- Monthly cashflow
- —
- DSCR
- —
- Eligible?
- —
Short-term bridge; refi at stabilization.
Rent comps 3 comps
| Address | Beds | Baths | Sqft | Rent | $/sqft | DOM | Units | Dist |
|---|---|---|---|---|---|---|---|---|
| 1260 S Klein Ave Reedley, CA | 3.0 | 1.5 | 1220 | $1,995 | $1.64 | 1d | 1 | 0.49mi |
| 2111 S Church Ave Reedley, CA | 2.0 | 2.0 | 1749 | $1,750 | $1.00 | 10d | 1 | 0.68mi |
| 1407 E St Reedley, CA | 2.0 | 1.0 | 912 | $1,550 | $1.70 | 1d | 1 | 1.13mi |
Listing history 10 events
-
2026-06-18days on market $125,000 Active 11 DOM
-
2026-06-17days on market $125,000 Active 10 DOM
-
2026-06-16days on market $125,000 Active 9 DOM
-
2026-06-15days on market $125,000 Active 8 DOM
-
2026-06-13days on market $125,000 Active 6 DOM
-
2026-06-13days on market $125,000 Active 5 DOM
-
2026-06-10days on market $125,000 Active 3 DOM
-
2026-06-09days on market $125,000 Active 2 DOM
-
2026-06-08remarks 652-char remark
-
2026-06-08$125,000 Active 1 DOM
ⓘ Source: listings_history table (triggers on properties + properties_extension) + one-shot
backfill from property_details.listing_events for pre-trigger history.
Climate risk First Street
- Flood 1/10 Low FEMA zone X (unshaded) · 0% chance over 30 yrs
- Wildfire 8/10 Severe
- Heat 8/10 Severe 7 d/yr ≥106°F today · 17 d/yr by 30 yrs out
- Wind 1/10 Low
- Air quality 10/10 Extreme 48 unhealthy d/yr today · 53 by 30 yrs out
Nearby sold comps map
Loading sold comps map…
Walkable amenities ~0.75 mi
Loading nearby amenities…
Taxation est. · year 1
- Rental income
- $22,110
- − Mortgage interest
- −$7,002
- − Property taxes
- −$1,875
- − Insurance
- −$625
- − Repairs & maintenance
- −$1,769
- − Management
- −$1,769
- − Depreciation
- −$3,636
- Taxable income
- $5,434
- Est. tax owed @ 24.0%
- −$1,304
- After-tax cash flow
- $5,796/yr
For passive investors: Depreciation is non-cash, so a rental often shows a tax loss while cash-flowing — sheltering income. Rental losses are passive: they offset passive income freely, and up to $25,000/yr can offset ordinary (W-2) income if you actively participate and your MAGI is under $100k (phasing out to $0 by $150k); unused losses carry forward. On sale, claimed depreciation is recaptured at up to 25%, and gains may owe capital-gains tax (a 1031 exchange can defer both). Figures are a year-1 estimate at your 24.0% rate — not tax advice; consult a CPA.
Schools (NCES district)
- District
- Kings Canyon Joint Unified
- NCES district ID
- 0619700
- Math proficiency
- 26% ▼ -14.00%
- Reading proficiency
- 43% ▼ -9.00%
- Median HH income
- $42,406
- Composite
- 29.14/100
- National rank
- #6582
- State rank
- #288 of 517 in CA
Livability — Reedley
- Score
- 62/100
- State rank
- #486
- US rank
- #16474
Category grades
Schools grade is shown separately in the Schools card above.
Census & demographics
- Census place
- Reedley, CA
- Population (ZIP)
- 31,905
Population outlook (Fresno County) Hauer SSP2
- Today (2025)
- 1,042,971 people
- By 2030
- 1,072,198 · +2.8%
- By 2040
- 1,122,408 · +7.6%
- By 2050
- 1,157,251 · +11.0%
- By 2075
- 1,182,575 · +13.4%
- By 2100
- 1,105,899 · +6.0%
Race, ethnicity, and origin ACS 2023
- Neighborhood character
- Predominantly Hispanic (75%)
- Race & ethnicity
- Hispanic / Latino 75% White 19% Two or more races 18% Asian 2% Black 2%
- Hispanic origin (detail)
- Mexican 72%
- Common ancestry
- Iranian 1% Russian 1% Portuguese 1%
- Foreign-born
- 27% · Canada, China
- Languages at home
- 42% English-only · Spanish 55% Arabic 2% Tagalog/Filipino 1%
Political lean MEDSL · Fresno
- 2024 margin
- Toss-up / Even · D 46.5% · R 50.9% · Other 2.6%
- 2008→2024 swing
- -6.5pp toward R · 2008: 2.1pp · 2024: -4.4pp
- All cycles
- 2024: R+4.4 2020: D+7.8 2016: D+3.9 2012: R+2.9 2008: D+2.1
Not yet ingested
- Civics
- —
Market trends
- HPI YoY
- ▼ -343.56%
- Current HPI
- 322.9544
- Rent YoY
- —
- Metro
- —
- State GDP YoY
- ▲ 3.21%
- F500 in state
- 116
Industry mix (Fortune 500 HQ in CA)
| Industry | F500 HQs | Revenue |
|---|---|---|
| Technology | 27 | $1,492B |
|
||
| Financial Services | 3 | $174B |
|
||
| Retail | 3 | $44B |
|
||
| Insurance | 3 | $26B |
|
||
| Media / Entertainment | 2 | $115B |
|
||
| Pharmaceuticals / Biotech | 2 | $62B |
|
||
Price history
+525.0% since first listed19 events — show timeline
- 2026-06-07 Listed $125,000 FRESNOMLS
- 2024-09-27 Sold (MLS) $90,000 TCMLS
- 2024-09-27 Sold (MLS) $90,000 FRESNOMLS
- 2024-05-31 Pending — TCMLS
- 2024-05-21 Pending — FRESNOMLS
- 2024-05-10 Listed $95,000 TCMLS
- 2024-05-10 Listed $95,000 FRESNOMLS
- 2021-06-11 Sold (MLS) $60,000 TCMLS
- 2021-06-11 Sold (MLS) $60,000 FRESNOMLS
- 2021-05-26 Pending — FRESNOMLS
- 2021-05-20 Relisted — FRESNOMLS
- 2021-05-10 Pending — FRESNOMLS
- 2021-05-01 Relisted — FRESNOMLS
- 2021-04-19 Pending — FRESNOMLS
- 2021-04-09 Listed $60,000 FRESNOMLS
- 2012-02-02 Sold (MLS) $20,000 FRESNOMLS
- 2012-01-26 Price Changed $23,000 FRESNOMLS
- 2012-01-26 Delisted — FRESNOMLS
- 2011-12-09 Listed $20,000 FRESNOMLS
Cash-flow waterfall
monthlySold comps — $/sqft
last 12 mo · ≤1 miLoading sold comps…