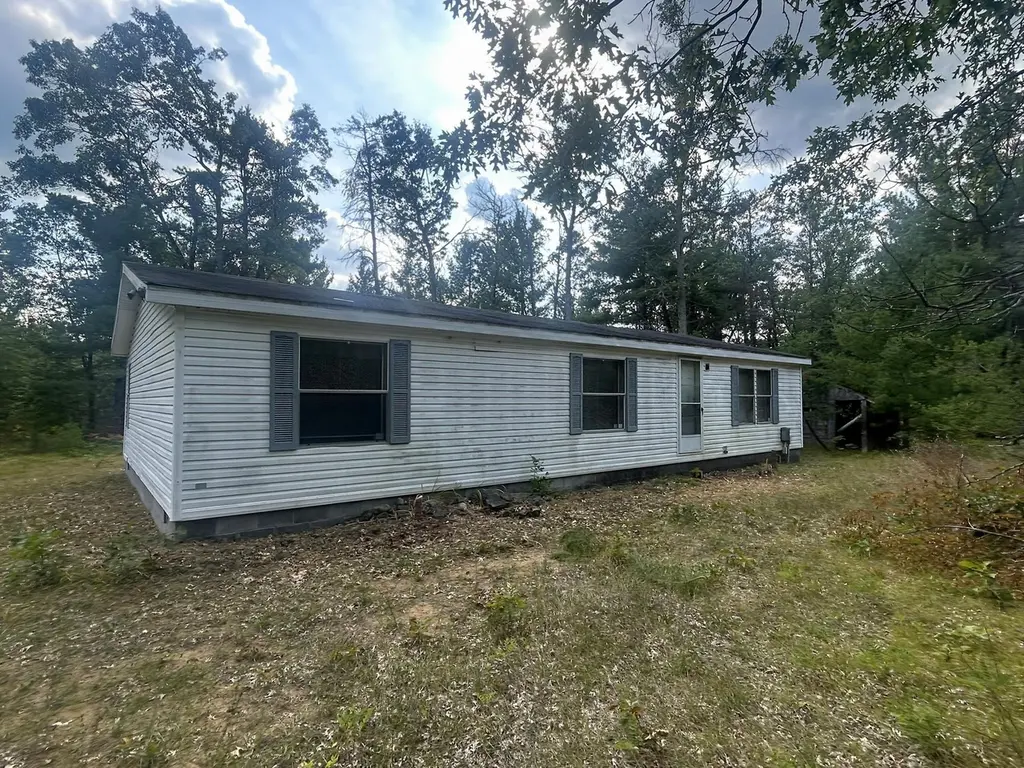
21331 Red Oak Trl · Hillman, MI
Flood risk 1/10 · Minimal
- FEMA flood zone
- —
- Chance of flooding over 30 yrs
- 0.0%
- Est. flood insurance / yr
- —
Fire risk 5/10 · Moderate
- Est. fire insurance / yr
- $784 – $1,456
Heat risk 1/10 · Minimal
- Hot days now (above 94°F)
- 7 days/yr
- Hot days in 30 yrs
- 13 days/yr
Wind risk 1/10 · Minimal
- Chance of severe wind over 30 yrs
- —
Air-quality risk 1/10 · Minimal
- Unhealthy air days now
- 0 days/yr
- Unhealthy air days in 30 yrs
- 0 days/yr
Risk factors via First Street. Map © Google.
Why this score? — see what drove the C grade
The composite is a weighted blend of 9 inputs, each scored 0–100. Each bar is that input's sub-score; the figure is the points it added to the 100-point composite (weight × sub-score).
- Cash flow +24.0/30.0
- Appreciation +10.0/10.0
- DSCR +7.7/10.0
- 1% rule +5.4/10.0
- Livability +3.1/5.0
- Schools +2.6/10.0
- Rent growth +2.5/5.0
- Condition / age +2.5/5.0
- ARV discount +0.0/15.0
$110,000
🖨 Deal sheet (PDF) 📄 Offer letter ✓ Due diligence
Listing remarks
Tucked away on 2 private acres and not visible from the road, this property is the perfect Up North retreat for outdoor enthusiasts! Located approximately 30 minutes from Alpena and 45 minutes from Gaylord, you can enjoy peaceful seclusion while still being within easy driving distance of shopping, restaurants, and conveniences. ATV and snowmobile trail access is right out your front door, and adjacent state land provides thousands of acres for hunting, mushroom picking, hiking, wildlife watching, and endless outdoor recreation. 1995 manufactured home offers 3 beds, 1 bath, with spacious bedrooms, large closets, making it an easy getaway or hunting camp setup. The home has seen very little
Key facts
- Private acres
- Adjacent state land
- Hunting
Tags
Property features AI
Exterior
- Utilities: Well water; Septic tank
- Home design: Single-family residence; Residential property
- Exterior features: Property currently used for hunting; Natural vegetation; Dirt road frontage; Private maintained road access; Private road frontage; 2-acre lot
Interior
- Bathrooms: 1 full bathroom
- Heating & cooling: Forced air heating; Propane fuel
- Interior features: Crawl space or no finished basement
- Laundry & utility: Main-level laundry
Neighborhood map
What this means for you Summary
Snapshot
- This is a 3-bed/1.0-bath single-family listed at $110k.
Deal economics
- At list price, monthly cash flow is $216 ($3k/yr) — positive.
- The deal already cash-flows at list — no discount required.
- Meets the 1% rule at list price ($1k rent vs $110k).
- Recommended offer: $108k (1.5% below list) — sets the bar for market timing.
Location & tenants
- Location reads 61/100 on livability (#575 in MI) — a middle-class / working-renter tenant base. Strengths: cost of living A+, housing A-; Watch: schools F, crime F, amenities F.
- Hillman Community Schools (rural): math 22% / reading 40% proficiency, ranked #361 of 540 in MI (top 67%) — families likely to look elsewhere, expect single-tenant / working-renter base with shorter leases.
- Market conditions: 38 active listings in the ZIP.
Forward outlook
- In year one you build about $12k of equity ($761 loan paydown + $11k appreciation (10.0% local appreciation)).
- Montmorency County population projected at -38% by 2050 — secular population decline; favor cash flow + early exit over multi-decade hold.
- At projected returns (10.0% appreciation + 3.0% rent growth), your $31k cash investment doubles in ~3 years — after that, you're playing with house money.
- By year 4, paydown + projected appreciation supports a ~$42k cash-out refi (75% LTV) — recoverable capital for the next deal without selling this one.
Negotiation context
- It's been on market 26 days — a 2% lower offer ($108k) is reasonable based on typical stale-listing flexibility.
Risks & watch-outs
- Climate carrying-cost: moderate wildfire risk — expect insurance premiums to compound above CPI over the hold.
Questions for the listing agent
- Is there a deadline driving the sale (1031 exchange, divorce, estate, relocation)? That informs how much negotiation room exists.
- Schools are F-rated, which usually means shorter tenancies and higher turnover. Who's the typical renter profile here, and what's been the actual vacancy rate?
- Crime grade is F in this area — have there been break-ins, vandalism, or insurance claims at this property in the last 3 years? What carrier currently insures it and at what premium?
- What's the average days-on-market for RENTAL listings here right now (not sales)? A rising rental-DOM trend means longer vacancies and softer asking-rent achievability than the comps imply.
- What's the recent tenant-quality profile in this submarket — average credit score on applications, eviction rate, late-payment / NSF rate, and stable-employment percentage? A property-management company in the area should have these aggregated.
- How much new for-sale + rental construction is in the pipeline within 1–3 miles? Heavy new supply typically softens prices + rents 12–24 months out; constrained supply supports both.
Investment metrics
- 1% rule
- 1.04% ✓
- Cap rate
- 8.65%
- Cash-on-cash
- 8.42%
- DSCR
- 1.37
- GRM
- 8.0
CMA / ARV
- ARV (on-the-fly)
- $92,352
- Comps found
- 1
Show comp detail 1 sale within ~0.75 mi
| Address | Dist | Beds/Ba | Sqft | Sold | Price | $/sf | Match |
|---|---|---|---|---|---|---|---|
| 15644 Mio Dr | 0.39mi | 3/2.0 | 1,344 (+8%) | 19mo | $100,000 | $74 | 49 |
Match score weights: distance 35% · size 25% · config 20% · recency 20%. Top-matched comps best support the ARV.
Projected returns pro-forma
10.0% appreciation · 3.0% rent growth · sell at horizon
- IRR
- 30.4%
- Equity multiple
- 3.39×
- Total profit
- $73,644
- Equity at exit
- $99,097
- IRR
- 26.3%
- Equity multiple
- 7.69×
- Total profit
- $205,998
- Equity at exit
- $213,706
Cash invested: $30,800 (down + closing). Projections, not guarantees.
Landlord ↔ Tenant lean methodology
- Overall (STATE)
- 62 Landlord-Friendly
- State Michigan
- 62 Landlord-Friendly · EVEN
- County
- — inherits STATE
- City
- — inherits STATE
ZIP-level market 49746
- Home prices YoY
- 5.7%
- Active inventory
- 38
- Price-to-rent
- 8.0×
Monthly cashflow live
- Estimated rent
- $1,149 medium interval (Pro) →
- Mortgage (P&I)
- −$577
- Tax from tax record
- −$69 /mo · $823/yr
- Insurance
- −$46
- HOA
- −$0
- Vacancy / Maint / Mgmt
- −$241
- Net cashflow
- $216
Break-even live
Sensitivity live
| Price | -10% $278 | -5% $247 | +0% $216 | +5% $185 | +10% $154 |
|---|---|---|---|---|---|
| Rent | -10% $125 | -5% $171 | +0% $216 | +5% $261 | +10% $307 |
| Rate | -1.0pp $271 | -0.5pp $244 | base $216 | +0.5pp $188 | +1.0pp $159 |
UW: 25.0% down · 7.5% · 30yr · 1.5% tax · 5.0% vac · 8.0% maint · 8.0% mgmt
Financing live
Cash to close
- Down payment
- $27,500
- Closing costs
- $3,300
- Reserves months
- —
- Total cash needed
- —
Loan-product check · same deal, 3 products live
Conventional
25% down · 7.5% · 30yr
- Down + closing
- —
- Monthly P&I
- —
- Monthly cashflow
- —
- DSCR
- —
- Eligible?
- —
Personal DTI + credit; lowest rate.
DSCR
20% down · 8.5% · 30yr
- Down + closing
- —
- Monthly P&I
- —
- Monthly cashflow
- —
- DSCR
- —
- Eligible?
- —
No personal income docs; deal must DSCR.
Hard money
10% down · 12.0% · 12mo
- Down + closing
- —
- Monthly P&I
- —
- Monthly cashflow
- —
- DSCR
- —
- Eligible?
- —
Short-term bridge; refi at stabilization.
Listing history 18 events
-
2026-06-21days on market $110,000 Active 26 DOM
-
2026-06-21days on market $110,000 Active 25 DOM
-
2026-06-18days on market $110,000 Active 23 DOM
-
2026-06-17days on market $110,000 Active 22 DOM
-
2026-06-16days on market $110,000 Active 21 DOM
-
2026-06-15days on market $110,000 Active 20 DOM
-
2026-06-13days on market $110,000 Active 18 DOM
-
2026-06-12days on market $110,000 Active 17 DOM
-
2026-06-09days on market $110,000 Active 14 DOM
-
2026-06-08days on market $110,000 Active 13 DOM
-
2026-06-07days on market $110,000 Active 12 DOM
-
2026-06-07days on market $110,000 Active 11 DOM
-
2026-06-04days on market $110,000 Active 8 DOM
-
2026-06-02days on market $110,000 Active 7 DOM
-
2026-06-01days on market $110,000 Active 6 DOM
-
2026-05-31days on market $110,000 Active 5 DOM
-
2026-05-31days on market $110,000 Active 4 DOM
-
2026-05-26$110,000 Active
ⓘ Source: listings_history table (triggers on properties + properties_extension) + one-shot
backfill from property_details.listing_events for pre-trigger history.
Tax reassessment forecast MI · Partial reset (capped growth)
- Current annual tax
- $823 · $69/mo
- Projected year-2 tax
- $1,259 · $105/mo
- Expected delta
- +$435/yr (+$36/mo · 52.9%)
ⓘ Screening estimate from a state-policy table — verify with the county assessor before closing.
Climate risk First Street
- Flood 1/10 Low 0% chance over 30 yrs
- Wildfire 5/10 Major
- Heat 1/10 Low 7 d/yr ≥94°F today · 13 d/yr by 30 yrs out
- Wind 1/10 Low
- Air quality 1/10 Low 0 unhealthy d/yr today · 0 by 30 yrs out
Nearby sold comps map
Loading sold comps map…
Walkable amenities ~0.75 mi
Loading nearby amenities…
Taxation est. · year 1
- Rental income
- $13,782
- − Mortgage interest
- −$6,162
- − Property taxes
- −$823
- − Insurance
- −$550
- − Repairs & maintenance
- −$1,103
- − Management
- −$1,103
- − Depreciation
- −$3,200
- Taxable income
- $842
- Est. tax owed @ 24.0%
- −$202
- After-tax cash flow
- $2,390/yr
For passive investors: Depreciation is non-cash, so a rental often shows a tax loss while cash-flowing — sheltering income. Rental losses are passive: they offset passive income freely, and up to $25,000/yr can offset ordinary (W-2) income if you actively participate and your MAGI is under $100k (phasing out to $0 by $150k); unused losses carry forward. On sale, claimed depreciation is recaptured at up to 25%, and gains may owe capital-gains tax (a 1031 exchange can defer both). Figures are a year-1 estimate at your 24.0% rate — not tax advice; consult a CPA.
Schools (NCES district)
- District
- Hillman Community Schools
- NCES district ID
- 2618360
- Math proficiency
- 22% ▬ 0.00%
- Reading proficiency
- 40% ▲ 3.00%
- Median HH income
- $37,668
- Composite
- 25.78/100
- National rank
- #7368
- State rank
- #361 of 540 in MI
Livability — Hillman
- Score
- 61/100
- State rank
- #575
- US rank
- #18368
Category grades
Schools grade is shown separately in the Schools card above.
Census & demographics
- Population (ZIP)
- 3,502
Population outlook (Montmorency County) Hauer SSP2
- Today (2025)
- 8,233 people
- By 2030
- 7,575 · -8.0%
- By 2040
- 6,202 · -24.7%
- By 2050
- 5,081 · -38.3%
- By 2075
- 3,119 · -62.1%
- By 2100
- 1,923 · -76.6%
Race, ethnicity, and origin ACS 2023
- Neighborhood character
- Predominantly White (95%)
- Race & ethnicity
- White 95% Two or more races 3% Hispanic / Latino 1% Native American 1%
- Common ancestry
- Romanian 9% Lithuanian 6% Slovak 2%
- Foreign-born
- 1% · Canada
Political lean MEDSL · Montmorency
- 2024 margin
- Solid R (+45.3) · D 26.6% · R 72.0% · Other 1.4%
- 2008→2024 swing
- -37.2pp toward R · 2008: -8.2pp · 2024: -45.3pp
- All cycles
- 2024: R+45.3 2020: R+43.4 2016: R+44.2 2012: R+17.4 2008: R+8.2
Not yet ingested
- Civics
- —
Market trends
- HPI YoY
- ▲ 11.19%
- Current HPI
- 208.751
- Rent YoY
- —
- Metro
- —
- State GDP YoY
- ▲ 1.37%
- F500 in state
- 28
Industry mix (Fortune 500 HQ in MI)
| Industry | F500 HQs | Revenue |
|---|---|---|
| Automotive Parts | 3 | $48B |
|
||
| Automotive | 2 | $372B |
|
||
| Chemicals | 1 | $45B |
|
||
| Automotive Retail | 1 | $29B |
|
||
| Healthcare / Medical Devices | 1 | $23B |
|
||
| Automotive Technology | 1 | $20B |
|
||
Price history
1 event — show timeline
- 2026-05-26 Listed $110,000 WWMLS
Property tax history
+1.4%/yrLatest (2024): $823 · -20.9% YoY. Source: county tax records.
Cash-flow waterfall
monthlySold comps — $/sqft
last 12 mo · ≤1 miLoading sold comps…