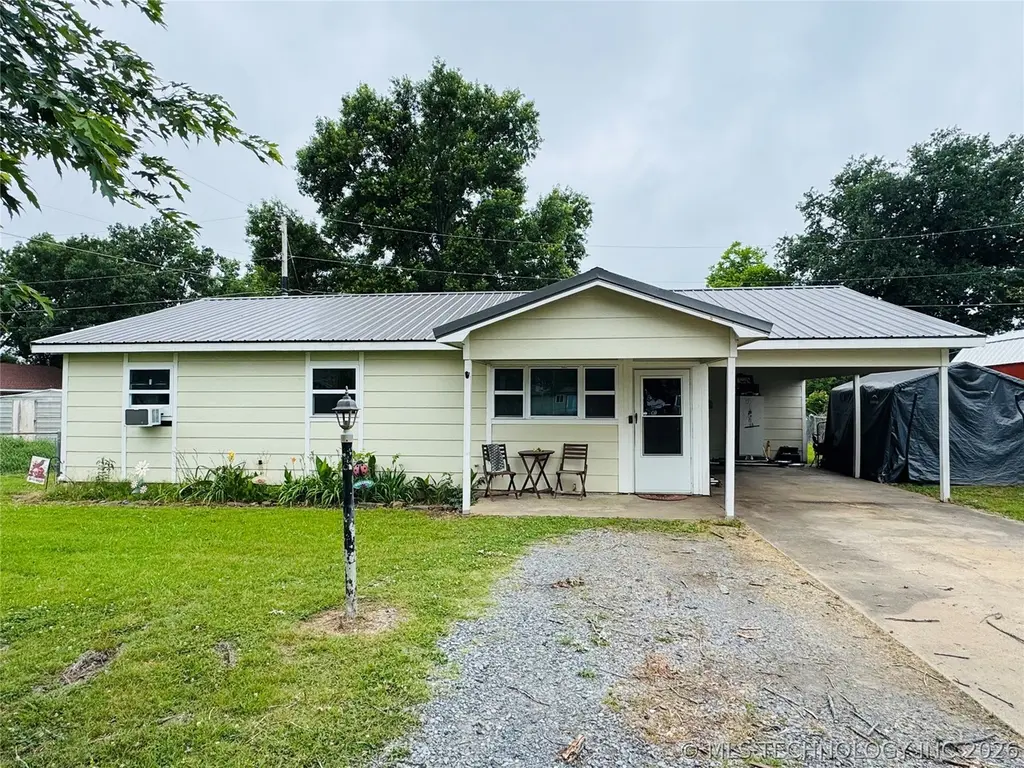
307 NW 6th · Wilburton, OK
Flood risk 1/10 · Minimal
- FEMA flood zone
- X
- Chance of flooding over 30 yrs
- 0.0%
- Est. flood insurance / yr
- $507 – $1,088
Fire risk 7/10 · Major
- Est. fire insurance / yr
- $2,463 – $4,575
Heat risk 6/10 · Moderate
- Hot days now (above 112°F)
- 7 days/yr
- Hot days in 30 yrs
- 20 days/yr
Wind risk 3/10 · Minor
- Chance of severe wind over 30 yrs
- 6.0%
Air-quality risk 2/10 · Minimal
- Unhealthy air days now
- 1 days/yr
- Unhealthy air days in 30 yrs
- 1 days/yr
Risk factors via First Street. Map © Google.
Why this score? — see what drove the D+ grade
The composite is a weighted blend of 9 inputs, each scored 0–100. Each bar is that input's sub-score; the figure is the points it added to the 100-point composite (weight × sub-score).
- Cash flow +19.2/30.0
- DSCR +6.1/10.0
- ARV discount +5.3/15.0
- Appreciation +5.2/10.0
- 1% rule +3.8/10.0
- Livability +3.0/5.0
- Rent growth +2.5/5.0
- Condition / age +2.5/5.0
- Schools +2.0/10.0
$119,000
🖨 Deal sheet 📄 Offer letter ✓ Due diligence
Listing remarks
3 BEDROOM HOUSE WITH A LARGE FENCED YARD!!! This charming 3 bed 1 bath home sits on a large lot with a fenced yard just minutes from the school. Inside you'll find the the home offers a comfortable open space for everyday living. The large laundry room is a nice perk with great storage space! The home also offers an attached carport and a storm cellar. This would be a great first home or income producing property! The home is offered as-is, where-is. Call today for a showing!!
Key facts
- Attached carport
- Large fenced yard
- Large laundry room
Tags
Property features AI
Exterior
- Parking: 1-car garage; Carport
- Security: Storm shelter
- Utilities: Electricity available; Natural gas available; Public water; Public sewer
- Home design: Single-story; Slab foundation
- Construction: Metal roof; Wood siding; Wood frame construction; Built in public records (year built source)
- Exterior features: Covered patio and porch; Porch; Patio; Chain link fencing; Shed(s); Storm shelter; South-facing
Interior
- Kitchen: Built-in range; Built-in oven; Oven; Range
- Flooring: Carpet; Tile; Vinyl
- Bathrooms: 1 full bathroom
- Heating & cooling: Gas heating; Radiant heating; Window unit(s) for cooling
- Interior features: Ceiling fan(s); Laminate counters; Vinyl window frames; Electric range connection; Ventilation for improved indoor air quality; Other interior features
- Laundry & utility: Washer hookup; Electric water heater
Neighborhood map
What this means for you Summary
Snapshot
- This is a 3-bed/2.0-bath single-family listed at $119k.
Deal economics
- At list price, monthly cash flow is $129 ($2k/yr) — positive.
- The deal already cash-flows at list — no discount required.
- To meet the 1% rule (rent ≥ 1% of price), the offer needs to be $105k (12.1% below list).
- Recommended offer: $105k (12.1% below list) — sets the bar for 1% rule.
Location & tenants
- Location reads 60/100 on livability (#351 in OK) — a middle-class / working-renter tenant base. Strengths: cost of living A+, housing A+, crime B+; Watch: schools F, amenities F, commute F.
- Wilburton (town): math 25% / reading 22% proficiency, ranked #136 of 270 in OK (top 50%) — low school quality limits family demand, transient renter base, plan for 1-2y turnover.
- Market conditions: 57 active listings in the ZIP.
Forward outlook
- In year one you build about $1k of equity ($823 loan paydown + $491 appreciation (0.4% local appreciation)).
- Latimer County population projected at -24% by 2050 — secular population decline; favor cash flow + early exit over multi-decade hold.
- At projected returns (0.4% appreciation + 3.0% rent growth), your $33k cash investment doubles in ~9 years — after that, you're playing with house money.
Negotiation context
- Only 9 days on market — expect competitive offers; lowballing is unlikely to land.
- Current owner paid $40k; list at $119k implies a 194% gain — meaningful room to come down on a strong offer.
Risks & watch-outs
- Climate carrying-cost: major wildfire risk; extreme-heat days projected 7→20/yr by 2055 (HVAC capex compounding) — expect insurance premiums to compound above CPI over the hold.
Questions for the listing agent
- Built in 1964 — when were the roof, HVAC, electrical panel, plumbing, and water heater last replaced?
- Is there a deadline driving the sale (1031 exchange, divorce, estate, relocation)? That informs how much negotiation room exists.
- Schools are F-rated, which usually means shorter tenancies and higher turnover. Who's the typical renter profile here, and what's been the actual vacancy rate?
- The area grade is low — what's the realistic commute time and amenity access for the typical tenant pool here? Any planned neighborhood developments (good or bad) we should know about?
- What's the average days-on-market for RENTAL listings here right now (not sales)? A rising rental-DOM trend means longer vacancies and softer asking-rent achievability than the comps imply.
- What's the recent tenant-quality profile in this submarket — average credit score on applications, eviction rate, late-payment / NSF rate, and stable-employment percentage? A property-management company in the area should have these aggregated.
- How much new for-sale + rental construction is in the pipeline within 1–3 miles? Heavy new supply typically softens prices + rents 12–24 months out; constrained supply supports both.
Investment metrics
- 1% rule
- 0.88% ✗
- Cap rate
- 7.59%
- Cash-on-cash
- 4.64%
- DSCR
- 1.21
- GRM
- 9.5
CMA / ARV
- ARV (on-the-fly)
- $113,400
- Comps found
- 4
Show comp detail 4 sales within ~0.75 mi
| Address | Dist | Beds/Ba | Sqft | Sold | Price | $/sf | Match |
|---|---|---|---|---|---|---|---|
| 115 Center Pt | 0.14mi | 3/1.5 | 1,364 (+8%) | 11mo | $133,000 | $98 | 69 |
| 116 SW 10th | 0.28mi | 3/1.5 | 1,164 (-8%) | 11mo | $105,000 | $90 | 63 |
| 608 SW 9th | 0.60mi | 3/1.0 | 1,268 (+1%) | 23mo | $105,000 | $83 | 48 |
| 305 SW 1st | 0.68mi | 3/1.0 | 1,338 (+6%) | 12mo | $95,000 | $71 | 44 |
Match score weights: distance 35% · size 25% · config 20% · recency 20%. Top-matched comps best support the ARV.
Projected returns pro-forma
0.41% appreciation · 3.0% rent growth · sell at horizon
- IRR
- 4.3%
- Equity multiple
- 1.21×
- Total profit
- $6,993
- Equity at exit
- $37,031
- IRR
- 9.1%
- Equity multiple
- 2.04×
- Total profit
- $34,699
- Equity at exit
- $46,541
Cash invested: $33,320 (down + closing). Projections, not guarantees.
Landlord ↔ Tenant lean methodology
- Overall (STATE)
- 83 Strongly Landlord-Friendly
- State Oklahoma
- 83 Strongly Landlord-Friendly · R+20
- County
- — inherits STATE
- City
- — inherits STATE
ZIP-level market 74578
- Home prices YoY
- 0.2%
- Active inventory
- 57
- Price-to-rent
- 9.5×
Monthly cashflow live
- Estimated rent
- $1,046 medium interval (Pro) →
- Mortgage (P&I)
- −$624
- Tax from tax record
- −$24 /mo · $290/yr
- Insurance
- −$50
- HOA
- −$0
- Vacancy / Maint / Mgmt
- −$220
- Net cashflow
- $129
Break-even live
UW: 25.0% down · 7.5% · 30yr · 1.5% tax · 5.0% vac · 8.0% maint · 8.0% mgmt
Financing live
Cash to close
- Down payment
- $29,750
- Closing costs
- $3,570
- Reserves months
- —
- Total cash needed
- —
Loan-product check · same deal, 3 products live
Conventional
25% down · 7.5% · 30yr
- Down + closing
- —
- Monthly P&I
- —
- Monthly cashflow
- —
- DSCR
- —
- Eligible?
- —
Personal DTI + credit; lowest rate.
DSCR
20% down · 8.5% · 30yr
- Down + closing
- —
- Monthly P&I
- —
- Monthly cashflow
- —
- DSCR
- —
- Eligible?
- —
No personal income docs; deal must DSCR.
Hard money
10% down · 12.0% · 12mo
- Down + closing
- —
- Monthly P&I
- —
- Monthly cashflow
- —
- DSCR
- —
- Eligible?
- —
Short-term bridge; refi at stabilization.
Listing history 8 events
-
2026-06-18days on market $119,000 Active 9 DOM
-
2026-06-17days on market $119,000 Active 8 DOM
-
2026-06-16days on market $119,000 Active 7 DOM
-
2026-06-15days on market $119,000 Active 6 DOM
-
2026-06-13days on market $119,000 Active 4 DOM
-
2026-06-12days on market $119,000 Active 3 DOM
-
2026-06-09remarks 481-char remark
-
2026-06-09$119,000 Active 1 DOM
ⓘ Source: listings_history table (triggers on properties + properties_extension) + one-shot
backfill from property_details.listing_events for pre-trigger history.
Tax reassessment forecast OK · Resets to sale price
- Current annual tax
- $290 · $24/mo
- Projected year-2 tax
- $1,071 · $89/mo
- Expected delta
- +$781/yr (+$65/mo · 269.3%)
ⓘ Screening estimate from a state-policy table — verify with the county assessor before closing.
Climate risk First Street
- Flood 1/10 Low FEMA zone X · 0% chance over 30 yrs
- Wildfire 7/10 Severe
- Heat 6/10 Major 7 d/yr ≥112°F today · 20 d/yr by 30 yrs out
- Wind 3/10 Moderate 6% chance of damaging wind over 30 yrs
- Air quality 2/10 Low 1 unhealthy d/yr today · 1 by 30 yrs out
Nearby sold comps map
Loading sold comps map…
Walkable amenities ~0.75 mi
Loading nearby amenities…
Taxation est. · year 1
- Rental income
- $12,557
- − Mortgage interest
- −$6,666
- − Property taxes
- −$290
- − Insurance
- −$595
- − Repairs & maintenance
- −$1,005
- − Management
- −$1,005
- − Depreciation
- −$3,462
- Taxable loss
- −$465
- Est. tax savings @ 24.0%
- +$112
- After-tax cash flow
- $1,658/yr
For passive investors: Depreciation is non-cash, so a rental often shows a tax loss while cash-flowing — sheltering income. Rental losses are passive: they offset passive income freely, and up to $25,000/yr can offset ordinary (W-2) income if you actively participate and your MAGI is under $100k (phasing out to $0 by $150k); unused losses carry forward. On sale, claimed depreciation is recaptured at up to 25%, and gains may owe capital-gains tax (a 1031 exchange can defer both). Figures are a year-1 estimate at your 24.0% rate — not tax advice; consult a CPA.
Schools (NCES district)
- District
- Wilburton
- NCES district ID
- 4032790
- Math proficiency
- 25% ▼ -10.00%
- Reading proficiency
- 22% ▼ -11.00%
- Median HH income
- $38,345
- Composite
- 19.72/100
- National rank
- #8718
- State rank
- #136 of 270 in OK
Livability — Wilburton
- Score
- 60/100
- State rank
- #351
- US rank
- #19035
Category grades
Schools grade is shown separately in the Schools card above.
Census & demographics
- Census place
- Wilburton, OK
- Population (ZIP)
- 5,721
Population outlook (Latimer County) Hauer SSP2
- Today (2025)
- 9,565 people
- By 2030
- 9,029 · -5.6%
- By 2040
- 8,084 · -15.5%
- By 2050
- 7,283 · -23.9%
- By 2075
- 5,893 · -38.4%
- By 2100
- 4,944 · -48.3%
Race, ethnicity, and origin ACS 2023
- Neighborhood character
- Diverse neighborhood (Simpson 0.62)
- Race & ethnicity
- White 61% Native American 24% Two or more races 10% Hispanic / Latino 5% Black 1%
- Common ancestry
- Italian 2% Lithuanian 1% Iranian 1%
- Foreign-born
- 1% · Canada
- Languages at home
- 97% English-only · Spanish 2%
Political lean MEDSL · Latimer
- 2024 margin
- Solid R (+65.6) · D 16.7% · R 82.3% · Other 1.0%
- 2008→2024 swing
- -28.5pp toward R · 2008: -37.1pp · 2024: -65.6pp
- All cycles
- 2024: R+65.6 2020: R+63.0 2016: R+56.7 2012: R+38.3 2008: R+37.1
Not yet ingested
- Civics
- —
Market trends
- HPI YoY
- ▲ 0.41%
- Current HPI
- 176.1285
- Rent YoY
- —
- Metro
- —
- State GDP YoY
- ▲ 1.55%
- F500 in state
- 6
Industry mix (Fortune 500 HQ in OK)
| Industry | F500 HQs | Revenue |
|---|---|---|
| Energy | 3 | $48B |
|
||
Price history
+193.8% since first listed2 events — show timeline
- 2026-06-09 Listed $119,000 MLS Technology, Inc.
- 2007-08-30 Sold (Public Records) $40,500 Public Records
Property tax history
-0.3%/yrLatest (2025): $290 · -8.5% YoY. Source: county tax records.
Cash-flow waterfall
monthlySold comps — $/sqft
last 12 mo · ≤1 miLoading sold comps…