 Multi-family
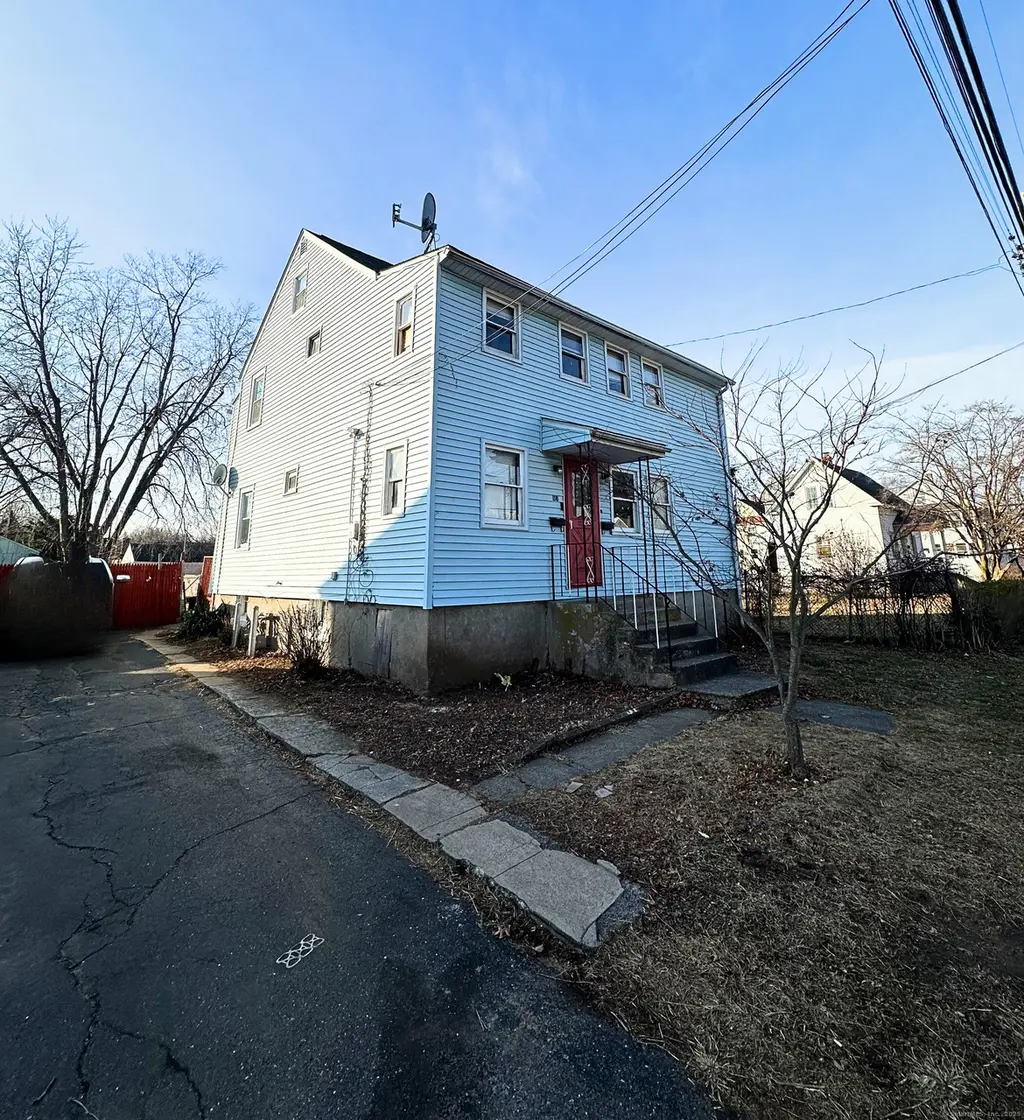
67 Laurel St · East Hartford, CT
Flood risk 1/10 · Minimal
- FEMA flood zone
- X (unshaded)
- Chance of flooding over 30 yrs
- 0.0%
- Est. flood insurance / yr
- $473 – $860
Fire risk 1/10 · Minimal
- Est. fire insurance / yr
- $829 – $1,539
Heat risk 5/10 · Moderate
- Hot days now (above 97°F)
- 7 days/yr
- Hot days in 30 yrs
- 16 days/yr
Wind risk 6/10 · Moderate
- Chance of severe wind over 30 yrs
- 27.0%
Air-quality risk 3/10 · Minor
- Unhealthy air days now
- 3 days/yr
- Unhealthy air days in 30 yrs
- 4 days/yr
Risk factors via First Street. Map © Google.
Why this score? — see what drove the D grade
The composite is a weighted blend of 9 inputs, each scored 0–100. Each bar is that input's sub-score; the figure is the points it added to the 100-point composite (weight × sub-score).
- Cash flow +16.1/30.0
- ARV discount +7.5/15.0
- DSCR +5.0/10.0
- 1% rule +4.7/10.0
- Livability +3.7/5.0
- Rent growth +2.5/5.0
- Condition / age +2.5/5.0
- Schools +2.1/10.0
- Appreciation +0.0/10.0
$325,000
🖨 Deal sheet (PDF) 📄 Offer letter ✓ Due diligence
Multi-family units
County records classify this as Multi-Family (2-4 Unit). Listing-text estimate: 1 unit. estimate disagrees with records
Listing remarks
* * OFFER DEADLINE: REQUESTING HIGHEST/BEST OFFERS BY TUESDAY, MARCH 31ST AT 11AM * * * Welcome to 67 Laurel Street in East Hartford-a charming home that blends comfort, convenience, and value. Located in a convenient East Hartford neighborhood, this home offers easy access to local shops, dining, parks, and major highways-making commuting a breeze while still enjoying a quiet residential setting. Each unit includes two bedrooms and 1 bathroom. The spacious driveway provides off street parking, and the backyard has ample room for activities. Additionally, the backyard contains a detached shed for outdoor storage. Whether you're a first-time home-owner, downsizing, or looking for an inve
Key facts
- Off street parking
- 6,969 sq ft lot
- Built 1920
Tags
Neighborhood map
What this means for you Summary
Snapshot
- This is a 2-bed/2.0-bath multifamily listed at $325k.
Deal economics
- At list price, monthly cash flow is $167 ($2k/yr) — positive.
- The deal already cash-flows at list — no discount required.
- To meet the 1% rule (rent ≥ 1% of price), the offer needs to be $314k (3.4% below list).
- Recommended offer: $314k (3.4% below list) — sets the bar for 1% rule.
- Cap rate 6.9% vs local median 4.1% in East Hartford — top-decile yield for the area; either an underpriced asset or a hidden risk that comps aren't pricing in. Stress-test before assuming the spread holds.
Location & tenants
- Location reads 73/100 on livability (#76 in CT) — a middle-class / working-renter tenant base. Strengths: housing A+, crime A, commute A-; Watch: amenities F, health & safety F.
- East Hartford School District (urban): math 17% / reading 30% proficiency, ranked #140 of 153 in CT (top 92%) — low school quality limits family demand, transient renter base, plan for 1-2y turnover.
- Zoned schools: Anna E. Norris School (math 8% / reading 17%, grade F, #490 of 553 statewide, top 90%, 270 students, 80% FRL); East Hartford Middle School (math 12% / reading 26%, grade F, #163 of 175 statewide, top 94%, 890 students, 70% FRL); East Hartford High School (math 11% / reading 33%, grade F, #156 of 194 statewide, top 82%, 1,698 students, 63% FRL).
- Market conditions: 53 active listings in the ZIP; 3 comparable units currently listed for rent nearby; rentals at typical pace (median 26d on market — plan ~3-4 weeks tenant-placement turnaround); 1,867 units permitted in Capitol Planning Region in 2024 (1,399 in 5+ unit buildings).
- At $3,138/mo this rent would consume 66% of the median local household income ($57k/yr) (locally 1205% of renters already pay >50% of income on rent) — very limited rent-growth headroom before tenants either downsize or default.
Forward outlook
- Local home prices are declining (-3.0%/yr); year-one equity from $2k of loan paydown is wiped out by about $10k of value loss. Plan a longer hold.
Negotiation context
- Only 9 days on market — expect competitive offers; lowballing is unlikely to land.
- 4 sale attempts with the ask held roughly flat each time — persistent listings suggest the price (not the market) is what's stuck; bring a comps-based counter.
Risks & watch-outs
- Watch-outs: built in 1920 — expect roof / HVAC / electrical / plumbing capex.
- Climate carrying-cost: major wind risk, 27% chance of damaging wind over 30y; extreme-heat days projected 7→16/yr by 2055 (HVAC capex compounding) — expect insurance premiums to compound above CPI over the hold.
Questions for the listing agent
- Built in 1920 — when were the roof, HVAC, electrical panel, plumbing, and water heater last replaced?
- Is there a deadline driving the sale (1031 exchange, divorce, estate, relocation)? That informs how much negotiation room exists.
- Schools are D-rated, which usually means shorter tenancies and higher turnover. Who's the typical renter profile here, and what's been the actual vacancy rate?
- The area grade is low — what's the realistic commute time and amenity access for the typical tenant pool here? Any planned neighborhood developments (good or bad) we should know about?
- What's the average days-on-market for RENTAL listings here right now (not sales)? A rising rental-DOM trend means longer vacancies and softer asking-rent achievability than the comps imply.
- What's the recent tenant-quality profile in this submarket — average credit score on applications, eviction rate, late-payment / NSF rate, and stable-employment percentage? A property-management company in the area should have these aggregated.
- How much new apartment / multifamily construction is in the pipeline within 1–3 miles? Heavy new supply (>2% of stock underway) typically softens rents 12–24 months out; light construction supports rent growth.
Investment metrics
- 1% rule
- 0.97% ✗
- Cap rate
- 6.91%
- Cash-on-cash
- 2.20%
- DSCR
- 1.10
- GRM
- 8.6
CMA / ARV
No comps found within radius.
Projected returns pro-forma
-3.0% appreciation · 3.0% rent growth · sell at horizon
- IRR
- -12.8%
- Equity multiple
- 0.54×
- Total profit
- $-41,928
- Equity at exit
- $48,459
- IRR
- -3.7%
- Equity multiple
- 0.75×
- Total profit
- $-22,442
- Equity at exit
- $28,100
Cash invested: $91,000 (down + closing). Projections, not guarantees.
Landlord ↔ Tenant lean methodology
- Overall (STATE)
- 27 Tenant-Leaning
- State Connecticut
- 27 Tenant-Leaning · D+7
- County
- — inherits STATE
- City
- — inherits STATE
ZIP-level market 06108
- Home prices YoY
- -17.6%
- Active inventory
- 53
- Price-to-rent
- 17.3×
Monthly cashflow live
- Estimated rent
- $3,138 high interval (Pro) →
- Mortgage (P&I)
- −$1,704
- Tax from tax record
- −$472 /mo · $5,665/yr
- Insurance
- −$135
- HOA
- −$0
- Vacancy / Maint / Mgmt
- −$659
- Net cashflow
- $167
Break-even live
Sensitivity live
| Price | -10% $351 | -5% $259 | +0% $167 | +5% $75 | +10% $-17 |
|---|---|---|---|---|---|
| Rent | -10% $-81 | -5% $43 | +0% $167 | +5% $291 | +10% $415 |
| Rate | -1.0pp $331 | -0.5pp $250 | base $167 | +0.5pp $83 | +1.0pp $-3 |
2-unit breakdown (identical units grouped — click to expand)
| Units | Beds | Baths | Est. rent |
|---|---|---|---|
| 2× units | 2 | 1 | $3,138 |
| #1 | 2 | 1 | $1,569 |
| #2 | 2 | 1 | $1,569 |
| Total (2 units) | $3,138 | ||
UW: 25.0% down · 7.5% · 30yr · 1.5% tax · 5.0% vac · 8.0% maint · 8.0% mgmt
Financing live
Cash to close
- Down payment
- $81,250
- Closing costs
- $9,750
- Reserves months
- —
- Total cash needed
- —
Loan-product check · same deal, 3 products live
Conventional
25% down · 7.5% · 30yr
- Down + closing
- —
- Monthly P&I
- —
- Monthly cashflow
- —
- DSCR
- —
- Eligible?
- —
Personal DTI + credit; lowest rate.
DSCR
20% down · 8.5% · 30yr
- Down + closing
- —
- Monthly P&I
- —
- Monthly cashflow
- —
- DSCR
- —
- Eligible?
- —
No personal income docs; deal must DSCR.
Hard money
10% down · 12.0% · 12mo
- Down + closing
- —
- Monthly P&I
- —
- Monthly cashflow
- —
- DSCR
- —
- Eligible?
- —
Short-term bridge; refi at stabilization.
Rent comps 3 comps
| Address | Beds | Baths | Sqft | Rent | $/sqft | DOM | Units | Dist |
|---|---|---|---|---|---|---|---|---|
| 296 Tolland St Unit 2F East Hartford, CT | 1.0 | 1.0 | 1125 | $1,500 | $1.33 | 25d | 1 | 0.26mi |
| 26-28 Elmer St Unit 2nd floor East Hartford, CT | 3.0 | 1.0 | 1500 | $2,000 | $1.33 | 45d | 1 | 0.56mi |
| 55 Leverich Dr East Hartford, CT | 3.0 | 2.5 | 2045 | $3,300 | $1.61 | 12d | 1 | 1.48mi |
Listing history 9 events
-
2026-04-02status Under Contract
-
2026-03-24$325,000 Active
-
2025-12-31historical
-
2025-08-11$330,000 Active
-
2025-07-16historical
-
2025-03-05status Active
-
2025-02-03status Under Contract
-
2025-01-16price $329,900
-
2025-01-03$349,900 Active
ⓘ Source: listings_history table (triggers on properties + properties_extension) + one-shot
backfill from property_details.listing_events for pre-trigger history.
Tax reassessment forecast CT · Partial reset (capped growth)
- Current annual tax
- $5,665 · $472/mo
- Projected year-2 tax
- $6,310 · $526/mo
- Expected delta
- +$645/yr (+$54/mo · 11.4%)
ⓘ Screening estimate from a state-policy table — verify with the county assessor before closing.
Climate risk First Street
- Flood 1/10 Low FEMA zone X (unshaded) · 0% chance over 30 yrs
- Wildfire 1/10 Low
- Heat 5/10 Major 7 d/yr ≥97°F today · 16 d/yr by 30 yrs out
- Wind 6/10 Major 27% chance of damaging wind over 30 yrs
- Air quality 3/10 Moderate 3 unhealthy d/yr today · 4 by 30 yrs out
Nearby sold comps map
Loading sold comps map…
Walkable amenities ~0.75 mi
Loading nearby amenities…
Taxation est. · year 1
- Rental income
- $37,656
- − Mortgage interest
- −$18,205
- − Property taxes
- −$5,665
- − Insurance
- −$1,625
- − Repairs & maintenance
- −$3,012
- − Management
- −$3,012
- − Depreciation
- −$9,455
- Taxable loss
- −$3,319
- Est. tax savings @ 24.0%
- +$796
- After-tax cash flow
- $2,803/yr
For passive investors: Depreciation is non-cash, so a rental often shows a tax loss while cash-flowing — sheltering income. Rental losses are passive: they offset passive income freely, and up to $25,000/yr can offset ordinary (W-2) income if you actively participate and your MAGI is under $100k (phasing out to $0 by $150k); unused losses carry forward. On sale, claimed depreciation is recaptured at up to 25%, and gains may owe capital-gains tax (a 1031 exchange can defer both). Figures are a year-1 estimate at your 24.0% rate — not tax advice; consult a CPA.
Schools (NCES district)
- District
- East Hartford School District
- NCES district ID
- 0901260
- Math proficiency
- 17% ▼ -5.00%
- Reading proficiency
- 30% ▼ -7.00%
- Median HH income
- $49,691
- Composite
- 20.74/100
- National rank
- #8519
- State rank
- #140 of 153 in CT
Livability — East Hartford
- Score
- 73/100
- State rank
- #76
- US rank
- #5527
Category grades
Schools grade is shown separately in the Schools card above.
Census & demographics
- Census place
- East Hartford, CT
- County
- Hartford County · 754,208 people
- City population
- 50,918
- Metro
- Hartford-East Hartford-Middletown, CT
- Population (ZIP)
- 23,499
- Household income
- $56,663
- Rent vs Own
- Severe rent burden
- 1205.0
Population outlook (Capitol County) Hauer SSP2
- By 2040
- 1,063,519
Race, ethnicity, and origin ACS 2023
- Neighborhood character
- Diverse neighborhood (Simpson 0.68)
- Race & ethnicity
- Hispanic / Latino 44% Black 26% White 23% Two or more races 18% Asian 2%
- Hispanic origin (detail)
- Mexican 2% Puerto Rican 28% Dominican 2% Salvadoran 1%
- Common ancestry
- Romanian 4% Lithuanian 4% Estonian 2%
- Foreign-born
- 22% · Canada, Jamaica, Vietnam
- Languages at home
- 55% English-only · Spanish 35% Other Indo-European 3% French/Haitian/Cajun 2%
Political lean MEDSL · Capitol
- 2024 margin
- Strong D (+21.9) · D 60.1% · R 38.2% · Other 1.7%
- All cycles
- 2024: D+21.9
Not yet ingested
- Civics
- —
Market trends
- HPI YoY
- ▼ -65.15%
- Current HPI
- 306.0426
- Rent YoY
- —
- Metro
- Hartford-East Hartford-Middletown, CT
- State GDP YoY
- ▲ 1.06%
- F500 in state
- 38
Industry mix (Fortune 500 HQ in CT)
| Industry | F500 HQs | Revenue |
|---|---|---|
| Industrial Machinery | 4 | $38B |
|
||
| Insurance | 3 | $71B |
|
||
| Financial Services | 2 | $25B |
|
||
| Transportation / Logistics | 2 | $18B |
|
||
| Healthcare | 1 | $247B |
|
||
| Telecommunications | 1 | $55B |
|
||
Price history
-7.1% since first listed9 events — show timeline
- 2026-04-02 Pending — Smart MLS
- 2026-03-24 Listed $325,000 Smart MLS
- 2025-12-31 Listing Removed — Smart MLS
- 2025-08-11 Listed $330,000 Smart MLS
- 2025-07-16 Listing Removed — Smart MLS
- 2025-03-05 Relisted — Smart MLS
- 2025-02-03 Pending — Smart MLS
- 2025-01-16 Price Changed $329,900 Smart MLS
- 2025-01-03 Listed $349,900 Smart MLS
Property tax history
+2.4%/yrLatest (2025): $5,665 · +4.3% YoY. Source: county tax records.
Cash-flow waterfall
monthlySold comps — $/sqft
last 12 mo · ≤1 miLoading sold comps…