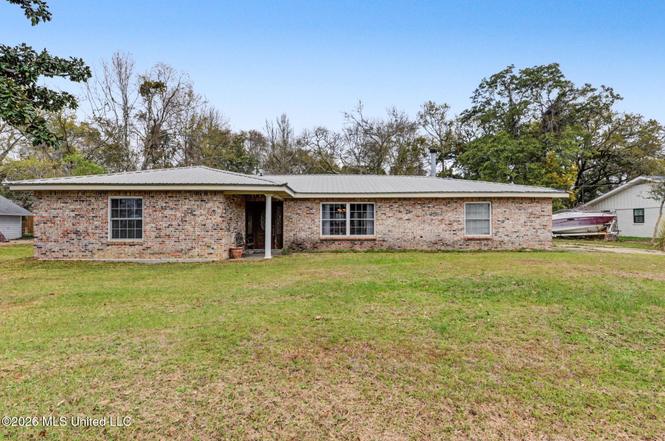
107 Sea Pine St · Long Beach, MS
Flood risk 5/10 · Moderate
- FEMA flood zone
- X (shaded)
- Chance of flooding over 30 yrs
- 0.23%
- Est. flood insurance / yr
- $507 – $1,088
Fire risk 1/10 · Minimal
- Est. fire insurance / yr
- $1,241 – $2,305
Heat risk 10/10 · Severe
- Hot days now (above 105°F)
- 7 days/yr
- Hot days in 30 yrs
- 23 days/yr
Wind risk 9/10 · Severe
- Chance of severe wind over 30 yrs
- 99.0%
Air-quality risk 1/10 · Minimal
- Unhealthy air days now
- 0 days/yr
- Unhealthy air days in 30 yrs
- 0 days/yr
Risk factors via First Street. Map © Google.
Why this score? — see what drove the D grade
The composite is a weighted blend of 9 inputs, each scored 0–100. Each bar is that input's sub-score; the figure is the points it added to the 100-point composite (weight × sub-score).
- Cash flow +12.9/30.0
- ARV discount +9.2/15.0
- Schools +4.4/10.0
- DSCR +3.9/10.0
- Livability +3.5/5.0
- 1% rule +3.1/10.0
- Rent growth +3.0/5.0
- Condition / age +2.5/5.0
- Appreciation +0.0/10.0
$239,900
🖨 Deal sheet (PDF) 📄 Offer letter ✓ Due diligence
Listing remarks
A gem awaiting its polish! Situated on a quiet dead end street just one block from the beach- this open floor plan all-brick home is primed for those looking to make their personal touch with equity upside! With a . 4 acre lot, a 6 year old metal roof, and a 2 year old HVAC- the main components are covered and in great health! With no flood insurance required, a termite bond in place, and plenty of upside- this home and its surrounding established neighbors are sure to impress! The home itself features open concept living with three bedrooms, an expansive den/living room with fireplace, dining area, and plenty of workable family living space to enhance as you see fit. The family space fe
Key facts
- 2 year old hvac
- Open floor plan
- 0.4 acre lot
Tags
Neighborhood map
What this means for you Summary
Snapshot
- This is a 3-bed/1.5-bath single-family listed at $240k.
Deal economics
- At list price, monthly cash flow is $-16 ($-193/yr) — negative.
- To cash-flow at today's rent, offer at most $237k (1.2% below list).
- To meet the 1% rule (rent ≥ 1% of price), the offer needs to be $195k (18.9% below list).
- Recommended offer: $195k (18.9% below list) — sets the bar for 1% rule.
- Cap rate 6.2% vs local median 4.6% in Long Beach — top-decile yield for the area; either an underpriced asset or a hidden risk that comps aren't pricing in. Stress-test before assuming the spread holds.
Location & tenants
- Location reads 69/100 on livability (#52 in MS) — a middle-class / working-renter tenant base. Strengths: crime A+, cost of living A+, housing A+; Watch: amenities F, commute F, health & safety F.
- Long Beach School District (suburban): math 52% / reading 50% proficiency, ranked #9 of 130 in MS (top 7%) — acceptable for families but not a draw, mixed tenant base, ~2y average lease.
- Zoned schools: Thomas L Reeves Elementary School (math 37% / reading 52%, grade F, #92 of 375 statewide, top 26%, 431 students, 99% FRL); Harper Mc Caughan Elem School (math 54% / reading 50%, grade C+, #25 of 179 statewide, top 14%, 687 students, 100% FRL); Long Beach Senior High School (math 22% / reading 47%, grade F, #68 of 197 statewide, top 39%, 932 students, 100% FRL) — zoned schools average 100% FRL vs 43% district-wide (57 pts higher); higher-poverty schools than district average — tighter screening recommended.
- Market conditions: Rents rising (+1.9%/yr); 311 active listings in the ZIP; 6 comparable units currently listed for rent nearby; rentals at typical pace (median 15d on market — plan ~3-4 weeks tenant-placement turnaround); 2,194 units permitted in Harrison County in 2024 (0 in 5+ unit buildings).
- This rent runs 33% of the median local income ($70k/yr) — at the standard rent-burdened threshold; future hikes will face affordability resistance.
Forward outlook
- Local home prices are declining (-3.0%/yr); year-one equity from $2k of loan paydown is wiped out by about $7k of value loss. Plan a longer hold.
- Harrison County population projected at +27% by 2050 — long-run rental-demand tailwind backs the buy-and-hold thesis.
Negotiation context
- It's been on market 17 days — a 2% lower offer ($236k) is reasonable based on typical stale-listing flexibility.
- 2 sale attempts with the ask held roughly flat each time — persistent listings suggest the price (not the market) is what's stuck; bring a comps-based counter.
Risks & watch-outs
- Climate carrying-cost: moderate flood risk; severe wind risk, 99% chance of damaging wind over 30y; extreme-heat days projected 7→23/yr by 2055 (HVAC capex compounding) — expect insurance premiums to compound above CPI over the hold.
Questions for the listing agent
- What do current leases actually rent for vs. the listed asking? Can we see a recent rent roll and the last 12 months of T-12 income?
- Built in 1973 — when were the roof, HVAC, electrical panel, plumbing, and water heater last replaced?
- Is there a deadline driving the sale (1031 exchange, divorce, estate, relocation)? That informs how much negotiation room exists.
- Schools are B-rated — typically a magnet for longer-tenancy family renters. What's the average tenant stay here, and is there a school-zone premium baked into asking?
- The area grade is low — what's the realistic commute time and amenity access for the typical tenant pool here? Any planned neighborhood developments (good or bad) we should know about?
- What's the average days-on-market for RENTAL listings here right now (not sales)? A rising rental-DOM trend means longer vacancies and softer asking-rent achievability than the comps imply.
- What's the recent tenant-quality profile in this submarket — average credit score on applications, eviction rate, late-payment / NSF rate, and stable-employment percentage? A property-management company in the area should have these aggregated.
- How much new for-sale + rental construction is in the pipeline within 1–3 miles? Heavy new supply typically softens prices + rents 12–24 months out; constrained supply supports both.
Investment metrics
- 1% rule
- 0.81% ✗
- Cap rate
- 6.21%
- Cash-on-cash
- -0.29%
- DSCR
- 0.99
- GRM
- 10.3
CMA / ARV
- ARV (on-the-fly)
- $249,555
- Comps found
- 12
Show comp detail 12 sales within ~0.75 mi
| Address | Dist | Beds/Ba | Sqft | Sold | Price | $/sf | Match |
|---|---|---|---|---|---|---|---|
| 107 Sea Pine St | 0.00mi | 3/3.0 | 1,965 (0%) | 1mo | $239,900 | $122 | 93 |
| 134 Ocean Wave Ave | 0.07mi | 3/2.5 | 1,936 (-2%) | 8mo | $225,000 | $116 | 84 |
| 807 Mills Ave | 0.68mi | 3/2.0 | 1,933 (-2%) | 3mo | $284,900 | $147 | 61 |
| 7 Chimney Cross Rd | 0.33mi | 3/2.0 | 2,200 (+12%) | 7mo | $225,000 | $102 | 57 |
| 1154 E Old Pass Rd | 0.45mi | 3/2.0 | 1,791 (-9%) | 7mo | $249,000 | $139 | 56 |
| 100 Valentine Dr | 0.60mi | 3/2.0 | 1,800 (-8%) | 6mo | $197,500 | $110 | 51 |
| 111 Edmund Dr | 0.39mi | 4/2.0 (+1) | 1,801 (-8%) | 13mo | $210,000 | $117 | 50 |
| 614 Ruth Ave | 0.47mi | 3/2.0 | 1,750 (-11%) | 10mo | $459,900 | $263 | 50 |
| 706 Mills Ave | 0.71mi | 3/1.0 | 1,800 (-8%) | 10mo | $169,900 | $94 | 42 |
| 110 N Ida Ln | 0.53mi | 4/2.5 (+1) | 1,797 (-8%) | 13mo | $229,000 | $127 | 42 |
| 808 Mills Ave | 0.71mi | 2/2.0 (-1) | 1,678 (-15%) | 5mo | $215,000 | $128 | 31 |
| 4615 Lewis St | 0.65mi | 4/2.0 (+1) | 1,690 (-14%) | 20mo | $243,000 | $144 | 23 |
Match score weights: distance 35% · size 25% · config 20% · recency 20%. Top-matched comps best support the ARV.
Projected returns pro-forma
-3.0% appreciation · 1.93% rent growth · sell at horizon
- IRR
- -17.9%
- Equity multiple
- 0.37×
- Total profit
- $-42,006
- Equity at exit
- $35,770
- IRR
- -12.2%
- Equity multiple
- 0.31×
- Total profit
- $-46,365
- Equity at exit
- $20,742
Cash invested: $67,172 (down + closing). Projections, not guarantees.
Landlord ↔ Tenant lean methodology
- Overall (STATE)
- 90 Strongly Landlord-Friendly
- State Mississippi
- 90 Strongly Landlord-Friendly · R+11
- County
- — inherits STATE
- City
- — inherits STATE
ZIP-level market 39560
- Home prices YoY
- -25.7%
- Rents YoY
- 1.9%
- Active inventory
- 311
- Price-to-rent
- 10.3×
Monthly cashflow live
- Estimated rent
- $1,946 high interval (Pro) →
- Mortgage (P&I)
- −$1,258
- Tax from tax record
- −$196 /mo · $2,348/yr
- Insurance
- −$100
- HOA
- −$0
- Vacancy / Maint / Mgmt
- −$409
- Net cashflow
- $-16
Break-even live
Sensitivity live
| Price | -10% $120 | -5% $52 | +0% $-16 | +5% $-84 | +10% $-152 |
|---|---|---|---|---|---|
| Rent | -10% $-170 | -5% $-93 | +0% $-16 | +5% $61 | +10% $138 |
| Rate | -1.0pp $105 | -0.5pp $45 | base $-16 | +0.5pp $-78 | +1.0pp $-141 |
UW: 25.0% down · 7.5% · 30yr · 1.5% tax · 5.0% vac · 8.0% maint · 8.0% mgmt
Financing live
Cash to close
- Down payment
- $59,975
- Closing costs
- $7,197
- Reserves months
- —
- Total cash needed
- —
Loan-product check · same deal, 3 products live
Conventional
25% down · 7.5% · 30yr
- Down + closing
- —
- Monthly P&I
- —
- Monthly cashflow
- —
- DSCR
- —
- Eligible?
- —
Personal DTI + credit; lowest rate.
DSCR
20% down · 8.5% · 30yr
- Down + closing
- —
- Monthly P&I
- —
- Monthly cashflow
- —
- DSCR
- —
- Eligible?
- —
No personal income docs; deal must DSCR.
Hard money
10% down · 12.0% · 12mo
- Down + closing
- —
- Monthly P&I
- —
- Monthly cashflow
- —
- DSCR
- —
- Eligible?
- —
Short-term bridge; refi at stabilization.
Rent comps 6 comps
| Address | Beds | Baths | Sqft | Rent | $/sqft | DOM | Units | Dist |
|---|---|---|---|---|---|---|---|---|
| 945 Finley St Long Beach, MS | 3.0 | 2.0 | 2080 | $2,200 | $1.06 | 15d | 1 | 0.06mi |
| 1412 Jo Ellen Cir Gulfport, MS | 3.0 | 1.5 | 1275 | $1,050 | $0.82 | 15d | 1 | 0.76mi |
| 1129 Woodward Ave Gulfport, MS | 3.0 | 1.0 | 1719 | $1,300 | $0.76 | 15d | 1 | 0.82mi |
| 4319 Lewis St Gulfport, MS | 3.0 | 2.0 | 1371 | $1,649 | $1.20 | 15d | 1 | 0.92mi |
| 4115 8th St Gulfport, MS | 2.0 | 2.5 | 1514 | $2,375 | $1.57 | 45d | 1 | 1.14mi |
| 4115 8th St Gulfport, MS | 2.0 | 2.5 | 1514 | $2,375 | $1.57 | 15d | 1 | 1.14mi |
Listing history 5 events
-
2026-04-08status Pending
-
2026-03-30price $239,900
-
2026-03-25status Active
-
2026-03-14status Pending
-
2026-03-12$245,000 Active
ⓘ Source: listings_history table (triggers on properties + properties_extension) + one-shot
backfill from property_details.listing_events for pre-trigger history.
Tax reassessment forecast MS · Resets to sale price
- Current annual tax
- $2,348 · $196/mo
- Projected year-2 tax
- $2,348 · $196/mo
- Expected delta
- $0/yr ($0/mo · 0.0%)
ⓘ Screening estimate from a state-policy table — verify with the county assessor before closing.
Climate risk First Street
- Flood 5/10 Major FEMA zone X (shaded) · 23% chance over 30 yrs
- Wildfire 1/10 Low
- Heat 10/10 Extreme 7 d/yr ≥105°F today · 23 d/yr by 30 yrs out
- Wind 9/10 Extreme 99% chance of damaging wind over 30 yrs
- Air quality 1/10 Low 0 unhealthy d/yr today · 0 by 30 yrs out
Nearby sold comps map
Loading sold comps map…
Walkable amenities ~0.75 mi
Loading nearby amenities…
Taxation est. · year 1
- Rental income
- $23,356
- − Mortgage interest
- −$13,438
- − Property taxes
- −$2,348
- − Insurance
- −$1,200
- − Repairs & maintenance
- −$1,869
- − Management
- −$1,869
- − Depreciation
- −$6,979
- Taxable loss
- −$4,345
- Est. tax savings @ 24.0%
- +$1,043
- After-tax cash flow
- $850/yr
For passive investors: Depreciation is non-cash, so a rental often shows a tax loss while cash-flowing — sheltering income. Rental losses are passive: they offset passive income freely, and up to $25,000/yr can offset ordinary (W-2) income if you actively participate and your MAGI is under $100k (phasing out to $0 by $150k); unused losses carry forward. On sale, claimed depreciation is recaptured at up to 25%, and gains may owe capital-gains tax (a 1031 exchange can defer both). Figures are a year-1 estimate at your 24.0% rate — not tax advice; consult a CPA.
Schools (NCES district)
- District
- Long Beach School District
- NCES district ID
- 2802670
- Math proficiency
- 52% ▼ -8.00%
- Reading proficiency
- 50% ▼ -7.00%
- Median HH income
- $50,548
- Composite
- 43.68/100
- National rank
- #2955
- State rank
- #9 of 130 in MS
Livability — Long Beach
- Score
- 69/100
- State rank
- #52
- US rank
- #8554
Category grades
Schools grade is shown separately in the Schools card above.
Census & demographics
- Census place
- Long Beach, MS
- County
- Harrison County · 178,171 people
- City population
- 18,702
- Metro
- Gulfport-Biloxi, MS
- Population (ZIP)
- 18,702
- Household income
- $69,769
- Rent vs Own
- Severe rent burden
- 658.0
Population outlook (Harrison County) Hauer SSP2
- Today (2025)
- 228,444 people
- By 2030
- 241,942 · +5.9%
- By 2040
- 267,531 · +17.1%
- By 2050
- 291,062 · +27.4%
- By 2075
- 346,711 · +51.8%
- By 2100
- 378,165 · +65.5%
Race, ethnicity, and origin ACS 2023
- Neighborhood character
- Predominantly White (80%)
- Race & ethnicity
- White 80% Black 10% Two or more races 7% Hispanic / Latino 3% Asian 2%
- Common ancestry
- Lithuanian 6% Slovak 2% Serbian 1%
- Foreign-born
- 5% · Canada, South Korea
- Languages at home
- 94% English-only · Spanish 2% Other Indo-European 2% Tagalog/Filipino 1%
Political lean MEDSL · Harrison
- 2024 margin
- Strong R (+28.9) · D 35.0% · R 63.9% · Other 1.1%
- 2008→2024 swing
- -2.9pp toward R · 2008: -26.0pp · 2024: -28.9pp
- All cycles
- 2024: R+28.9 2020: R+25.2 2016: R+30.7 2012: R+26.6 2008: R+26.0
Not yet ingested
- Civics
- —
Market trends
- HPI YoY
- ▼ -67.49%
- Current HPI
- 195.0807
- Rent YoY
- ▲ 1.93%
- Metro
- Gulfport-Biloxi, MS
- State GDP YoY
- —
- F500 in state
- 0
Price history
-2.1% since first listed5 events — show timeline
- 2026-04-08 Pending — MLSU
- 2026-03-30 Price Changed $239,900 MLSU
- 2026-03-25 Relisted — MLSU
- 2026-03-14 Pending — MLSU
- 2026-03-12 Listed $245,000 MLSU
Property tax history
+5.4%/yrLatest (2025): $2,348 · +7.0% YoY. Source: county tax records.
Cash-flow waterfall
monthlySold comps — $/sqft
last 12 mo · ≤1 miLoading sold comps…