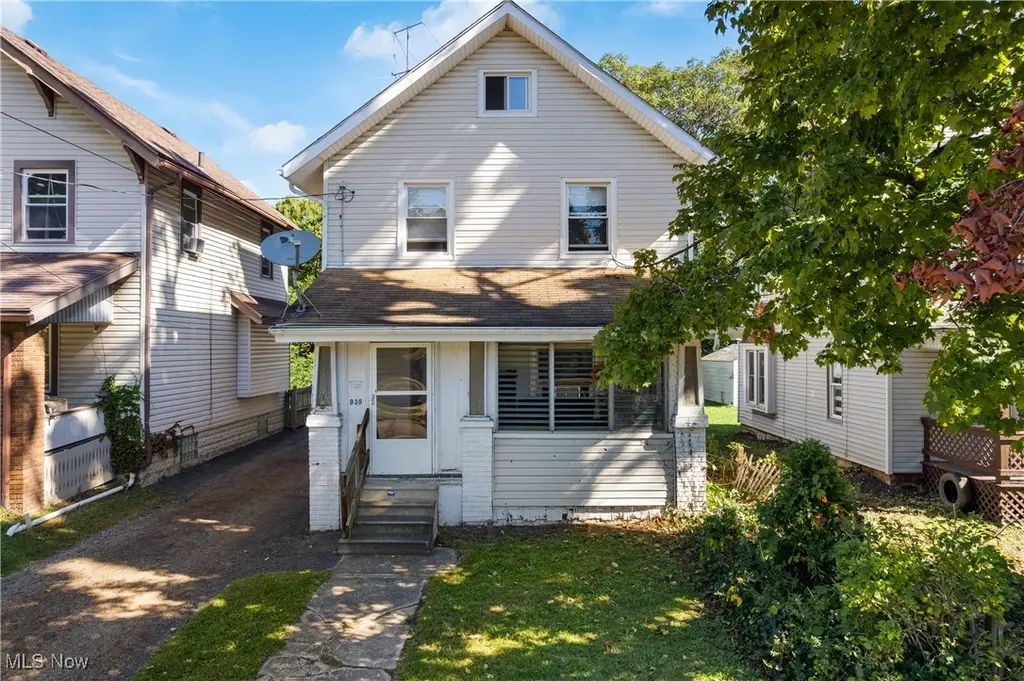
939 W Exchange St · Akron, OH
Flood risk 1/10 · Minimal
- FEMA flood zone
- X (unshaded)
- Chance of flooding over 30 yrs
- 0.0%
- Est. flood insurance / yr
- $473 – $860
Fire risk 1/10 · Minimal
- Est. fire insurance / yr
- $713 – $1,323
Heat risk 3/10 · Minor
- Hot days now (above 97°F)
- 7 days/yr
- Hot days in 30 yrs
- 16 days/yr
Wind risk 1/10 · Minimal
- Chance of severe wind over 30 yrs
- —
Air-quality risk 3/10 · Minor
- Unhealthy air days now
- 2 days/yr
- Unhealthy air days in 30 yrs
- 4 days/yr
Risk factors via First Street. Map © Google.
Why this score? — see what drove the C+ grade
The composite is a weighted blend of 9 inputs, each scored 0–100. Each bar is that input's sub-score; the figure is the points it added to the 100-point composite (weight × sub-score).
- Cash flow +23.9/30.0
- ARV discount +10.7/15.0
- DSCR +7.7/10.0
- 1% rule +6.7/10.0
- Livability +4.0/5.0
- Rent growth +2.5/5.0
- Condition / age +2.5/5.0
- Schools +2.1/10.0
- Appreciation +0.0/10.0
$108,000
🖨 Deal sheet (PDF) 📄 Offer letter ✓ Due diligence
Listing remarks MLS
Attention Investors!! Expand your portfolio with this well maintained, single-family home located in Akron's Highland Square Neighborhood. This property is occupied, providing immediate cashflow. It is currently generating $1,000 per month in rental income, and offers great value-add potential. This unit is leased through 4/30/2026, by long term tenants. This property presents a great opportunity to add a stable, income-producing property to your portfolio, with potential to increase income and build long term equity in an attractive location.
Key facts
- Value-add potential
- Immediate cashflow
- Single-family home
Tags
Neighborhood map
What this means for you Summary
Snapshot
- This is a 3-bed/1.0-bath single-family listed at $108k.
Deal economics
- At list price, monthly cash flow is $209 ($3k/yr) — positive.
- The deal already cash-flows at list — no discount required.
- Meets the 1% rule at list price ($1k rent vs $108k).
- Recommended offer: $95k (12.0% below list) — sets the bar for market timing.
- Cap rate 8.6% vs local median 6.6% in Akron — top-decile yield for the area; either an underpriced asset or a hidden risk that comps aren't pricing in. Stress-test before assuming the spread holds.
Location & tenants
- Location reads 81/100 on livability (#104 in OH, #1,591 nationally) — a professional / high-income tenant draw. Strengths: amenities A+, commute A+, cost of living A+; Watch: crime F, employment F.
- Akron City (urban): math 22% / reading 30% proficiency, ranked #602 of 656 in OH (top 92%) — low school quality limits family demand, transient renter base, plan for 1-2y turnover; 66% free/reduced lunch — lower-income household profile, screen leases tightly.
- Market conditions: 27 active listings in the ZIP; 40 comparable units currently listed for rent nearby; rentals lingering (median 45d on market — plan ~5-8 weeks vacancy on turnover, expect pricing pressure); 55% of comp listings sitting > 30 days — soft ceiling on asking rent; lower-income renter base — watch delinquency; 1,114 units permitted in Summit County in 2024 (397 in 5+ unit buildings).
- This rent runs 36% of the median local income ($42k/yr) — at the standard rent-burdened threshold; future hikes will face affordability resistance.
Forward outlook
- Local home prices are declining (-3.0%/yr); year-one equity from $747 of loan paydown is wiped out by about $3k of value loss. Plan a longer hold.
- Summit County population projected to shrink 6% by 2050 — rents likely to lag national; underwrite the cash flow, not the appreciation.
Negotiation context
- It's been on market 231 days — a 12% lower offer ($95k) is reasonable based on typical stale-listing flexibility.
- 4 sale attempts since 23y ago; this cycle's ask has dropped $7k (6%) from the opening price — seller is motivated, your offer sets the floor, not the list.
- Current owner paid $34k; list at $108k implies a 218% gain — meaningful room to come down on a strong offer.
Risks & watch-outs
- Watch-outs: built in 1914 — expect roof / HVAC / electrical / plumbing capex.
Questions for the listing agent
- It's been on market 231 days. Have you received any prior offers? Is the seller open to a 12% concession, seller financing, or rate buy-down credit?
- Built in 1914 — when were the roof, HVAC, electrical panel, plumbing, and water heater last replaced?
- Why hasn't it sold? Are there any deal-killer items the seller is aware of (foundation, flood, title, zoning, code violations)?
- Is there a deadline driving the sale (1031 exchange, divorce, estate, relocation)? That informs how much negotiation room exists.
- Crime grade is F in this area — have there been break-ins, vandalism, or insurance claims at this property in the last 3 years? What carrier currently insures it and at what premium?
- What's the average days-on-market for RENTAL listings here right now (not sales)? A rising rental-DOM trend means longer vacancies and softer asking-rent achievability than the comps imply.
- What's the recent tenant-quality profile in this submarket — average credit score on applications, eviction rate, late-payment / NSF rate, and stable-employment percentage? A property-management company in the area should have these aggregated.
- How much new for-sale + rental construction is in the pipeline within 1–3 miles? Heavy new supply typically softens prices + rents 12–24 months out; constrained supply supports both.
Investment metrics
- 1% rule
- 1.17% ✓
- Cap rate
- 8.62%
- Cash-on-cash
- 8.31%
- DSCR
- 1.37
- GRM
- 7.1
CMA / ARV
- ARV (median comp)
- $116,310
- List price
- $108,000
- Delta
- -7.14%
- Verdict
- FAIR
- Comps
- 20 within 1.0 mi
Show comp detail 12 sales within ~0.75 mi
| Address | Dist | Beds/Ba | Sqft | Sold | Price | $/sf | Match |
|---|---|---|---|---|---|---|---|
| 322 Madison Ave | 0.34mi | 3/2.0 | 1,328 (-5%) | 1mo | $49,000 | $37 | 71 |
| 910 Bye St | 0.33mi | 4/1.0 (+1) | 1,457 (+5%) | 1mo | $102,000 | $70 | 71 |
| 968 Stadelman Ave | 0.30mi | 3/1.5 | 1,488 (+7%) | 2mo | $104,000 | $70 | 70 |
| 445 Beechwood Dr | 0.53mi | 3/1.0 | 1,498 (+8%) | 2mo | $142,850 | $95 | 61 |
| 580 Moreley Ave | 0.69mi | 3/1.5 | 1,425 (+2%) | 3mo | $160,000 | $112 | 59 |
| 817 Weber Ave | 0.68mi | 3/1.5 | 1,450 (+4%) | 1mo | $200,000 | $138 | 59 |
| 978 Delia Ave | 0.22mi | 2/1.5 (-1) | 1,199 (-14%) | 2mo | $42,500 | $35 | 58 |
| 378 Wildwood Ave | 0.40mi | 4/1.0 (+1) | 1,544 (+11%) | 4mo | $66,000 | $43 | 55 |
| 379 Noble Ave | 0.55mi | 3/1.0 | 1,224 (-12%) | 2mo | $90,000 | $74 | 52 |
| 555 Hoye Ave | 0.74mi | 4/1.0 (+1) | 1,505 (+8%) | 2mo | $15,500 | $10 | 46 |
| 557 Wildwood Ave | 0.74mi | 3/1.0 | 1,545 (+11%) | 2mo | $65,000 | $42 | 46 |
| 404 Noah Ave | 0.64mi | 3/1.0 | 1,192 (-14%) | 1mo | $77,500 | $65 | 45 |
Match score weights: distance 35% · size 25% · config 20% · recency 20%. Top-matched comps best support the ARV.
Projected returns pro-forma
-3.0% appreciation · 3.0% rent growth · sell at horizon
- IRR
- -3.6%
- Equity multiple
- 0.86×
- Total profit
- $-4,118
- Equity at exit
- $16,103
- IRR
- 6.1%
- Equity multiple
- 1.46×
- Total profit
- $13,778
- Equity at exit
- $9,338
Cash invested: $30,240 (down + closing). Projections, not guarantees.
Landlord ↔ Tenant lean methodology
- Overall (STATE)
- 73 Landlord-Friendly
- State Ohio
- 73 Landlord-Friendly · R+6
- County
- — inherits STATE
- City
- — inherits STATE
ZIP-level market 44302
- Active inventory
- 27
- Price-to-rent
- 7.1×
Monthly cashflow live
- Estimated rent
- $1,268 high interval (Pro) →
- Mortgage (P&I)
- −$566
- Tax from tax record
- −$181 /mo · $2,170/yr
- Insurance
- −$45
- HOA
- −$0
- Vacancy / Maint / Mgmt
- −$266
- Net cashflow
- $209
Break-even live
Sensitivity live
| Price | -10% $271 | -5% $240 | +0% $209 | +5% $179 | +10% $148 |
|---|---|---|---|---|---|
| Rent | -10% $109 | -5% $159 | +0% $209 | +5% $259 | +10% $310 |
| Rate | -1.0pp $264 | -0.5pp $237 | base $209 | +0.5pp $181 | +1.0pp $153 |
UW: 25.0% down · 7.5% · 30yr · 1.5% tax · 5.0% vac · 8.0% maint · 8.0% mgmt
Financing live
Cash to close
- Down payment
- $27,000
- Closing costs
- $3,240
- Reserves months
- —
- Total cash needed
- —
Loan-product check · same deal, 3 products live
Conventional
25% down · 7.5% · 30yr
- Down + closing
- —
- Monthly P&I
- —
- Monthly cashflow
- —
- DSCR
- —
- Eligible?
- —
Personal DTI + credit; lowest rate.
DSCR
20% down · 8.5% · 30yr
- Down + closing
- —
- Monthly P&I
- —
- Monthly cashflow
- —
- DSCR
- —
- Eligible?
- —
No personal income docs; deal must DSCR.
Hard money
10% down · 12.0% · 12mo
- Down + closing
- —
- Monthly P&I
- —
- Monthly cashflow
- —
- DSCR
- —
- Eligible?
- —
Short-term bridge; refi at stabilization.
Rent comps 40 comps
| Address | Beds | Baths | Sqft | Rent | $/sqft | DOM | Units | Dist |
|---|---|---|---|---|---|---|---|---|
| 900 W Market St Akron, OH | 2.0–3.0 | 1.5–2.0 | 1880 | $2,340 | $1.24 | 25d | 6 | 0.24mi |
| 80 Byers Ave Unit A Akron, OH | 2.0 | 1.0 | 900 | $995 | $1.11 | 45d | 1 | 0.34mi |
| 713 Crosby St Unit 1496092P Akron, OH | 3.0 | 2.0 | 1840 | $5,078 | $2.76 | 22d | 1 | 0.36mi |
| 918 Bye St Akron, OH | 3.0 | 1.0 | 1248 | $1,200 | $0.96 | 45d | 1 | 0.36mi |
| 80 N Portage Path Akron, OH | 2.0–3.0 | 2.0 | 1462 | $1,720 | $1.18 | 45d | 1 | 0.36mi |
| 724 Crosby St Akron, OH | 2.0 | 1.0 | 1582 | $995 | $0.63 | 25d | 1 | 0.37mi |
| 724 Crosby St Unit 1 Akron, OH | 2.0 | 1.0 | 1582 | $995 | $0.63 | 45d | 1 | 0.37mi |
| 1142 Jefferson Ave Unit 2 Akron, OH | 3.0 | 1.0 | 1200 | $1,150 | $0.96 | 45d | 1 | 0.39mi |
| 25 N Rose Blvd Unit 1496095P Akron, OH | 4.0 | 2.5 | 1603 | $9,078 | $5.66 | 22d | 1 | 0.40mi |
| 321 Grace Ave Akron, OH | 3.0 | 2.0 | 1484 | $1,175 | $0.79 | 15d | 1 | 0.40mi |
| 924 Hamlin St Akron, OH | 3.0 | 1.0 | 1106 | $1,300 | $1.18 | 45d | 1 | 0.42mi |
| 295 Noble Ave Akron, OH | 3.0 | 2.5 | 1488 | $1,600 | $1.08 | 45d | 1 | 0.43mi |
| 378 Wildwood Ave Akron, OH | 4.0 | 1.0 | 1544 | $1,200 | $0.78 | 45d | 1 | 0.43mi |
| 678 Crosby St Unit 3 Akron, OH | 2.0 | 1.0 | 1000 | $780 | $0.78 | 45d | 1 | 0.44mi |
| 115 N Portage Path Unit 6 Akron, OH | 2.0 | 1.0 | 1200 | $1,195 | $1.00 | 45d | 1 | 0.46mi |
| 916 Peckham St Akron, OH | 2.0 | 1.0 | 936 | $850 | $0.91 | 45d | 1 | 0.47mi |
| 627 Crosby St Unit B Akron, OH | 4.0 | 1.0 | 1200 | $875 | $0.73 | 45d | 1 | 0.51mi |
| 199 Beck Ave Unit 2 Akron, OH | 2.0 | 1.0 | 926 | $1,300 | $1.40 | 25d | 1 | 0.54mi |
| 405 Noah Ave Akron, OH | 2.0 | 1.0 | 1000 | $1,050 | $1.05 | 22d | 1 | 0.64mi |
| 218 Twin Oaks Rd Unit 222-16 Akron, OH | 3.0 | 2.0 | 1400 | $1,500 | $1.07 | 45d | 1 | 0.65mi |
| 218 Twin Oaks Rd Unit 222-05 Akron, OH | 2.0 | 1.0 | 1100 | $1,150 | $1.05 | 45d | 1 | 0.66mi |
| 91 Westwood Ave Akron, OH | 3.0 | 1.0 | 1631 | $1,450 | $0.89 | 15d | 1 | 0.70mi |
| 637 Storer Ave Akron, OH | 3.0 | 1.5 | 1322 | $1,250 | $0.95 | 15d | 1 | 0.75mi |
| 601 Glendora Ave Akron, OH | 3.0 | 1.0 | 1310 | $1,200 | $0.92 | 45d | 1 | 0.75mi |
| 53 S Balch St Unit 55 Akron, OH | 2.0 | 1.0 | 1500 | $850 | $0.57 | 15d | 1 | 0.76mi |
| 55 S Balch St Unit A Akron, OH | 2.0 | 1.0 | 1500 | $800 | $0.53 | 25d | 1 | 0.77mi |
| 202 Westwood Ave Akron, OH | 3.0 | 1.0 | 1344 | $1,250 | $0.93 | 15d | 1 | 0.77mi |
| 502 Evelyn Ct Akron, OH | 2.0 | 1.0 | 900 | $950 | $1.06 | 45d | 1 | 0.77mi |
| 152 S Balch St Akron, OH | 3.0 | 1.5 | 1000 | $1,195 | $1.20 | 45d | 1 | 0.77mi |
| 378 Trigonia Dr Akron, OH | 3.0 | 1.5 | 1090 | $1,200 | $1.10 | 45d | 1 | 0.77mi |
| 677 Crossings Ln Akron, OH | 3.0 | 2.5 | 1440 | $1,950 | $1.35 | 25d | 1 | 0.82mi |
| 39 N Balch St Akron, OH | 4.0 | 1.0 | 1000 | $995 | $0.99 | 45d | 1 | 0.83mi |
| 45 Oakdale Ave Unit A Akron, OH | 2.0 | 1.0 | 1000 | $875 | $0.88 | 25d | 1 | 0.83mi |
| 45 Oakdale Ave Akron, OH | 2.0 | 1.0 | 1000 | $900 | $0.90 | 15d | 1 | 0.83mi |
| 445 S Maple St Akron, OH | 3.0 | 1.5 | 1041 | $1,240 | $1.19 | 45d | 7 | 0.87mi |
| 575 Noble Ave Akron, OH | 3.0 | 1.0 | 1300 | $1,350 | $1.04 | 15d | 1 | 0.89mi |
| 844 Lawton St Akron, OH | 4.0 | 2.0 | 1240 | $1,175 | $0.95 | 45d | 1 | 1.02mi |
| 311 Crestwood Ave Akron, OH | 4.0 | 2.0 | 1800 | $1,395 | $0.78 | 45d | 1 | 1.04mi |
| 961 Lawton St Akron, OH | 3.0 | 1.0 | 1144 | $1,450 | $1.27 | 15d | 1 | 1.06mi |
| 730 Noble Ave Akron, OH | 3.0 | 1.0 | 1092 | $1,200 | $1.10 | 25d | 1 | 1.18mi |
Listing history 28 events
-
2026-06-21days on market $108,000 Active 231 DOM
-
2026-06-18days on market $108,000 Active 228 DOM
-
2026-06-17days on market $108,000 Active 227 DOM
-
2026-06-16days on market $108,000 Active 226 DOM
-
2026-06-15days on market $108,000 Active 225 DOM
-
2026-06-14days on market $108,000 Active 223 DOM
-
2026-06-13days on market $108,000 Active 222 DOM
-
2026-06-10days on market $108,000 Active 220 DOM
-
2026-06-09days on market $108,000 Active 219 DOM
-
2026-06-08days on market $108,000 Active 218 DOM
-
2026-06-07days on market $108,000 Active 217 DOM
-
2026-06-05days on market $108,000 Active 214 DOM
-
2026-06-03days on market $108,000 Active 213 DOM
-
2026-06-02days on market $108,000 Active 212 DOM
-
2026-06-01days on market $108,000 Active 211 DOM
-
2026-05-31days on market $108,000 Active 210 DOM
-
2026-05-31days on market $108,000 Active 209 DOM
-
2026-03-31status Active 551-char remark
Show marketing remark (551 chars)
Attention Investors!! Expand your portfolio with this well maintained, single-family home located in Akron's Highland Square Neighborhood. This property is occupied, providing immediate cashflow. It is currently generating $1,000 per month in rental income, and offers great value-add potential. This unit is leased through 4/30/2026, by long term tenants. This property presents a great opportunity to add a stable, income-producing property to your portfolio, with potential to increase income and build long term equity in an attractive location.
-
2026-03-26historical 551-char remark
Show marketing remark (551 chars)
Attention Investors!! Expand your portfolio with this well maintained, single-family home located in Akron's Highland Square Neighborhood. This property is occupied, providing immediate cashflow. It is currently generating $1,000 per month in rental income, and offers great value-add potential. This unit is leased through 4/30/2026, by long term tenants. This property presents a great opportunity to add a stable, income-producing property to your portfolio, with potential to increase income and build long term equity in an attractive location.
-
2026-03-19price $108,000 551-char remark
Show marketing remark (551 chars)
Attention Investors!! Expand your portfolio with this well maintained, single-family home located in Akron's Highland Square Neighborhood. This property is occupied, providing immediate cashflow. It is currently generating $1,000 per month in rental income, and offers great value-add potential. This unit is leased through 4/30/2026, by long term tenants. This property presents a great opportunity to add a stable, income-producing property to your portfolio, with potential to increase income and build long term equity in an attractive location.
-
2025-10-03$115,000 Active 551-char remark
Show marketing remark (551 chars)
Attention Investors!! Expand your portfolio with this well maintained, single-family home located in Akron's Highland Square Neighborhood. This property is occupied, providing immediate cashflow. It is currently generating $1,000 per month in rental income, and offers great value-add potential. This unit is leased through 4/30/2026, by long term tenants. This property presents a great opportunity to add a stable, income-producing property to your portfolio, with potential to increase income and build long term equity in an attractive location.
-
2005-06-03historical
-
2004-05-03$79,900
-
2004-04-10historical
-
2003-04-10$79,900
-
1998-03-03soldstatus $34,000
-
1989-12-06soldstatus $10,600
-
1987-11-16soldstatus $20,000
ⓘ Source: listings_history table (triggers on properties + properties_extension) + one-shot
backfill from property_details.listing_events for pre-trigger history.
Tax reassessment forecast OH · Partial reset (capped growth)
- Current annual tax
- $2,170 · $181/mo
- Projected year-2 tax
- $2,170 · $181/mo
- Expected delta
- $0/yr ($0/mo · 0.0%)
ⓘ Screening estimate from a state-policy table — verify with the county assessor before closing.
Climate risk First Street
- Flood 1/10 Low FEMA zone X (unshaded) · 0% chance over 30 yrs
- Wildfire 1/10 Low
- Heat 3/10 Moderate 7 d/yr ≥97°F today · 16 d/yr by 30 yrs out
- Wind 1/10 Low
- Air quality 3/10 Moderate 2 unhealthy d/yr today · 4 by 30 yrs out
Nearby sold comps map
Loading sold comps map…
Walkable amenities ~0.75 mi
Loading nearby amenities…
Taxation est. · year 1
- Rental income
- $15,214
- − Mortgage interest
- −$6,050
- − Property taxes
- −$2,170
- − Insurance
- −$540
- − Repairs & maintenance
- −$1,217
- − Management
- −$1,217
- − Depreciation
- −$3,142
- Taxable income
- $878
- Est. tax owed @ 24.0%
- −$211
- After-tax cash flow
- $2,302/yr
For passive investors: Depreciation is non-cash, so a rental often shows a tax loss while cash-flowing — sheltering income. Rental losses are passive: they offset passive income freely, and up to $25,000/yr can offset ordinary (W-2) income if you actively participate and your MAGI is under $100k (phasing out to $0 by $150k); unused losses carry forward. On sale, claimed depreciation is recaptured at up to 25%, and gains may owe capital-gains tax (a 1031 exchange can defer both). Figures are a year-1 estimate at your 24.0% rate — not tax advice; consult a CPA.
Schools (NCES district)
- District
- Akron City
- NCES district ID
- 3904348
- Math proficiency
- 22% ▼ -17.00%
- Reading proficiency
- 30% ▼ -12.00%
- Median HH income
- $33,811
- Composite
- 21.31/100
- National rank
- #8383
- State rank
- #602 of 656 in OH
Livability — Akron
- Score
- 81/100
- State rank
- #104
- US rank
- #1591
Category grades
Schools grade is shown separately in the Schools card above.
Census & demographics
- Census place
- Akron, OH
- County
- Summit County · 440,783 people
- City population
- 174,375
- Metro
- Akron, OH
- Population (ZIP)
- 5,474
- Household income
- $42,400
- Rent vs Own
- Severe rent burden
- 372.0
Population outlook (Summit County) Hauer SSP2
- Today (2025)
- 546,583 people
- By 2030
- 544,028 · -0.5%
- By 2040
- 531,363 · -2.8%
- By 2050
- 514,923 · -5.8%
- By 2075
- 481,765 · -11.9%
- By 2100
- 432,265 · -20.9%
Race, ethnicity, and origin ACS 2023
- Neighborhood character
- Diverse neighborhood (Simpson 0.62)
- Race & ethnicity
- White 51% Black 34% Two or more races 8% Asian 4% Hispanic / Latino 2%
- Common ancestry
- Slovak 6% Romanian 3% Lithuanian 2%
- Foreign-born
- 7% · India, Canada
- Languages at home
- 95% English-only · German/W. Germanic 2% Spanish 1% Other Indo-European 1%
Political lean MEDSL · Summit
- 2024 margin
- Lean D (+7.0) · D 53.0% · R 46.0%
- 2008→2024 swing
- -9.6pp toward R · 2008: 16.6pp · 2024: 7.0pp
- All cycles
- 2024: D+7.0 2020: D+9.6 2016: D+8.2 2012: D+14.8 2008: D+16.6
Not yet ingested
- Civics
- —
Market trends
- HPI YoY
- ▼ -127.53%
- Current HPI
- 209.7327
- Rent YoY
- —
- Metro
- Akron, OH
- State GDP YoY
- ▲ 1.98%
- F500 in state
- 48
Industry mix (Fortune 500 HQ in OH)
| Industry | F500 HQs | Revenue |
|---|---|---|
| Insurance | 3 | $145B |
|
||
| Industrial Machinery | 3 | $49B |
|
||
| Financial Services | 3 | $24B |
|
||
| Consumer Goods | 2 | $93B |
|
||
| Aerospace / Defense | 2 | $47B |
|
||
| Utilities | 2 | $33B |
|
||
Price history
+440.0% since first listed11 events — show timeline
- 2026-03-31 Relisted — MLSNOW
- 2026-03-26 Listing Removed — MLSNOW
- 2026-03-19 Price Changed $108,000 MLSNOW
- 2025-10-03 Listed $115,000 MLSNOW
- 2005-06-03 Listing Removed — MLSNOW
- 2004-05-03 Listed $79,900 MLSNOW
- 2004-04-10 Listing Removed — MLSNOW
- 2003-04-10 Listed $79,900 MLSNOW
- 1998-03-03 Sold (Public Records) $34,000 Public Records
- 1989-12-06 Sold (Public Records) $10,600 Public Records
- 1987-11-16 Sold (Public Records) $20,000 Public Records
Property tax history
+2.4%/yrLatest (2025): $2,170 · -43.9% YoY. Source: county tax records.
Cash-flow waterfall
monthlySold comps — $/sqft
last 12 mo · ≤1 miLoading sold comps…