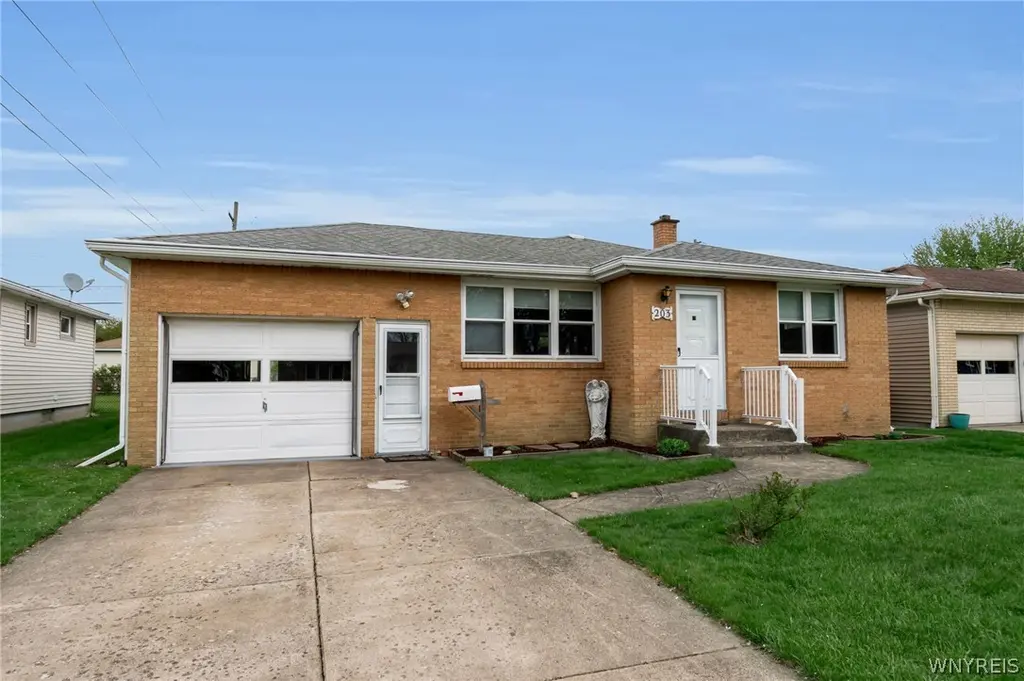
203 Lou Ann Dr · Cheektowaga, NY
Flood risk 1/10 · Minimal
- FEMA flood zone
- X (unshaded)
- Chance of flooding over 30 yrs
- 0.0%
- Est. flood insurance / yr
- $473 – $860
Fire risk 1/10 · Minimal
- Est. fire insurance / yr
- $691 – $1,283
Heat risk 3/10 · Minor
- Hot days now (above 92°F)
- 7 days/yr
- Hot days in 30 yrs
- 15 days/yr
Wind risk 1/10 · Minimal
- Chance of severe wind over 30 yrs
- —
Air-quality risk 3/10 · Minor
- Unhealthy air days now
- 2 days/yr
- Unhealthy air days in 30 yrs
- 3 days/yr
Risk factors via First Street. Map © Google.
Why this score? — see what drove the D grade
The composite is a weighted blend of 9 inputs, each scored 0–100. Each bar is that input's sub-score; the figure is the points it added to the 100-point composite (weight × sub-score).
- ARV discount +15.0/15.0
- Cash flow +7.6/30.0
- Schools +5.2/10.0
- Livability +4.2/5.0
- Rent growth +3.9/5.0
- 1% rule +2.7/10.0
- Condition / age +2.5/5.0
- DSCR +1.7/10.0
- Appreciation +0.0/10.0
$219,900
🖨 Deal sheet (PDF) 📄 Offer letter ✓ Due diligence
Listing remarks MLS
If you have vision and are a little handy then this may be the house for you! Two bdrm ranch with large living rm and large kitchen! Needs your TLC. Great yard with two sheds and a closed in patio off the garage! Nice street and close to shopping!
Key facts
- Attached garage
- Remodeled kitchen
- Full basement
Tags
Property features AI
Exterior
- Parking: Attached garage with electricity (1 car)
- Utilities: Public water (connected); Sewer connected; Electric with circuit breakers
- Home design: Single-story house; Existing construction
- Construction: Brick and vinyl siding exterior; Asphalt roof; Poured foundation; Built (existing)
- Exterior features: Concrete driveway; Fully fenced yard; Rectangular residential lot; City street frontage
Interior
- Kitchen: Dishwasher; Gas oven; Gas range; Refrigerator
- Bedrooms: Two main-level bedrooms
- Flooring: Carpet; Luxury vinyl; Varied flooring
- Bathrooms: One full bathroom (main level)
- Heating & cooling: Gas heating; Baseboard heating; Central air conditioning
- Interior features: Eat-in kitchen; Separate/formal living room; Main-level primary bedroom; Sunroom / Florida room; Full basement
- Laundry & utility: Laundry in basement; Gas water heater
Neighborhood map
What this means for you Summary
Snapshot
- This is a 2-bed/1.0-bath single-family listed at $220k.
Deal economics
- At list price, monthly cash flow is $-261 ($-3k/yr) — negative.
- To cash-flow at today's rent, offer at most $174k (21.0% below list).
- To meet the 1% rule (rent ≥ 1% of price), the offer needs to be $169k (23.0% below list).
- Recommended offer: $169k (23.0% below list) — sets the bar for 1% rule.
- Cap rate 4.9% vs local median 3.8% in Cheektowaga — meaningfully above typical; check what's discounted (condition, days-on-market, listing class) to confirm the premium yield is real.
Location & tenants
- Location reads 84/100 on livability (#54 in NY, #811 nationally) — a professional / high-income tenant draw. Strengths: commute A+, housing A+, health & safety A+; Watch: crime C-.
- Lancaster Central School District (suburban): math 57% / reading 61% proficiency, ranked #234 of 590 in NY (top 40%) — acceptable for families but not a draw, mixed tenant base, ~2y average lease; only 14% free/reduced lunch — higher-income household profile.
- Zoned schools: Lancaster High School (math 97% / reading 92%, grade A+, #117 of 1,100 statewide, top 11%, 1,652 students, 24% FRL).
- Zoned-school proficiency averages 94% at this address vs 59% district-wide (+36 pts) — the actual schools serving this property are materially stronger than the Lancaster Central School District average implies; a family-tenant draw the district grade alone would hide.
- Market conditions: Rents rising fast (+5.8%/yr); 124 active listings in the ZIP; 4 comparable units currently listed for rent nearby; rentals lingering (median 46d on market — plan ~5-8 weeks vacancy on turnover, expect pricing pressure); 50% of comp listings sitting > 30 days — soft ceiling on asking rent; 1,244 units permitted in Erie County in 2024 (563 in 5+ unit buildings).
Forward outlook
- Local home prices are declining (-3.0%/yr); year-one equity from $2k of loan paydown is wiped out by about $7k of value loss. Plan a longer hold.
Negotiation context
- Only 8 days on market — expect competitive offers; lowballing is unlikely to land.
- 2 sale attempts since 14y ago with the ask held roughly flat each time — persistent listings suggest the price (not the market) is what's stuck; bring a comps-based counter.
- Current owner paid $82k; list at $220k implies a 168% gain — meaningful room to come down on a strong offer.
Questions for the listing agent
- What do current leases actually rent for vs. the listed asking? Can we see a recent rent roll and the last 12 months of T-12 income?
- Built in 1964 — when were the roof, HVAC, electrical panel, plumbing, and water heater last replaced?
- Is there a deadline driving the sale (1031 exchange, divorce, estate, relocation)? That informs how much negotiation room exists.
- Schools are B-rated — typically a magnet for longer-tenancy family renters. What's the average tenant stay here, and is there a school-zone premium baked into asking?
- The area grade is low — what's the realistic commute time and amenity access for the typical tenant pool here? Any planned neighborhood developments (good or bad) we should know about?
- What's the average days-on-market for RENTAL listings here right now (not sales)? A rising rental-DOM trend means longer vacancies and softer asking-rent achievability than the comps imply.
- What's the recent tenant-quality profile in this submarket — average credit score on applications, eviction rate, late-payment / NSF rate, and stable-employment percentage? A property-management company in the area should have these aggregated.
- How much new for-sale + rental construction is in the pipeline within 1–3 miles? Heavy new supply typically softens prices + rents 12–24 months out; constrained supply supports both.
Investment metrics
- 1% rule
- 0.77% ✗
- Cap rate
- 4.87%
- Cash-on-cash
- -5.08%
- DSCR
- 0.77
- GRM
- 10.8
CMA / ARV
- ARV (median comp)
- $284,158
- List price
- $219,900
- Delta
- -22.61%
- Verdict
- UNDERPRICED
- Comps
- 20 within 1.0 mi
Show comp detail 12 sales within ~0.75 mi
| Address | Dist | Beds/Ba | Sqft | Sold | Price | $/sf | Match |
|---|---|---|---|---|---|---|---|
| 185 Dean Rd | 0.22mi | 3/1.0 (+1) | 984 (-2%) | 0mo | $275,000 | $279 | 81 |
| 208 Poinciana Pkwy | 0.23mi | 3/1.0 (+1) | 988 (-2%) | 1mo | $239,900 | $243 | 80 |
| 21 Royal Palm Dr | 0.16mi | 3/1.5 (+1) | 1,040 (+3%) | 5mo | $186,100 | $179 | 76 |
| 244 Hyland Ave | 0.21mi | 3/1.5 (+1) | 1,064 (+6%) | 2mo | $145,000 | $136 | 72 |
| 204 Diane Dr | 0.24mi | 3/1.0 (+1) | 1,076 (+7%) | 5mo | $215,000 | $200 | 68 |
| 85 Poinciana Pkwy | 0.56mi | 3/1.0 (+1) | 1,041 (+4%) | 2mo | $270,000 | $259 | 62 |
| 47 Temple Dr | 0.67mi | 3/1.0 (+1) | 1,040 (+3%) | 2mo | $225,000 | $216 | 56 |
| 59 Crandon Blvd | 0.63mi | 3/1.5 (+1) | 1,062 (+6%) | 5mo | $260,000 | $245 | 50 |
| 96 Green Ter | 0.66mi | 3/1.0 (+1) | 1,080 (+7%) | 3mo | $255,000 | $236 | 49 |
| 70 Crandon Blvd | 0.60mi | 3/1.0 (+1) | 1,134 (+13%) | 3mo | $295,000 | $260 | 43 |
| 114 Norman Dr | 0.70mi | 3/2.0 (+1) | 1,092 (+8%) | 1mo | $290,000 | $266 | 43 |
| 50 Mary Lou Ln | 0.65mi | 2/1.0 | 1,144 (+14%) | 5mo | $210,000 | $184 | 43 |
Match score weights: distance 35% · size 25% · config 20% · recency 20%. Top-matched comps best support the ARV.
Projected returns pro-forma
-3.0% appreciation · 5.75% rent growth · sell at horizon
- IRR
- -21.7%
- Equity multiple
- 0.23×
- Total profit
- $-47,364
- Equity at exit
- $32,788
- IRR
- -9.8%
- Equity multiple
- 0.33×
- Total profit
- $-41,447
- Equity at exit
- $19,013
Cash invested: $61,572 (down + closing). Projections, not guarantees.
Landlord ↔ Tenant lean methodology
- Overall (STATE)
- 15 Strongly Tenant-Friendly
- State New York
- 15 Strongly Tenant-Friendly · D+10
- County
- — inherits STATE
- City
- — inherits STATE
ZIP-level market 14043
- Home prices YoY
- -34.2%
- Rents YoY
- 5.8%
- Active inventory
- 124
- Price-to-rent
- 10.8×
Monthly cashflow live
- Estimated rent
- $1,693 medium interval (Pro) →
- Mortgage (P&I)
- −$1,153
- Tax from tax record
- −$353 /mo · $4,240/yr
- Insurance
- −$92
- HOA
- −$0
- Vacancy / Maint / Mgmt
- −$355
- Net cashflow
- $-261
Break-even live
Sensitivity live
| Price | -10% $-136 | -5% $-199 | +0% $-261 | +5% $-323 | +10% $-385 |
|---|---|---|---|---|---|
| Rent | -10% $-395 | -5% $-328 | +0% $-261 | +5% $-194 | +10% $-127 |
| Rate | -1.0pp $-150 | -0.5pp $-205 | base $-261 | +0.5pp $-318 | +1.0pp $-376 |
UW: 25.0% down · 7.5% · 30yr · 1.5% tax · 5.0% vac · 8.0% maint · 8.0% mgmt
Financing live
Cash to close
- Down payment
- $54,975
- Closing costs
- $6,597
- Reserves months
- —
- Total cash needed
- —
Loan-product check · same deal, 3 products live
Conventional
25% down · 7.5% · 30yr
- Down + closing
- —
- Monthly P&I
- —
- Monthly cashflow
- —
- DSCR
- —
- Eligible?
- —
Personal DTI + credit; lowest rate.
DSCR
20% down · 8.5% · 30yr
- Down + closing
- —
- Monthly P&I
- —
- Monthly cashflow
- —
- DSCR
- —
- Eligible?
- —
No personal income docs; deal must DSCR.
Hard money
10% down · 12.0% · 12mo
- Down + closing
- —
- Monthly P&I
- —
- Monthly cashflow
- —
- DSCR
- —
- Eligible?
- —
Short-term bridge; refi at stabilization.
Rent comps 4 comps
| Address | Beds | Baths | Sqft | Rent | $/sqft | DOM | Units | Dist |
|---|---|---|---|---|---|---|---|---|
| 176 Meadowlawn Rd Buffalo, NY | 2.0 | 1.0 | 1100 | $900 | $0.82 | 45d | 1 | 0.55mi |
| 4925 Genesee St Cheektowaga, NY | 1.0–2.0 | 1.0 | 680 | $1,399 | $2.06 | 21d | 1 | 1.15mi |
| 6386 Transit Rd Depew, NY | 1.0–2.0 | 1.0–2.0 | 1023 | $2,397 | $2.34 | 3d | 62 | 1.35mi |
| 1175 George Urban Blvd Buffalo, NY | 1.0–2.0 | 1.0 | 725 | $1,365 | $1.88 | 45d | 1 | 1.49mi |
Listing history 7 events
-
2026-05-12$219,900 Active 1305-char remark
-
2018-08-24soldstatus $82,000
-
2017-12-29soldstatus $82,000
-
2017-10-24soldstatus $82,000
-
2012-12-21soldstatus $62,000 247-char remark
Show marketing remark (247 chars)
If you have vision and are a little handy then this may be the house for you! Two bdrm ranch with large living rm and large kitchen! Needs your TLC. Great yard with two sheds and a closed in patio off the garage! Nice street and close to shopping!
-
2012-12-17soldstatus $62,000
-
2012-09-05$84,900 247-char remark
Show marketing remark (247 chars)
If you have vision and are a little handy then this may be the house for you! Two bdrm ranch with large living rm and large kitchen! Needs your TLC. Great yard with two sheds and a closed in patio off the garage! Nice street and close to shopping!
ⓘ Source: listings_history table (triggers on properties + properties_extension) + one-shot
backfill from property_details.listing_events for pre-trigger history.
Tax reassessment forecast NY · Partial reset (capped growth)
- Current annual tax
- $4,240 · $353/mo
- Projected year-2 tax
- $4,240 · $353/mo
- Expected delta
- $0/yr ($0/mo · 0.0%)
ⓘ Screening estimate from a state-policy table — verify with the county assessor before closing.
Climate risk First Street
- Flood 1/10 Low FEMA zone X (unshaded) · 0% chance over 30 yrs
- Wildfire 1/10 Low
- Heat 3/10 Moderate 7 d/yr ≥92°F today · 15 d/yr by 30 yrs out
- Wind 1/10 Low
- Air quality 3/10 Moderate 2 unhealthy d/yr today · 3 by 30 yrs out
Nearby sold comps map
Loading sold comps map…
Walkable amenities ~0.75 mi
Loading nearby amenities…
Taxation est. · year 1
- Rental income
- $20,312
- − Mortgage interest
- −$12,318
- − Property taxes
- −$4,240
- − Insurance
- −$1,100
- − Repairs & maintenance
- −$1,625
- − Management
- −$1,625
- − Depreciation
- −$6,397
- Taxable loss
- −$6,992
- Est. tax savings @ 24.0%
- +$1,678
- After-tax cash flow
- $-1,453/yr
For passive investors: Depreciation is non-cash, so a rental often shows a tax loss while cash-flowing — sheltering income. Rental losses are passive: they offset passive income freely, and up to $25,000/yr can offset ordinary (W-2) income if you actively participate and your MAGI is under $100k (phasing out to $0 by $150k); unused losses carry forward. On sale, claimed depreciation is recaptured at up to 25%, and gains may owe capital-gains tax (a 1031 exchange can defer both). Figures are a year-1 estimate at your 24.0% rate — not tax advice; consult a CPA.
Schools (NCES district)
- District
- Lancaster Central School District
- NCES district ID
- 3616680
- Math proficiency
- 57% ▼ -13.00%
- Reading proficiency
- 61% ▲ 2.00%
- Median HH income
- $64,668
- Composite
- 51.64/100
- National rank
- #1700
- State rank
- #234 of 590 in NY
Livability — Cheektowaga
- Score
- 84/100
- State rank
- #54
- US rank
- #811
Category grades
Schools grade is shown separately in the Schools card above.
Census & demographics
- Census place
- Cheektowaga, NY
- County
- Erie County · 714,559 people
- City population
- 55,470
- Metro
- Buffalo-Cheektowaga, NY
- Population (ZIP)
- 25,098
- Household income
- $74,112
- Rent vs Own
- Severe rent burden
- 854.0
Population outlook (Erie County) Hauer SSP2
- Today (2025)
- 933,037 people
- By 2030
- 935,181 · +0.2%
- By 2040
- 928,531 · -0.5%
- By 2050
- 905,725 · -2.9%
- By 2075
- 834,037 · -10.6%
- By 2100
- 708,033 · -24.1%
Race, ethnicity, and origin ACS 2023
- Neighborhood character
- Predominantly White (91%)
- Race & ethnicity
- White 91% Hispanic / Latino 3% Two or more races 3% Black 2% Asian 1%
- Common ancestry
- Romanian 30% Lithuanian 2% Slovak 2%
- Foreign-born
- 4% · Canada, China
- Languages at home
- 91% English-only · Arabic 3% Russian/Polish/Slavic 2% Spanish 1%
Political lean MEDSL · Erie
- 2024 margin
- Lean D (+9.7) · D 54.8% · R 45.2%
- 2008→2024 swing
- -7.9pp toward R · 2008: 17.5pp · 2024: 9.7pp
- All cycles
- 2024: D+9.7 2020: D+14.7 2016: D+4.8 2012: D+15.6 2008: D+17.5
Not yet ingested
- Civics
- —
Market trends
- HPI YoY
- ▼ -152.13%
- Current HPI
- 292.1082
- Rent YoY
- ▲ 5.75%
- Metro
- Buffalo-Cheektowaga, NY
- State GDP YoY
- ▲ 2.60%
- F500 in state
- 92
Industry mix (Fortune 500 HQ in NY)
| Industry | F500 HQs | Revenue |
|---|---|---|
| Financial Services | 10 | $950B |
|
||
| Consumer Goods | 9 | $162B |
|
||
| Insurance | 4 | $225B |
|
||
| Telecommunications | 2 | $144B |
|
||
| Pharmaceuticals | 2 | $112B |
|
||
| Media / Entertainment | 2 | $69B |
|
||
Price history
+159.0% since first listed8 events — show timeline
- 2026-05-20 Pending — WNYREIS
- 2026-05-12 Listed $219,900 WNYREIS
- 2018-08-24 Sold (Public Records) $82,000 Public Records
- 2017-12-29 Sold (Public Records) $82,000 Public Records
- 2017-10-24 Sold (Public Records) $82,000 Public Records
- 2012-12-21 Sold (MLS) $62,000 WNYREIS
- 2012-12-17 Sold (Public Records) $62,000 Public Records
- 2012-09-05 Listed $84,900 WNYREIS
Property tax history
+7.8%/yrLatest (2025): $4,240 · -0.4% YoY. Source: county tax records.
Cash-flow waterfall
monthlySold comps — $/sqft
last 12 mo · ≤1 miLoading sold comps…