 Multi-family
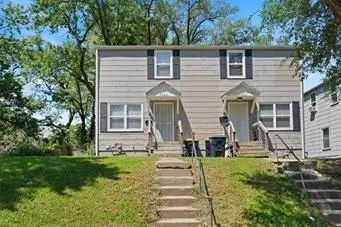
5520 Wabash Ave · Kansas City, MO
Flood risk No data
- FEMA flood zone
- —
- Chance of flooding over 30 yrs
- —
- Est. flood insurance / yr
- —
Fire risk No data
- Est. fire insurance / yr
- —
Heat risk No data
- Hot days now (above threshold)
- —
- Hot days in 30 yrs
- —
Wind risk No data
- Chance of severe wind over 30 yrs
- —
Air-quality risk No data
- Unhealthy air days now
- —
- Unhealthy air days in 30 yrs
- —
Risk factors via First Street. Map © Google.
Why this score? — see what drove the C+ grade
The composite is a weighted blend of 9 inputs, each scored 0–100. Each bar is that input's sub-score; the figure is the points it added to the 100-point composite (weight × sub-score).
- Cash flow +26.8/30.0
- DSCR +9.2/10.0
- ARV discount +7.5/15.0
- 1% rule +7.2/10.0
- Livability +3.9/5.0
- Rent growth +3.6/5.0
- Schools +1.5/10.0
- Condition / age +1.0/5.0
- Appreciation +0.0/10.0
$225,000
🖨 Deal sheet 📄 Offer letter ✓ Due diligence
Multi-family units
County records classify this as Multi-Family (2-4 Unit). Listing-text estimate: 1 unit. estimate disagrees with records
Listing remarks MLS
Discover the perfect blend of comfort, versatility, and long-term value with this charming side-by-side duplex in a steadily appreciating area. Whether you’re looking to expand your investment portfolio or live in one unit while generating passive income from the other, this property offers endless potential. Each unit features its own private entrance and spacious layout, making it ideal for multi-generational living, short- or long-term rentals, or house hacking. Don’t miss your chance to own a solid asset in a thriving neighborhood—opportunities like this don’t come often!
Key facts
- 6,573 sq ft lot
- Built 1957
- Listed 10 days
Property features AI
Finance
- Other: Over 95% current occupancy; Total of 2 units
- Financial info: Gross income reported at $2,500; Operating expenses include insurance, personal property tax, and other items
Exterior
- Parking: On-street parking
- Utilities: Public water; Public sewer; Other utilities
- Home design: Duplex residential income property; 2 stories
- Construction: Wood siding; Composition roof
- Exterior features: Lot ~6,573 square feet (public records)
Interior
- Kitchen: Dishwasher; Disposal; Microwave; Refrigerator; Electric range
- Bedrooms: 2-bedroom units
- Bathrooms: One bathroom in each unit
- Heating & cooling: Natural gas heating; Electric cooling; Has cooling
- Interior features: Dishwasher; Disposal; Dryer; Microwave; Refrigerator; Electric range; Washer; Has basement
- Laundry & utility: Washer and dryer in each unit; Laundry located in basement
Neighborhood map
What this means for you Summary
Snapshot
- This is a 6-bed/3.0-bath multifamily listed at $225k. Condition is rated poor.
Deal economics
- At list price, monthly cash flow is $615 ($7k/yr) — positive.
- The deal already cash-flows at list — no discount required.
- Meets the 1% rule at list price ($3k rent vs $225k).
- Cap rate 9.6% vs local median 3.9% in Kansas City — top-decile yield for the area; either an underpriced asset or a hidden risk that comps aren't pricing in. Stress-test before assuming the spread holds.
Location & tenants
- Location reads 78/100 on livability (#28 in MO, #2,671 nationally) — a middle-class / working-renter tenant base. Strengths: amenities A+, commute A+, cost of living A+; Watch: schools C-, crime F.
- Kansas City 33 (urban): math 12% / reading 24% proficiency, ranked #308 of 324 in MO (top 95%) — low school quality limits family demand, transient renter base, plan for 1-2y turnover; 75% free/reduced lunch — lower-income household profile, screen leases tightly.
- Market conditions: Rents rising fast (+4.4%/yr); 187 active listings in the ZIP; 1 comparable units currently listed for rent nearby; lower-income renter base — watch delinquency; 4,002 units permitted in Jackson County in 2024 (2,271 in 5+ unit buildings).
- At $2,747/mo this rent would consume 78% of the median local household income ($42k/yr) (locally 1132% of renters already pay >50% of income on rent) — very limited rent-growth headroom before tenants either downsize or default.
Forward outlook
- Local home prices are declining (-3.0%/yr); year-one equity from $2k of loan paydown is wiped out by about $7k of value loss. Plan a longer hold.
- Jackson County population projected at +4% by 2050 — modest demand growth; plan on rents tracking national, not racing it.
- At projected returns (-3.0% appreciation + 4.4% rent growth), your $63k cash investment doubles in ~9 years — after that, you're playing with house money.
Negotiation context
- Only 11 days on market — expect competitive offers; lowballing is unlikely to land.
- 3 sale attempts; this cycle's ask is 18650% above the opening price — seller raised mid-cycle; expect resistance to lowballs.
Risks & watch-outs
- Watch-outs: built in 1957 — expect roof / HVAC / electrical / plumbing capex.
Questions for the listing agent
- Have any recent inspections been done? Can we get a copy of the seller's disclosures and any deferred-maintenance estimates?
- Built in 1957 — when were the roof, HVAC, electrical panel, plumbing, and water heater last replaced?
- Is there a deadline driving the sale (1031 exchange, divorce, estate, relocation)? That informs how much negotiation room exists.
- Crime grade is F in this area — have there been break-ins, vandalism, or insurance claims at this property in the last 3 years? What carrier currently insures it and at what premium?
- What's the average days-on-market for RENTAL listings here right now (not sales)? A rising rental-DOM trend means longer vacancies and softer asking-rent achievability than the comps imply.
- What's the recent tenant-quality profile in this submarket — average credit score on applications, eviction rate, late-payment / NSF rate, and stable-employment percentage? A property-management company in the area should have these aggregated.
- How much new apartment / multifamily construction is in the pipeline within 1–3 miles? Heavy new supply (>2% of stock underway) typically softens rents 12–24 months out; light construction supports rent growth.
Investment metrics
- 1% rule
- 1.22% ✓
- Cap rate
- 9.57%
- Cash-on-cash
- 11.72%
- DSCR
- 1.52
- GRM
- 6.8
CMA / ARV
No comps found within radius.
Show comp detail 3 sales within ~0.75 mi
| Address | Dist | Beds/Ba | Sqft | Sold | Price | $/sf | Match |
|---|---|---|---|---|---|---|---|
| 5930 Agnes Ave | 0.59mi | 6/2.5 | — | 11mo | $235,000 | — | 49 |
| 5341 Paseo Blvd | 0.61mi | 5/2.0 (-1) | — | 2mo | $199,000 | — | 49 |
| 5119 College Ave | 0.73mi | 6/2.0 | 1,200 | 20mo | $315,000 | $263 | 33 |
Match score weights: distance 35% · size 25% · config 20% · recency 20%. Top-matched comps best support the ARV.
Projected returns pro-forma
-3.0% appreciation · 4.42% rent growth · sell at horizon
- IRR
- 2.7%
- Equity multiple
- 1.11×
- Total profit
- $6,745
- Equity at exit
- $33,548
- IRR
- 13.6%
- Equity multiple
- 2.16×
- Total profit
- $73,308
- Equity at exit
- $19,454
Cash invested: $63,000 (down + closing). Projections, not guarantees.
Landlord ↔ Tenant lean methodology
- Overall (STATE)
- 81 Strongly Landlord-Friendly
- State Missouri
- 81 Strongly Landlord-Friendly · R+10
- County
- — inherits STATE
- City
- — inherits STATE
ZIP-level market 64130
- Home prices YoY
- -21.5%
- Rents YoY
- 4.4%
- Active inventory
- 187
- Price-to-rent
- 13.6×
Monthly cashflow live
- Estimated rent
- $2,747 high interval (Pro) →
- Mortgage (P&I)
- −$1,180
- Tax est. 1.5%
- −$281 /mo · $3,375/yr
- Insurance
- −$94
- HOA
- −$0
- Vacancy / Maint / Mgmt
- −$577
- Net cashflow
- $615
Break-even live
2-unit breakdown (identical units grouped — click to expand)
| Units | Beds | Baths | Est. rent |
|---|---|---|---|
| 2× units | 3 | 1.5 | $2,748 |
| #1 | 3 | 1.5 | $1,374 |
| #2 | 3 | 1.5 | $1,374 |
| Total (2 units) | $2,747 | ||
UW: 25.0% down · 7.5% · 30yr · 1.5% tax · 5.0% vac · 8.0% maint · 8.0% mgmt
Financing live
Cash to close
- Down payment
- $56,250
- Closing costs
- $6,750
- Reserves months
- —
- Total cash needed
- —
Loan-product check · same deal, 3 products live
Conventional
25% down · 7.5% · 30yr
- Down + closing
- —
- Monthly P&I
- —
- Monthly cashflow
- —
- DSCR
- —
- Eligible?
- —
Personal DTI + credit; lowest rate.
DSCR
20% down · 8.5% · 30yr
- Down + closing
- —
- Monthly P&I
- —
- Monthly cashflow
- —
- DSCR
- —
- Eligible?
- —
No personal income docs; deal must DSCR.
Hard money
10% down · 12.0% · 12mo
- Down + closing
- —
- Monthly P&I
- —
- Monthly cashflow
- —
- DSCR
- —
- Eligible?
- —
Short-term bridge; refi at stabilization.
Rent comps 1 comps
| Address | Beds | Baths | Sqft | Rent | $/sqft | DOM | Units | Dist |
|---|---|---|---|---|---|---|---|---|
| 5218 Highland Ave Kansas City, MO | 5.0 | 2.0 | 2300 | $1,995 | $0.87 | 7d | 1 | 0.59mi |
Listing history 10 events
-
2026-06-18days on market $225,000 Active 11 DOM
-
2026-06-17days on market $225,000 Active 10 DOM
-
2026-06-16days on market $225,000 Active 9 DOM
-
2026-06-15days on market $225,000 Active 8 DOM
-
2026-06-13days on market $225,000 Active 6 DOM
-
2026-06-09days on market $225,000 Active 2 DOM
-
2026-06-08statusdays on market $225,000 Active 1 DOM
-
2026-06-07days on market $225,000 Coming Soon 5 DOM
-
2026-06-05days on market $225,000 Coming Soon 2 DOM
-
2026-06-03$225,000 Coming Soon 1 DOM
ⓘ Source: listings_history table (triggers on properties + properties_extension) + one-shot
backfill from property_details.listing_events for pre-trigger history.
Nearby sold comps map
Loading sold comps map…
Walkable amenities ~0.75 mi
Loading nearby amenities…
Taxation est. · year 1
- Rental income
- $32,964
- − Mortgage interest
- −$12,603
- − Property taxes
- −$3,375
- − Insurance
- −$1,125
- − Repairs & maintenance
- −$2,637
- − Management
- −$2,637
- − Depreciation
- −$6,545
- Taxable income
- $4,041
- Est. tax owed @ 24.0%
- −$970
- After-tax cash flow
- $6,413/yr
For passive investors: Depreciation is non-cash, so a rental often shows a tax loss while cash-flowing — sheltering income. Rental losses are passive: they offset passive income freely, and up to $25,000/yr can offset ordinary (W-2) income if you actively participate and your MAGI is under $100k (phasing out to $0 by $150k); unused losses carry forward. On sale, claimed depreciation is recaptured at up to 25%, and gains may owe capital-gains tax (a 1031 exchange can defer both). Figures are a year-1 estimate at your 24.0% rate — not tax advice; consult a CPA.
Condition & rehab AI · 2 photos
This multi-family property requires extensive repairs and updates, including a new roof, siding, and HVAC system. Significant improvements would be needed to bring the property up to a good condition and increase its resale and rental value.
Repairs flagged
- Major roof — Signs of wear and potential leaks.
- Major siding — Peeling and chipping paint.
- Major exterior steps — Visible cracks and wear.
- Major HVAC — Likely in poor condition given the overall condition of the property.
- Major interior walls — No photos, but given the exterior, it's likely that the interior walls are also in poor condition.
- Major flooring — No photos, but given the exterior, it's likely that the flooring is also in poor condition.
Value-add opportunities
- Both roof replacement — A new roof would significantly improve the property's appearance and functionality.
- Both exterior siding and paint — New siding and paint would greatly enhance the property's curb appeal and value.
- Both HVAC system — A new HVAC system would improve comfort and energy efficiency, making the property more attractive to buyers and renters.
- Both interior repairs and updates — Interior repairs and updates would improve the living conditions and overall appeal of the property.
- Both landscaping — A well-maintained landscape would enhance the property's curb appeal and attract more potential buyers and renters.
Renovation cost estimate screening
| Repair item | Severity | Est. cost |
|---|---|---|
| roof · Signs of wear and potential leaks. | Major | $15,000–50,000 |
| siding · Peeling and chipping paint. | Major | $15,000–50,000 |
| exterior steps · Visible cracks and wear. | Major | $15,000–50,000 |
| HVAC · Likely in poor condition given the overall condition of the property. | Major | $15,000–50,000 |
| interior walls · No photos, but given the exterior, it's likely that the interior walls are also in poor condition. | Major | $15,000–50,000 |
| flooring · No photos, but given the exterior, it's likely that the flooring is also in poor condition. | Major | $15,000–50,000 |
| Total estimated repair cost · 6 items | $90,000–300,000 |
Value-add ROI direction
- Both roof replacement — A new roof would significantly improve the property's appearance and functionality. ↑
- Both exterior siding and paint — New siding and paint would greatly enhance the property's curb appeal and value. ↑
- Both HVAC system — A new HVAC system would improve comfort and energy efficiency, making the property more attractive to buyers and renters. ↑
- Both interior repairs and updates — Interior repairs and updates would improve the living conditions and overall appeal of the property. ↑
- Both landscaping — A well-maintained landscape would enhance the property's curb appeal and attract more potential buyers and renters. ↑
ⓘ Cost ranges are severity-bucket heuristics (US national rule-of-thumb). Get contractor quotes + a written scope before underwriting a rehab budget.
Schools (NCES district)
- District
- Kansas City 33
- NCES district ID
- 2916400
- Math proficiency
- 12% ▼ -8.00%
- Reading proficiency
- 24% ▬ 0.00%
- Median HH income
- $35,227
- Composite
- 14.8/100
- National rank
- #9387
- State rank
- #308 of 324 in MO
Livability — Kansas City
- Score
- 78/100
- State rank
- #28
- US rank
- #2671
Category grades
Schools grade is shown separately in the Schools card above.
Census & demographics
- Census place
- Kansas City, MO
- County
- Jackson County · 687,798 people
- City population
- 439,467
- Metro
- Kansas City, MO-KS
- Population (ZIP)
- 19,644
- Household income
- $42,221
- Rent vs Own
- Severe rent burden
- 1132.0
Population outlook (Jackson County) Hauer SSP2
- Today (2025)
- 719,589 people
- By 2030
- 731,456 · +1.6%
- By 2040
- 746,689 · +3.8%
- By 2050
- 749,289 · +4.1%
- By 2075
- 736,227 · +2.3%
- By 2100
- 668,210 · -7.1%
Race, ethnicity, and origin ACS 2023
- Neighborhood character
- Predominantly Black (80%)
- Race & ethnicity
- Black 80% White 9% Hispanic / Latino 8% Two or more races 6%
- Hispanic origin (detail)
- Mexican 5%
- Common ancestry
- Lithuanian 1% Swedish 0%
- Foreign-born
- 6% · Canada
- Languages at home
- 92% English-only · Spanish 7%
Political lean MEDSL · Jackson
- 2024 margin
- D (+19.3) · D 58.9% · R 39.5% · Other 1.6%
- 2008→2024 swing
- -6.1pp toward R · 2008: 25.4pp · 2024: 19.3pp
- All cycles
- 2024: D+19.3 2020: D+22.0 2016: D+16.6 2012: D+19.0 2008: D+25.4
Not yet ingested
- Civics
- —
Market trends
- HPI YoY
- ▼ -73.32%
- Current HPI
- 267.491
- Rent YoY
- ▲ 4.42%
- Metro
- Kansas City, MO-KS
- State GDP YoY
- ▲ 1.84%
- F500 in state
- 20
Industry mix (Fortune 500 HQ in MO)
| Industry | F500 HQs | Revenue |
|---|---|---|
| Healthcare | 1 | $163B |
|
||
| Insurance | 1 | $21B |
|
||
| Industrial Technology | 1 | $17B |
|
||
| Retail | 1 | $16B |
|
||
| Industrial Distribution | 1 | $10B |
|
||
| Utilities | 1 | $9B |
|
||
Price history
+5.6% since first listed11 events — show timeline
- 2026-06-03 Coming Soon $225,000 Heartland MLS as Distributed by MLS Grid
- 2026-01-16 Rental Removed $1,200 HMLS
- 2025-11-06 Listed for Rent $1,200 HMLS
- 2025-10-29 Sold (MLS) — Heartland MLS as Distributed by MLS Grid
- 2025-10-01 Pending — Heartland MLS as Distributed by MLS Grid
- 2025-09-11 Price Changed $202,000 Heartland MLS as Distributed by MLS Grid
- 2025-08-26 Price Changed $207,000 Heartland MLS as Distributed by MLS Grid
- 2025-08-23 Relisted — Heartland MLS as Distributed by MLS Grid
- 2025-08-13 Pending — Heartland MLS as Distributed by MLS Grid
- 2025-08-11 Listed $213,000 Heartland MLS as Distributed by MLS Grid
- 2025-08-06 Coming Soon $213,000 Heartland MLS as Distributed by MLS Grid
Cash-flow waterfall
monthlySold comps — $/sqft
last 12 mo · ≤1 miLoading sold comps…