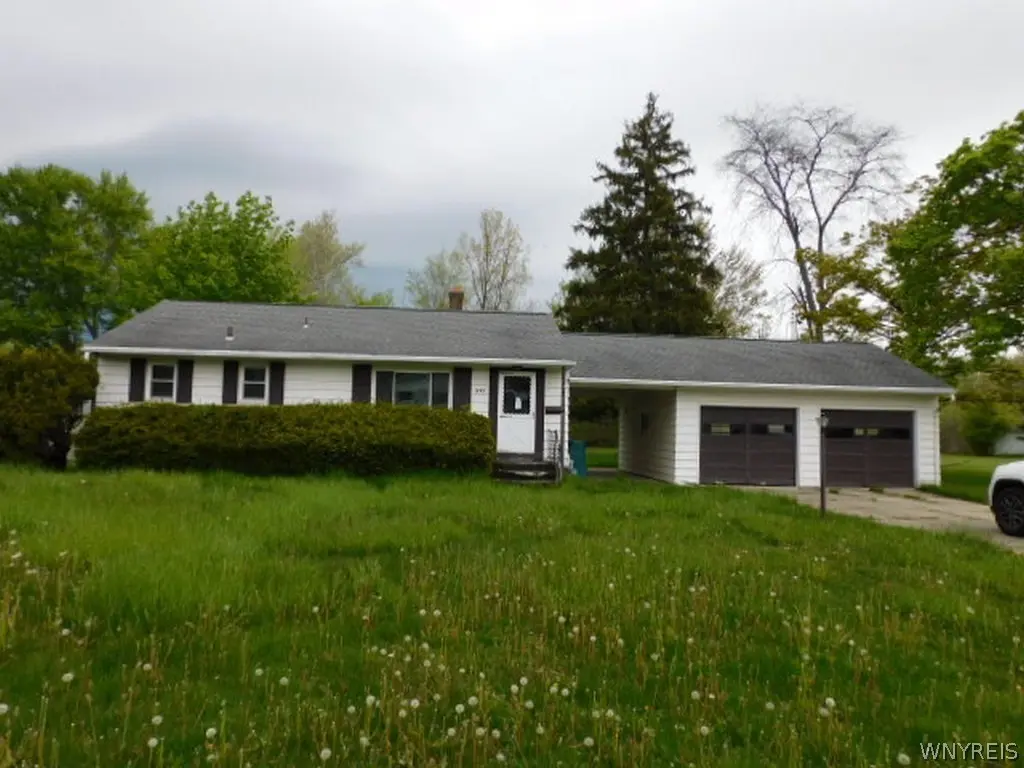
1282 Forbes St · North Tonawanda, NY
Flood risk 1/10 · Minimal
- FEMA flood zone
- X (unshaded)
- Chance of flooding over 30 yrs
- 0.0%
- Est. flood insurance / yr
- $473 – $860
Fire risk 2/10 · Minimal
- Est. fire insurance / yr
- $691 – $1,283
Heat risk 2/10 · Minimal
- Hot days now (above 94°F)
- 7 days/yr
- Hot days in 30 yrs
- 15 days/yr
Wind risk 1/10 · Minimal
- Chance of severe wind over 30 yrs
- —
Air-quality risk 3/10 · Minor
- Unhealthy air days now
- 2 days/yr
- Unhealthy air days in 30 yrs
- 4 days/yr
Risk factors via First Street. Map © Google.
Why this score? — see what drove the C+ grade
The composite is a weighted blend of 9 inputs, each scored 0–100. Each bar is that input's sub-score; the figure is the points it added to the 100-point composite (weight × sub-score).
- Cash flow +24.3/30.0
- DSCR +7.9/10.0
- 1% rule +7.6/10.0
- ARV discount +7.5/15.0
- Schools +4.2/10.0
- Livability +4.2/5.0
- Rent growth +4.0/5.0
- Condition / age +2.5/5.0
- Appreciation +0.0/10.0
$125,000
🖨 Deal sheet (PDF) 📄 Offer letter ✓ Due diligence
Listing remarks
Great deal! Two bedroom ranch in NT awaits your rehabbing. Located off of Nash Rd near Niagara Falls Blvd so you're close to everything you need. Just needs your handy skills and vision to make this into your next new home or investment property. New electrical service being installed. Don't miss it!
Key facts
- Close to everything
- Two bedroom ranch
- 0.78 acre lot
Tags
Property features AI
Exterior
- Parking: Detached 2-car garage
- Utilities: Public water connected; Sewer connected
- Home design: Single-story home; Vinyl siding; Existing (resale) property; Poured foundation
- Construction: Vinyl siding construction
- Exterior features: Concrete driveway; City street frontage; Rectangular residential lot
Interior
- Bedrooms: Two main-level bedrooms
- Flooring: Carpet; Hardwood; Laminate; Varied flooring
- Bathrooms: One full bathroom (main level)
- Heating & cooling: Gas forced-air heating
- Interior features: Separate formal living room; Separate formal dining room; Bedroom on main level; Full basement
- Laundry & utility: Laundry in basement; Gas water heater
Neighborhood map
What this means for you Summary
Snapshot
- This is a 2-bed/1.0-bath single-family listed at $125k.
Deal economics
- At list price, monthly cash flow is $253 ($3k/yr) — positive.
- The deal already cash-flows at list — no discount required.
- Meets the 1% rule at list price ($2k rent vs $125k).
- Cap rate 8.7% vs local median 4.0% in North Tonawanda — top-decile yield for the area; either an underpriced asset or a hidden risk that comps aren't pricing in. Stress-test before assuming the spread holds.
Location & tenants
- Location reads 85/100 on livability (#30 in NY, #518 nationally) — a professional / high-income tenant draw. Strengths: commute A+, housing A+, health & safety A+.
- North Tonawanda City School District (suburban): math 42% / reading 57% proficiency, ranked #398 of 590 in NY (top 68%) — families likely to look elsewhere, expect single-tenant / working-renter base with shorter leases.
- Zoned schools: Ohio Elementary School (math 34% / reading 64%, grade D, #1,085 of 2,108 statewide, top 56%, 371 students, 0% FRL); North Tonawanda Middle School (math 27% / reading 52%, grade F, #418 of 729 statewide, top 59%, 447 students, 50% FRL); North Tonawanda High School (math 93% / reading 64%, grade A-, #562 of 1,100 statewide, top 51%, 1,001 students, 46% FRL) — zoned schools at 32% FRL track the district average.
- Market conditions: Rents rising fast (+6.0%/yr); 180 active listings in the ZIP; 2 comparable units currently listed for rent nearby; 167 units permitted in Niagara County in 2024 (0 in 5+ unit buildings).
Forward outlook
- Local home prices are declining (-3.0%/yr); year-one equity from $864 of loan paydown is wiped out by about $4k of value loss. Plan a longer hold.
- Niagara County population projected at -19% by 2050 — secular population decline; favor cash flow + early exit over multi-decade hold.
- At projected returns (-3.0% appreciation + 6.0% rent growth), your $35k cash investment doubles in ~9 years — after that, you're playing with house money.
Negotiation context
- Only 8 days on market — expect competitive offers; lowballing is unlikely to land.
Risks & watch-outs
- Watch-outs: property tax is 2.7% of price; built in 1955 — expect roof / HVAC / electrical / plumbing capex.
Questions for the listing agent
- Built in 1955 — when were the roof, HVAC, electrical panel, plumbing, and water heater last replaced?
- Property tax is high relative to price — has the assessment been appealed recently, and will the sale trigger a re-assessment?
- Is there a deadline driving the sale (1031 exchange, divorce, estate, relocation)? That informs how much negotiation room exists.
- Schools are B-rated — typically a magnet for longer-tenancy family renters. What's the average tenant stay here, and is there a school-zone premium baked into asking?
- What's the average days-on-market for RENTAL listings here right now (not sales)? A rising rental-DOM trend means longer vacancies and softer asking-rent achievability than the comps imply.
- What's the recent tenant-quality profile in this submarket — average credit score on applications, eviction rate, late-payment / NSF rate, and stable-employment percentage? A property-management company in the area should have these aggregated.
- How much new for-sale + rental construction is in the pipeline within 1–3 miles? Heavy new supply typically softens prices + rents 12–24 months out; constrained supply supports both.
Investment metrics
- 1% rule
- 1.26% ✓
- Cap rate
- 8.72%
- Cash-on-cash
- 8.66%
- DSCR
- 1.39
- GRM
- 6.6
CMA / ARV
- ARV (on-the-fly)
- $282,952
- Comps found
- 12
Show comp detail 12 sales within ~0.75 mi
| Address | Dist | Beds/Ba | Sqft | Sold | Price | $/sf | Match |
|---|---|---|---|---|---|---|---|
| 1416 Forbes St | 0.25mi | 3/2.0 (+1) | 1,280 (+2%) | 10mo | $236,000 | $184 | 67 |
| 1330 Forbes St | 0.09mi | 3/1.0 (+1) | 1,102 (-12%) | 12mo | $325,000 | $295 | 61 |
| 1431 Forbes St | 0.28mi | 3/1.5 (+1) | 1,303 (+4%) | 20mo | $245,000 | $188 | 56 |
| 1387 Saybrook Ave | 0.53mi | 3/1.0 (+1) | 1,272 (+2%) | 18mo | $287,000 | $226 | 52 |
| 1533 Jamaica | 0.35mi | 3/1.5 (+1) | 1,430 (+14%) | 8mo | $335,000 | $234 | 47 |
| 1120 Ruie Rd | 0.39mi | 3/1.5 (+1) | 1,364 (+9%) | 20mo | $230,000 | $169 | 43 |
| 1058 Ruie Rd | 0.49mi | 3/2.0 (+1) | 1,396 (+12%) | 7mo | $339,900 | $243 | 43 |
| 550 North Ave | 0.68mi | 3/1.0 (+1) | 1,104 (-12%) | 11mo | $260,000 | $236 | 34 |
| 1455 Jamaica Sq | 0.49mi | 3/1.5 (+1) | 1,436 (+15%) | 16mo | $295,000 | $205 | 33 |
| 7186 Norman Rd | 0.70mi | 3/1.0 (+1) | 1,092 (-13%) | 12mo | $365,000 | $334 | 30 |
| 605 Deerfield Dr | 0.65mi | 3/1.0 (+1) | 1,075 (-14%) | 14mo | $240,000 | $223 | 30 |
| 1400 Birch Dr | 0.55mi | 3/1.5 (+1) | 1,064 (-15%) | 18mo | $223,000 | $210 | 28 |
Match score weights: distance 35% · size 25% · config 20% · recency 20%. Top-matched comps best support the ARV.
Projected returns pro-forma
-3.0% appreciation · 5.96% rent growth · sell at horizon
- IRR
- 0.5%
- Equity multiple
- 1.02×
- Total profit
- $747
- Equity at exit
- $18,638
- IRR
- 13.3%
- Equity multiple
- 2.22×
- Total profit
- $42,778
- Equity at exit
- $10,808
Cash invested: $35,000 (down + closing). Projections, not guarantees.
Landlord ↔ Tenant lean methodology
- Overall (STATE)
- 15 Strongly Tenant-Friendly
- State New York
- 15 Strongly Tenant-Friendly · D+10
- County
- — inherits STATE
- City
- — inherits STATE
ZIP-level market 14120
- Rents YoY
- 6.0%
- Active inventory
- 180
- Price-to-rent
- 6.6×
Monthly cashflow live
- Estimated rent
- $1,571 medium interval (Pro) →
- Mortgage (P&I)
- −$656
- Tax from tax record
- −$281 /mo · $3,372/yr
- Insurance
- −$52
- HOA
- −$0
- Vacancy / Maint / Mgmt
- −$330
- Net cashflow
- $253
Break-even live
Sensitivity live
| Price | -10% $323 | -5% $288 | +0% $253 | +5% $217 | +10% $182 |
|---|---|---|---|---|---|
| Rent | -10% $128 | -5% $190 | +0% $253 | +5% $315 | +10% $377 |
| Rate | -1.0pp $315 | -0.5pp $284 | base $253 | +0.5pp $220 | +1.0pp $187 |
UW: 25.0% down · 7.5% · 30yr · 1.5% tax · 5.0% vac · 8.0% maint · 8.0% mgmt
Financing live
Cash to close
- Down payment
- $31,250
- Closing costs
- $3,750
- Reserves months
- —
- Total cash needed
- —
Loan-product check · same deal, 3 products live
Conventional
25% down · 7.5% · 30yr
- Down + closing
- —
- Monthly P&I
- —
- Monthly cashflow
- —
- DSCR
- —
- Eligible?
- —
Personal DTI + credit; lowest rate.
DSCR
20% down · 8.5% · 30yr
- Down + closing
- —
- Monthly P&I
- —
- Monthly cashflow
- —
- DSCR
- —
- Eligible?
- —
No personal income docs; deal must DSCR.
Hard money
10% down · 12.0% · 12mo
- Down + closing
- —
- Monthly P&I
- —
- Monthly cashflow
- —
- DSCR
- —
- Eligible?
- —
Short-term bridge; refi at stabilization.
Rent comps 2 comps
| Address | Beds | Baths | Sqft | Rent | $/sqft | DOM | Units | Dist |
|---|---|---|---|---|---|---|---|---|
| 757 Remington Dr Unit 1 North Tonawanda, NY | 3.0 | 1.5 | 1100 | $1,750 | $1.59 | 12d | 1 | 0.94mi |
| 528 Ward Rd North Tonawanda, NY | 3.0 | 1.0 | 916 | $2,250 | $2.46 | 3d | 1 | 1.26mi |
Listing history 1 events
-
2026-05-18$125,000 Active
ⓘ Source: listings_history table (triggers on properties + properties_extension) + one-shot
backfill from property_details.listing_events for pre-trigger history.
Tax reassessment forecast NY · Partial reset (capped growth)
- Current annual tax
- $3,372 · $281/mo
- Projected year-2 tax
- $3,372 · $281/mo
- Expected delta
- $0/yr ($0/mo · 0.0%)
ⓘ Screening estimate from a state-policy table — verify with the county assessor before closing.
Climate risk First Street
- Flood 1/10 Low FEMA zone X (unshaded) · 0% chance over 30 yrs
- Wildfire 2/10 Low
- Heat 2/10 Low 7 d/yr ≥94°F today · 15 d/yr by 30 yrs out
- Wind 1/10 Low
- Air quality 3/10 Moderate 2 unhealthy d/yr today · 4 by 30 yrs out
Nearby sold comps map
Loading sold comps map…
Walkable amenities ~0.75 mi
Loading nearby amenities…
Taxation est. · year 1
- Rental income
- $18,853
- − Mortgage interest
- −$7,002
- − Property taxes
- −$3,372
- − Insurance
- −$625
- − Repairs & maintenance
- −$1,508
- − Management
- −$1,508
- − Depreciation
- −$3,636
- Taxable income
- $1,201
- Est. tax owed @ 24.0%
- −$288
- After-tax cash flow
- $2,742/yr
For passive investors: Depreciation is non-cash, so a rental often shows a tax loss while cash-flowing — sheltering income. Rental losses are passive: they offset passive income freely, and up to $25,000/yr can offset ordinary (W-2) income if you actively participate and your MAGI is under $100k (phasing out to $0 by $150k); unused losses carry forward. On sale, claimed depreciation is recaptured at up to 25%, and gains may owe capital-gains tax (a 1031 exchange can defer both). Figures are a year-1 estimate at your 24.0% rate — not tax advice; consult a CPA.
Schools (NCES district)
- District
- North Tonawanda City School District
- NCES district ID
- 3621240
- Math proficiency
- 42% ▼ -16.00%
- Reading proficiency
- 57% ▲ 4.00%
- Median HH income
- $48,348
- Composite
- 42.15/100
- National rank
- #3301
- State rank
- #398 of 590 in NY
Livability — North Tonawanda
- Score
- 85/100
- State rank
- #30
- US rank
- #518
Category grades
Schools grade is shown separately in the Schools card above.
Census & demographics
- Census place
- North Tonawanda, NY
- County
- Niagara County · 157,377 people
- City population
- 44,241
- Metro
- Buffalo-Cheektowaga, NY
- Population (ZIP)
- 44,241
- Household income
- $74,871
- Rent vs Own
- Severe rent burden
- 1303.0
Population outlook (Niagara County) Hauer SSP2
- Today (2025)
- 204,149 people
- By 2030
- 197,900 · -3.1%
- By 2040
- 182,239 · -10.7%
- By 2050
- 165,198 · -19.1%
- By 2075
- 129,416 · -36.6%
- By 2100
- 96,222 · -52.9%
Race, ethnicity, and origin ACS 2023
- Neighborhood character
- Predominantly White (91%)
- Race & ethnicity
- White 91% Two or more races 4% Hispanic / Latino 3% Black 2%
- Common ancestry
- Romanian 15% Lithuanian 2% Slovak 2%
- Foreign-born
- 4% · Canada, China
- Languages at home
- 95% English-only · Russian/Polish/Slavic 2% Spanish 1% Other Indo-European 1%
Political lean MEDSL · Niagara
- 2024 margin
- R (+14.9) · D 42.5% · R 57.5%
- 2008→2024 swing
- -15.9pp toward R · 2008: 1.0pp · 2024: -14.9pp
- All cycles
- 2024: R+14.9 2020: R+9.7 2016: R+19.0 2012: D+0.6 2008: D+1.0
Not yet ingested
- Civics
- —
Market trends
- HPI YoY
- ▼ -260.39%
- Current HPI
- 303.1744
- Rent YoY
- ▲ 5.96%
- Metro
- Buffalo-Cheektowaga, NY
- State GDP YoY
- ▲ 2.60%
- F500 in state
- 92
Industry mix (Fortune 500 HQ in NY)
| Industry | F500 HQs | Revenue |
|---|---|---|
| Financial Services | 10 | $950B |
|
||
| Consumer Goods | 9 | $162B |
|
||
| Insurance | 4 | $225B |
|
||
| Telecommunications | 2 | $144B |
|
||
| Pharmaceuticals | 2 | $112B |
|
||
| Media / Entertainment | 2 | $69B |
|
||
Price history
1 event — show timeline
- 2026-05-18 Listed $125,000 WNYREIS
Property tax history
+7.6%/yrLatest (2025): $3,372 · +0.6% YoY. Source: county tax records.
Cash-flow waterfall
monthlySold comps — $/sqft
last 12 mo · ≤1 miLoading sold comps…