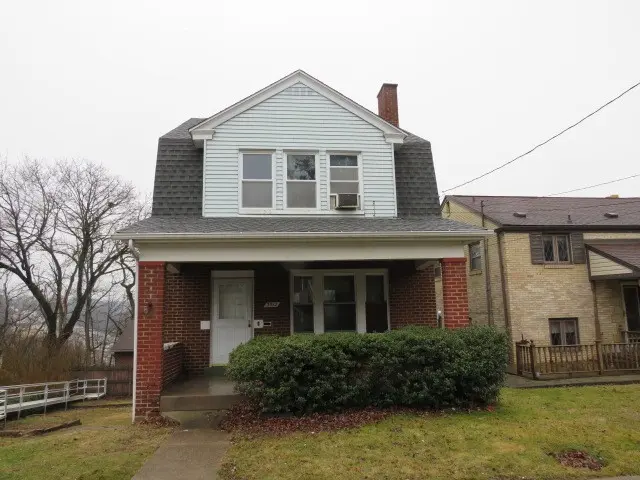
3512 Dauphin Ave · Brentwood, PA
Flood risk 1/10 · Minimal
- FEMA flood zone
- X (unshaded)
- Chance of flooding over 30 yrs
- 0.0%
- Est. flood insurance / yr
- $473 – $860
Fire risk 1/10 · Minimal
- Est. fire insurance / yr
- $511 – $949
Heat risk 3/10 · Minor
- Hot days now (above 96°F)
- 7 days/yr
- Hot days in 30 yrs
- 17 days/yr
Wind risk 2/10 · Minimal
- Chance of severe wind over 30 yrs
- —
Air-quality risk 3/10 · Minor
- Unhealthy air days now
- 3 days/yr
- Unhealthy air days in 30 yrs
- 5 days/yr
Risk factors via First Street. Map © Google.
Why this score? — see what drove the B grade
The composite is a weighted blend of 9 inputs, each scored 0–100. Each bar is that input's sub-score; the figure is the points it added to the 100-point composite (weight × sub-score).
- Cash flow +30.0/30.0
- 1% rule +10.0/10.0
- DSCR +10.0/10.0
- ARV discount +7.5/15.0
- Livability +4.0/5.0
- Rent growth +3.6/5.0
- Schools +3.4/10.0
- Condition / age +2.5/5.0
- Appreciation +0.0/10.0
$64,900
🖨 Deal sheet 📄 Offer letter ✓ Due diligence
Listing remarks
Spacious two story home with a large front covered porch and a one car detached garage. As you enter you will notice the cozy brick fireplace in the living room. Upstairs you will find all three bedrooms and the full bathroom. There is a full partially finished game room on the lower level with a bar, laundry area, built in shelving for additional storage, and a half bathroom. Finished walk up attic space. Minutes to Rt 51 and South Hills country club.
Key facts
- Front covered porch
- Minutes to rt 51
- Built in shelving
Tags
Neighborhood map
What this means for you Summary
Snapshot
- This is a 3-bed/1.5-bath single-family listed at $65k.
Deal economics
- At list price, monthly cash flow is $734 ($9k/yr) — positive.
- The deal already cash-flows at list — no discount required.
- Meets the 1% rule at list price ($1k rent vs $65k).
- Cap rate 19.9% vs local median 4.3% in Brentwood — top-decile yield for the area; either an underpriced asset or a hidden risk that comps aren't pricing in. Stress-test before assuming the spread holds.
Location & tenants
- Location reads 81/100 on livability (#178 in PA, #1,479 nationally) — a professional / high-income tenant draw. Strengths: schools A+, cost of living A+, housing A+; Watch: amenities C-.
- Brentwood Borough SD (suburban): math 29% / reading 50% proficiency, ranked #357 of 539 in PA (top 66%) — families likely to look elsewhere, expect single-tenant / working-renter base with shorter leases.
- Market conditions: Rents rising fast (+4.3%/yr); 117 active listings in the ZIP; 15 comparable units currently listed for rent nearby; rentals at typical pace (median 21d on market — plan ~3-4 weeks tenant-placement turnaround); solid renter incomes; 2,996 units permitted in Allegheny County in 2024 (1,588 in 5+ unit buildings).
Forward outlook
- Local home prices are declining (-3.0%/yr); year-one equity from $449 of loan paydown is wiped out by about $2k of value loss. Plan a longer hold.
- At projected returns (-3.0% appreciation + 4.3% rent growth), your $18k cash investment doubles in ~3 years — after that, you're playing with house money.
Negotiation context
- Only 14 days on market — expect competitive offers; lowballing is unlikely to land.
- Current owner paid $30k; list at $65k implies a 116% gain — meaningful room to come down on a strong offer.
Risks & watch-outs
- Watch-outs: built in 1930 — expect roof / HVAC / electrical / plumbing capex.
Questions for the listing agent
- Built in 1930 — when were the roof, HVAC, electrical panel, plumbing, and water heater last replaced?
- Is there a deadline driving the sale (1031 exchange, divorce, estate, relocation)? That informs how much negotiation room exists.
- Schools are A-rated — typically a magnet for longer-tenancy family renters. What's the average tenant stay here, and is there a school-zone premium baked into asking?
- What's the average days-on-market for RENTAL listings here right now (not sales)? A rising rental-DOM trend means longer vacancies and softer asking-rent achievability than the comps imply.
- What's the recent tenant-quality profile in this submarket — average credit score on applications, eviction rate, late-payment / NSF rate, and stable-employment percentage? A property-management company in the area should have these aggregated.
- How much new for-sale + rental construction is in the pipeline within 1–3 miles? Heavy new supply typically softens prices + rents 12–24 months out; constrained supply supports both.
Investment metrics
- 1% rule
- 2.31% ✓
- Cap rate
- 19.86%
- Cash-on-cash
- 48.47%
- DSCR
- 3.16
- GRM
- 3.6
CMA / ARV
- ARV (on-the-fly)
- $226,632
- Comps found
- 12
Show comp detail 12 sales within ~0.75 mi
| Address | Dist | Beds/Ba | Sqft | Sold | Price | $/sf | Match |
|---|---|---|---|---|---|---|---|
| 3512 Dauphin Ave | 0.00mi | 3/1.5 | 1,596 (0%) | 1mo | $64,900 | $41 | 99 |
| 112 Heathmore Ave | 0.41mi | 3/1.0 | 1,588 (-0%) | 4mo | $235,000 | $148 | 75 |
| 129 W Brentridge Ave | 0.38mi | 3/1.0 | 1,516 (-5%) | 4mo | $251,000 | $166 | 69 |
| 3196 Kestner Ave | 0.26mi | 4/1.5 (+1) | 1,725 (+8%) | 4mo | $216,000 | $125 | 66 |
| 3116 Elroy Ave | 0.51mi | 3/1.5 | 1,502 (-6%) | 4mo | $155,000 | $103 | 63 |
| 228 Kaplan Ave | 0.36mi | 3/2.0 | 1,791 (+12%) | 0mo | $254,000 | $142 | 61 |
| 3128 Elroy Ave | 0.49mi | 3/1.0 | 1,718 (+8%) | 5mo | $185,000 | $108 | 58 |
| 4028 Cloverlea St | 0.53mi | 3/1.5 | 1,456 (-9%) | 3mo | $280,000 | $192 | 58 |
| 109 Burdine Ave | 0.65mi | 3/2.0 | 1,682 (+5%) | 1mo | $275,000 | $163 | 58 |
| 4048 Cloverlea St | 0.56mi | 3/1.0 | 1,364 (-14%) | 0mo | $167,500 | $123 | 48 |
| 4111 Tuxey Ave | 0.74mi | 3/1.5 | 1,424 (-11%) | 1mo | $229,900 | $161 | 47 |
| 2812 Brentwood Ave | 0.70mi | 4/2.0 (+1) | 1,764 (+10%) | 3mo | $194,500 | $110 | 40 |
Match score weights: distance 35% · size 25% · config 20% · recency 20%. Top-matched comps best support the ARV.
Projected returns pro-forma
-3.0% appreciation · 4.33% rent growth · sell at horizon
- IRR
- 47.5%
- Equity multiple
- 3.11×
- Total profit
- $38,284
- Equity at exit
- $9,677
- IRR
- 53.7%
- Equity multiple
- 6.62×
- Total profit
- $102,183
- Equity at exit
- $5,611
Cash invested: $18,172 (down + closing). Projections, not guarantees.
Landlord ↔ Tenant lean methodology
- Overall (STATE)
- 62 Landlord-Friendly
- State Pennsylvania
- 62 Landlord-Friendly · EVEN
- County
- — inherits STATE
- City
- — inherits STATE
ZIP-level market 15227
- Home prices YoY
- -27.5%
- Rents YoY
- 4.3%
- Active inventory
- 117
- Price-to-rent
- 3.6×
Monthly cashflow live
- Estimated rent
- $1,497 high interval (Pro) →
- Mortgage (P&I)
- −$340
- Tax est. 1.5%
- −$81 /mo · $974/yr
- Insurance
- −$27
- HOA
- −$0
- Vacancy / Maint / Mgmt
- −$314
- Net cashflow
- $734
Break-even live
UW: 25.0% down · 7.5% · 30yr · 1.5% tax · 5.0% vac · 8.0% maint · 8.0% mgmt
Financing live
Cash to close
- Down payment
- $16,225
- Closing costs
- $1,947
- Reserves months
- —
- Total cash needed
- —
Loan-product check · same deal, 3 products live
Conventional
25% down · 7.5% · 30yr
- Down + closing
- —
- Monthly P&I
- —
- Monthly cashflow
- —
- DSCR
- —
- Eligible?
- —
Personal DTI + credit; lowest rate.
DSCR
20% down · 8.5% · 30yr
- Down + closing
- —
- Monthly P&I
- —
- Monthly cashflow
- —
- DSCR
- —
- Eligible?
- —
No personal income docs; deal must DSCR.
Hard money
10% down · 12.0% · 12mo
- Down + closing
- —
- Monthly P&I
- —
- Monthly cashflow
- —
- DSCR
- —
- Eligible?
- —
Short-term bridge; refi at stabilization.
Rent comps 15 comps
| Address | Beds | Baths | Sqft | Rent | $/sqft | DOM | Units | Dist |
|---|---|---|---|---|---|---|---|---|
| 453 Greenlee Rd Pittsburgh, PA | 3.0 | 1.0 | 1176 | $1,495 | $1.27 | 44d | 1 | 0.33mi |
| 3224 Bookman Ave Unit 1 Pittsburgh, PA | 2.0 | 2.0 | 1207 | $1,550 | $1.28 | 44d | 1 | 0.33mi |
| 416 Jacobson Dr Brentwood, PA | 2.0 | 1.0 | 1150 | $1,050 | $0.91 | 24d | 1 | 0.50mi |
| 4588 E Willock Rd Pittsburgh, PA | 3.0 | 1.5 | 1500 | $1,500 | $1.00 | 4d | 1 | 0.65mi |
| 2811 Brownsville Rd Unit 4 Brentwood, PA | 2.0 | 1.0 | 1250 | $995 | $0.80 | 44d | 1 | 0.65mi |
| 2823 Clermont Ave Pittsburgh, PA | 3.0 | 1.0 | 1354 | $1,490 | $1.10 | 20d | 1 | 0.66mi |
| 2721 Pyramid Ave Pittsburgh, PA | 3.0 | 1.0 | 1560 | $1,550 | $0.99 | 8d | 1 | 0.76mi |
| 2940 Brevard Ave Pittsburgh, PA | 3.0 | 1.5 | 1176 | $1,475 | $1.25 | 44d | 1 | 0.80mi |
| 2769 Churchview Ave Unit 9 Pittsburgh, PA | 2.0 | 1.0 | 1200 | $1,095 | $0.91 | 44d | 1 | 0.81mi |
| 1526 Parkline Dr Pittsburgh, PA | 3.0 | 1.0 | 942 | $1,475 | $1.56 | 8d | 44 | 0.86mi |
| 3341 Recker Dr Pittsburgh, PA | 3.0 | 2.0 | 1174 | $1,750 | $1.49 | 24d | 1 | 1.02mi |
| 100 White Hampton Ln Pittsburgh, PA | 1.0–2.0 | 1.0–2.0 | 867 | $1,720 | $1.98 | 2d | 19 | 1.18mi |
| 2355 Glenbury St Pittsburgh, PA | 4.0 | 2.0 | 1350 | $2,300 | $1.70 | 4d | 1 | 1.35mi |
| 103 Paddock Ln Pittsburgh, PA | 3.0 | 2.0 | 2100 | $2,299 | $1.09 | 2d | 1 | 1.41mi |
| 1310 Martha St Pittsburgh, PA | 3.0 | 1.0 | 1061 | $1,050 | $0.99 | 12d | 1 | 1.45mi |
Listing history 4 events
-
2026-03-18status Pending
-
2026-03-09historical Contingent
-
2026-03-03$64,900 Active
-
1977-04-05soldstatus $30,000
ⓘ Source: listings_history table (triggers on properties + properties_extension) + one-shot
backfill from property_details.listing_events for pre-trigger history.
Climate risk First Street
- Flood 1/10 Low FEMA zone X (unshaded) · 0% chance over 30 yrs
- Wildfire 1/10 Low
- Heat 3/10 Moderate 7 d/yr ≥96°F today · 17 d/yr by 30 yrs out
- Wind 2/10 Low
- Air quality 3/10 Moderate 3 unhealthy d/yr today · 5 by 30 yrs out
Nearby sold comps map
Loading sold comps map…
Walkable amenities ~0.75 mi
Loading nearby amenities…
Taxation est. · year 1
- Rental income
- $17,962
- − Mortgage interest
- −$3,635
- − Property taxes
- −$974
- − Insurance
- −$324
- − Repairs & maintenance
- −$1,437
- − Management
- −$1,437
- − Depreciation
- −$1,888
- Taxable income
- $8,267
- Est. tax owed @ 24.0%
- −$1,984
- After-tax cash flow
- $6,824/yr
For passive investors: Depreciation is non-cash, so a rental often shows a tax loss while cash-flowing — sheltering income. Rental losses are passive: they offset passive income freely, and up to $25,000/yr can offset ordinary (W-2) income if you actively participate and your MAGI is under $100k (phasing out to $0 by $150k); unused losses carry forward. On sale, claimed depreciation is recaptured at up to 25%, and gains may owe capital-gains tax (a 1031 exchange can defer both). Figures are a year-1 estimate at your 24.0% rate — not tax advice; consult a CPA.
Schools (NCES district)
- District
- Brentwood Borough SD
- NCES district ID
- 4204140
- Math proficiency
- 29% ▼ -15.00%
- Reading proficiency
- 50% ▼ -15.00%
- Median HH income
- $49,260
- Composite
- 33.92/100
- National rank
- #5341
- State rank
- #357 of 539 in PA
Livability — Brentwood
- Score
- 81/100
- State rank
- #178
- US rank
- #1479
Category grades
Schools grade is shown separately in the Schools card above.
Census & demographics
- Census place
- Brentwood, PA
- County
- Allegheny County · 1,022,028 people
- City population
- 28,460
- Metro
- Pittsburgh, PA
- Population (ZIP)
- 28,460
- Household income
- $75,448
- Rent vs Own
- Severe rent burden
- 780.0
Population outlook (Allegheny County) Hauer SSP2
- Today (2025)
- 1,250,282 people
- By 2030
- 1,256,482 · +0.5%
- By 2040
- 1,256,318 · +0.5%
- By 2050
- 1,244,169 · -0.5%
- By 2075
- 1,197,693 · -4.2%
- By 2100
- 1,093,187 · -12.6%
Race, ethnicity, and origin ACS 2023
- Neighborhood character
- Predominantly White (80%)
- Race & ethnicity
- White 80% Black 7% Asian 6% Two or more races 5% Hispanic / Latino 1%
- Common ancestry
- Romanian 9% Scotch-Irish 2% Slovak 1%
- Foreign-born
- 9% · India, Canada, China
- Languages at home
- 89% English-only · Other Indo-European 6% Other Asian/Pacific 1% French/Haitian/Cajun 1%
Political lean MEDSL · Allegheny
- 2024 margin
- Strong D (+20.3) · D 59.7% · R 39.4%
- 2008→2024 swing
- +4.8pp toward D · 2008: 15.5pp · 2024: 20.3pp
- All cycles
- 2024: D+20.3 2020: D+20.4 2016: D+16.4 2012: D+14.4 2008: D+15.5
Not yet ingested
- Civics
- —
Market trends
- HPI YoY
- ▼ -92.53%
- Current HPI
- 243.6383
- Rent YoY
- ▲ 4.33%
- Metro
- Pittsburgh, PA
- State GDP YoY
- ▲ 1.68%
- F500 in state
- 34
Industry mix (Fortune 500 HQ in PA)
| Industry | F500 HQs | Revenue |
|---|---|---|
| Healthcare | 2 | $309B |
|
||
| Insurance | 2 | $27B |
|
||
| Telecommunications / Media | 1 | $124B |
|
||
| Industrial Distribution | 1 | $22B |
|
||
| Financial Services | 1 | $20B |
|
||
| Chemicals / Materials | 1 | $18B |
|
||
Price history
+116.3% since first listed4 events — show timeline
- 2026-03-18 Pending — West Penn MLS
- 2026-03-09 Contingent — West Penn MLS
- 2026-03-03 Listed $64,900 West Penn MLS
- 1977-04-05 Sold (Public Records) $30,000 Public Records
Property tax history
+4.8%/yrLatest (2026): $4,966 · +31.6% YoY. Source: county tax records.
Cash-flow waterfall
monthlySold comps — $/sqft
last 12 mo · ≤1 miLoading sold comps…