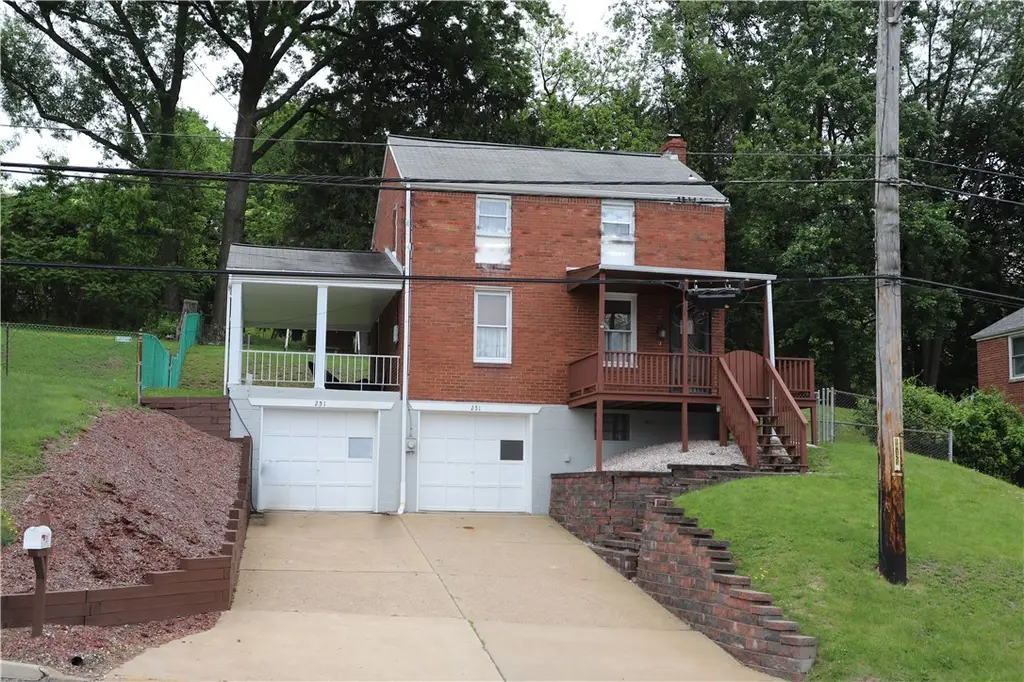
251 Rodi Rd · Churchill, PA
Flood risk 8/10 · Major
- FEMA flood zone
- X (unshaded)
- Chance of flooding over 30 yrs
- 0.99%
- Est. flood insurance / yr
- $473 – $860
Fire risk 1/10 · Minimal
- Est. fire insurance / yr
- $511 – $949
Heat risk 3/10 · Minor
- Hot days now (above 96°F)
- 7 days/yr
- Hot days in 30 yrs
- 17 days/yr
Wind risk 2/10 · Minimal
- Chance of severe wind over 30 yrs
- —
Air-quality risk 4/10 · Minor
- Unhealthy air days now
- 5 days/yr
- Unhealthy air days in 30 yrs
- 7 days/yr
Risk factors via First Street. Map © Google.
Why this score? — see what drove the C- grade
The composite is a weighted blend of 9 inputs, each scored 0–100. Each bar is that input's sub-score; the figure is the points it added to the 100-point composite (weight × sub-score).
- Cash flow +16.0/30.0
- ARV discount +15.0/15.0
- DSCR +4.9/10.0
- 1% rule +4.5/10.0
- Rent growth +4.4/5.0
- Livability +3.7/5.0
- Condition / age +2.5/5.0
- Schools +1.6/10.0
- Appreciation +0.0/10.0
$150,000
🖨 Deal sheet (PDF) 📄 Offer letter ✓ Due diligence
Listing remarks
Beautifully maintained and full of charm, this immaculate 2-story home is ready to impress! Featuring 2 bedrooms, 1 full bath, and a spacious 2-car garage, this home offers the perfect blend of comfort and convenience. Relax with your morning coffee on the covered front porch or unwind in the private fenced backyard from the covered rear porch — ideal for entertaining, pets, or peaceful evenings at home. Pride of ownership shines throughout every inch of this move-in ready gem. Conveniently located just minutes from the Parkway East, PA Turnpike, and downtown Pittsburgh, you’ll enjoy easy access to shopping, dining, and commuting while still feeling right at home.
Key facts
- Covered front porch
- 7,501 sq ft lot
- Garage
Tags
Property features AI
Finance
- HOA & community: Public transportation access nearby
Exterior
- Parking: Attached garage with garage door opener; Built-in parking for 2 vehicles
- Utilities: Public water; Public sewer
- Home design: 2-story brick home; Asphalt roof
- Construction: Brick construction; Asphalt roof
- Exterior features: Lot roughly 60 x 125; Approximately 0.172 acre lot; Resale condition
Interior
- Kitchen: Kitchen (main level) — 11 x 10
- Bedrooms: Bedroom (upper) — 12 x 11
- Flooring: Carpet; Hardwood
- Bathrooms: 1 full bathroom
- Heating & cooling: Forced air heating (gas); Central air conditioning
- Interior features: Carpet and hardwood flooring; Entry/foyer; Living room; Dining room; Full interior-entry basement; Seven total rooms
- Laundry & utility: Laundry room (lower level)
Neighborhood map
What this means for you Summary
Snapshot
- This is a 2-bed/1.0-bath single-family listed at $150k.
Deal economics
- At list price, monthly cash flow is $19 ($224/yr) — positive.
- The deal already cash-flows at list — no discount required.
- To meet the 1% rule (rent ≥ 1% of price), the offer needs to be $143k (4.8% below list).
- Recommended offer: $143k (4.8% below list) — sets the bar for 1% rule.
- Cap rate 6.9% vs local median 4.6% in Churchill — top-decile yield for the area; either an underpriced asset or a hidden risk that comps aren't pricing in. Stress-test before assuming the spread holds.
Location & tenants
- Location reads 74/100 on livability (#486 in PA, #4,477 nationally) — a middle-class / working-renter tenant base. Strengths: crime A+, employment A+, housing A+; Watch: health & safety D, amenities F, commute F.
- Penn Hills SD (suburban): math 13% / reading 24% proficiency, ranked #496 of 539 in PA (top 92%) — low school quality limits family demand, transient renter base, plan for 1-2y turnover.
- Zoned schools: Penn Hills El Sch (math 14% / reading 27%, grade F, #1,243 of 1,518 statewide, top 82%, 1,279 students, 100% FRL); Linton Ms (math 3% / reading 21%, grade F, #489 of 512 statewide, top 96%, 640 students, 100% FRL); Penn Hills Shs (math 34% / reading 24%, grade F, #357 of 437 statewide, top 82%, 1,107 students, 88% FRL) — zoned schools average 96% FRL vs 56% district-wide (40 pts higher); higher-poverty schools than district average — tighter screening recommended.
- Market conditions: Rents rising fast (+7.6%/yr); 129 active listings in the ZIP; 24 comparable units currently listed for rent nearby; rentals at typical pace (median 17d on market — plan ~3-4 weeks tenant-placement turnaround); 2,996 units permitted in Allegheny County in 2024 (1,588 in 5+ unit buildings).
Forward outlook
- Local home prices are declining (-3.0%/yr); year-one equity from $1k of loan paydown is wiped out by about $4k of value loss. Plan a longer hold.
Negotiation context
- It's been on market 27 days — a 2% lower offer ($148k) is reasonable based on typical stale-listing flexibility.
- Current owner paid $32k; list at $150k implies a 362% gain — meaningful room to come down on a strong offer.
Risks & watch-outs
- Watch-outs: flood insurance adds $56/mo; built in 1953 — expect roof / HVAC / electrical / plumbing capex.
- Climate carrying-cost: severe flood risk — expect insurance premiums to compound above CPI over the hold.
Questions for the listing agent
- Built in 1953 — when were the roof, HVAC, electrical panel, plumbing, and water heater last replaced?
- What's the actual annual flood-insurance premium (NFIP or private), and is the property in a SFHA with mandatory coverage?
- Is there a deadline driving the sale (1031 exchange, divorce, estate, relocation)? That informs how much negotiation room exists.
- Schools are B-rated — typically a magnet for longer-tenancy family renters. What's the average tenant stay here, and is there a school-zone premium baked into asking?
- What's the average days-on-market for RENTAL listings here right now (not sales)? A rising rental-DOM trend means longer vacancies and softer asking-rent achievability than the comps imply.
- What's the recent tenant-quality profile in this submarket — average credit score on applications, eviction rate, late-payment / NSF rate, and stable-employment percentage? A property-management company in the area should have these aggregated.
- How much new for-sale + rental construction is in the pipeline within 1–3 miles? Heavy new supply typically softens prices + rents 12–24 months out; constrained supply supports both.
Investment metrics
- 1% rule
- 0.95% ✗
- Cap rate
- 6.89%
- Cash-on-cash
- 2.12%
- DSCR
- 1.09
- GRM
- 8.8
CMA / ARV
- ARV (on-the-fly)
- $194,880
- Comps found
- 12
Show comp detail 12 sales within ~0.75 mi
| Address | Dist | Beds/Ba | Sqft | Sold | Price | $/sf | Match |
|---|---|---|---|---|---|---|---|
| 11403 Clematis Blvd | 0.60mi | 2/1.0 | 1,209 (-1%) | 6mo | $184,000 | $152 | 66 |
| 77 Duff Rd | 0.20mi | 2/1.0 | 1,050 (-14%) | 2mo | $8,755 | $8 | 66 |
| 117 Clay Dr | 0.56mi | 3/2.0 (+1) | 1,163 (-4%) | 2mo | $194,000 | $167 | 55 |
| 232 Highland Rd | 0.69mi | 3/1.0 (+1) | 1,232 (+1%) | 7mo | $205,000 | $166 | 55 |
| 308 Parkridge Dr | 0.53mi | 3/1.5 (+1) | 1,125 (-8%) | 6mo | $180,000 | $160 | 50 |
| 501 Hoover Rd | 0.70mi | 3/1.0 (+1) | 1,126 (-8%) | 3mo | $138,000 | $123 | 47 |
| 115 Quail Dr | 0.58mi | 2/2.0 | 1,056 (-13%) | 1mo | $188,000 | $178 | 46 |
| 111 Dauntless Dr | 0.71mi | 2/2.0 | 1,340 (+10%) | 2mo | $217,000 | $162 | 44 |
| 230 Idlewood Rd | 0.68mi | 2/1.5 | 1,062 (-13%) | 2mo | $135,000 | $127 | 43 |
| 108 Lewis Dr | 0.66mi | 2/2.0 | 1,356 (+11%) | 5mo | $90,000 | $66 | 42 |
| 11283 Azalea Dr | 0.71mi | 3/1.0 (+1) | 1,088 (-11%) | 2mo | $205,000 | $188 | 42 |
| 332 Highland Rd | 0.68mi | 3/2.0 (+1) | 1,400 (+15%) | 3mo | $208,000 | $149 | 32 |
Match score weights: distance 35% · size 25% · config 20% · recency 20%. Top-matched comps best support the ARV.
Projected returns pro-forma
-3.0% appreciation · 7.63% rent growth · sell at horizon
- IRR
- -10.0%
- Equity multiple
- 0.62×
- Total profit
- $-16,092
- Equity at exit
- $22,365
- IRR
- 5.1%
- Equity multiple
- 1.46×
- Total profit
- $19,215
- Equity at exit
- $12,969
Cash invested: $42,000 (down + closing). Projections, not guarantees.
Landlord ↔ Tenant lean methodology
- Overall (STATE)
- 62 Landlord-Friendly
- State Pennsylvania
- 62 Landlord-Friendly · EVEN
- County
- — inherits STATE
- City
- — inherits STATE
ZIP-level market 15235
- Home prices YoY
- -34.1%
- Rents YoY
- 7.6%
- Active inventory
- 129
- Price-to-rent
- 8.8×
Monthly cashflow live
- Estimated rent
- $1,427 high interval (Pro) →
- Mortgage (P&I)
- −$787
- Tax from tax record
- −$204 /mo · $2,451/yr
- Insurance
- −$62
- Flood insurance flood zone
- −$56 /mo · $666/yr
- HOA
- −$0
- Vacancy / Maint / Mgmt
- −$300
- Net cashflow
- $19
Break-even live
Sensitivity live
| Price | -10% $104 | -5% $61 | +0% $19 | +5% $-24 | +10% $-66 |
|---|---|---|---|---|---|
| Rent | -10% $-94 | -5% $-38 | +0% $19 | +5% $75 | +10% $131 |
| Rate | -1.0pp $94 | -0.5pp $57 | base $19 | +0.5pp $-20 | +1.0pp $-60 |
UW: 25.0% down · 7.5% · 30yr · 1.5% tax · 5.0% vac · 8.0% maint · 8.0% mgmt
Financing live
Cash to close
- Down payment
- $37,500
- Closing costs
- $4,500
- Reserves months
- —
- Total cash needed
- —
Loan-product check · same deal, 3 products live
Conventional
25% down · 7.5% · 30yr
- Down + closing
- —
- Monthly P&I
- —
- Monthly cashflow
- —
- DSCR
- —
- Eligible?
- —
Personal DTI + credit; lowest rate.
DSCR
20% down · 8.5% · 30yr
- Down + closing
- —
- Monthly P&I
- —
- Monthly cashflow
- —
- DSCR
- —
- Eligible?
- —
No personal income docs; deal must DSCR.
Hard money
10% down · 12.0% · 12mo
- Down + closing
- —
- Monthly P&I
- —
- Monthly cashflow
- —
- DSCR
- —
- Eligible?
- —
Short-term bridge; refi at stabilization.
Rent comps 24 comps
| Address | Beds | Baths | Sqft | Rent | $/sqft | DOM | Units | Dist |
|---|---|---|---|---|---|---|---|---|
| 261 Universal Rd Unit 261UNIV Pittsburgh, PA | 3.0 | 1.0 | 1100 | $1,225 | $1.11 | 5d | 1 | 0.34mi |
| 127 Stowe Dr Pittsburgh, PA | 3.0 | 1.0 | 948 | $1,495 | $1.58 | 23d | 1 | 0.39mi |
| 325 Poe Dr Pittsburgh, PA | 2.0 | 1.0 | 1056 | $1,599 | $1.51 | 45d | 1 | 0.44mi |
| 11843 Joan Dr Pittsburgh, PA | 3.0 | 1.0 | 1144 | $1,500 | $1.31 | 6d | 1 | 0.48mi |
| 717 Jefferson Rd Pittsburgh, PA | 3.0 | 1.0 | 1152 | $1,295 | $1.12 | 16d | 1 | 0.56mi |
| 154 Collins Dr Pittsburgh, PA | 3.0 | 1.0 | 986 | $1,295 | $1.31 | 4d | 1 | 0.62mi |
| 124 Dauntless Dr Pittsburgh, PA | 3.0 | 1.0 | 1100 | $1,395 | $1.27 | 25d | 1 | 0.72mi |
| 279 Hazel Rd Pittsburgh, PA | 3.0 | 1.0 | 1080 | $1,732 | $1.60 | 45d | 1 | 0.83mi |
| 131 Jacob Dr Pittsburgh, PA | 3.0 | 1.0 | 1144 | $2,300 | $2.01 | 3d | 1 | 0.89mi |
| 98 Stotler Rd Penn Hills, PA | 2.0–3.0 | 1.0 | 1660 | $1,200 | $0.72 | 9d | 3 | 0.91mi |
| 62 Melvin Ct Penn Hills Township, PA | 1.0–2.0 | 1.0 | 825 | $1,549 | $1.88 | 9d | 2 | 1.00mi |
| 314 Penn Vista Dr Pittsburgh, PA | 2.0 | 1.0 | 1150 | $1,250 | $1.09 | 45d | 1 | 1.01mi |
| 641 Penny Dr Pittsburgh, PA | 3.0 | 1.5 | 1199 | $1,525 | $1.27 | 16d | 1 | 1.03mi |
| 457 Elias Dr #445 Pittsburgh, PA | 2.0 | 1.0 | 888 | $1,200 | $1.35 | 19d | 1 | 1.06mi |
| 150 Marshall Dr Pittsburgh, PA | 3.0 | 1.5 | 923 | $1,450 | $1.57 | 25d | 1 | 1.11mi |
| 175 Charleston Dr Pittsburgh, PA | 3.0 | 2.0 | 1163 | $1,799 | $1.55 | 25d | 1 | 1.19mi |
| 209 Briarwood Dr Pittsburgh, PA | 3.0 | 2.0 | 1080 | $1,500 | $1.39 | 25d | 1 | 1.20mi |
| 220 Briarwood Dr Pittsburgh, PA | 3.0 | 1.0 | 869 | $1,465 | $1.69 | 16d | 1 | 1.23mi |
| 190 Sycamore Dr Pittsburgh, PA | 1.0 | 1.0 | 748 | $924 | $1.24 | 19d | 3 | 1.37mi |
| 610 Churchill Ave Pittsburgh, PA | 3.0 | 1.0 | 1100 | $1,395 | $1.27 | 4d | 1 | 1.41mi |
| 3910 Old William Penn Hwy Penn Hills, PA | 2.0 | 1.0–2.0 | 750 | $1,175 | $1.57 | 4d | 3 | 1.42mi |
| 1160 Jefferson Rd Pittsburgh, PA | 3.0 | 1.0 | 1066 | $1,295 | $1.21 | 16d | 1 | 1.45mi |
| 3005 Laketon Rd Pittsburgh, PA | 3.0 | 1.0 | 1100 | $1,295 | $1.18 | 16d | 1 | 1.46mi |
| 1526 Edwards St Verona, PA | 3.0 | 1.0 | 1296 | $1,730 | $1.33 | 45d | 1 | 1.49mi |
Listing history 17 events
-
2026-06-21days on market $150,000 Active 27 DOM
-
2026-06-18days on market $150,000 Active 24 DOM
-
2026-06-17days on market $150,000 Active 23 DOM
-
2026-06-16days on market $150,000 Active 22 DOM
-
2026-06-15days on market $150,000 Active 21 DOM
-
2026-06-13days on market $150,000 Active 19 DOM
-
2026-06-13days on market $150,000 Active 18 DOM
-
2026-06-09days on market $150,000 Active 15 DOM
-
2026-06-08days on market $150,000 Active 14 DOM
-
2026-06-07days on market $150,000 Active 13 DOM
-
2026-06-05days on market $150,000 Active 10 DOM
-
2026-06-03days on market $150,000 Active 9 DOM
-
2026-06-02days on market $150,000 Active 8 DOM
-
2026-06-01days on market $150,000 Active 7 DOM
-
2026-05-31days on market $150,000 Active 6 DOM
-
2026-05-25$150,000 Active
-
1978-08-11soldstatus $32,500
ⓘ Source: listings_history table (triggers on properties + properties_extension) + one-shot
backfill from property_details.listing_events for pre-trigger history.
Tax reassessment forecast PA · Partial reset (capped growth)
- Current annual tax
- $2,451 · $204/mo
- Projected year-2 tax
- $2,451 · $204/mo
- Expected delta
- $0/yr ($0/mo · 0.0%)
ⓘ Screening estimate from a state-policy table — verify with the county assessor before closing.
Climate risk First Street
- Flood 8/10 Severe FEMA zone X (unshaded) · 99% chance over 30 yrs
- Wildfire 1/10 Low
- Heat 3/10 Moderate 7 d/yr ≥96°F today · 17 d/yr by 30 yrs out
- Wind 2/10 Low
- Air quality 4/10 Moderate 5 unhealthy d/yr today · 7 by 30 yrs out
Nearby sold comps map
Loading sold comps map…
Walkable amenities ~0.75 mi
Loading nearby amenities…
Taxation est. · year 1
- Rental income
- $17,128
- − Mortgage interest
- −$8,402
- − Property taxes
- −$2,451
- − Insurance
- −$1,416
- − Repairs & maintenance
- −$1,370
- − Management
- −$1,370
- − Depreciation
- −$4,364
- Taxable loss
- −$2,246
- Est. tax savings @ 24.0%
- +$539
- After-tax cash flow
- $763/yr
For passive investors: Depreciation is non-cash, so a rental often shows a tax loss while cash-flowing — sheltering income. Rental losses are passive: they offset passive income freely, and up to $25,000/yr can offset ordinary (W-2) income if you actively participate and your MAGI is under $100k (phasing out to $0 by $150k); unused losses carry forward. On sale, claimed depreciation is recaptured at up to 25%, and gains may owe capital-gains tax (a 1031 exchange can defer both). Figures are a year-1 estimate at your 24.0% rate — not tax advice; consult a CPA.
Schools (NCES district)
- District
- Penn Hills SD
- NCES district ID
- 4218590
- Math proficiency
- 13% ▼ -6.00%
- Reading proficiency
- 24% ▼ -14.00%
- Median HH income
- $47,794
- Composite
- 16.42/100
- National rank
- #9192
- State rank
- #496 of 539 in PA
Livability — Churchill
- Score
- 74/100
- State rank
- #486
- US rank
- #4477
Category grades
Schools grade is shown separately in the Schools card above.
Census & demographics
- County
- Allegheny County · 1,022,028 people
- City population
- 28,332
- Metro
- Pittsburgh, PA
- Population (ZIP)
- 33,951
- Household income
- $67,240
- Rent vs Own
- Severe rent burden
- 955.0
Population outlook (Allegheny County) Hauer SSP2
- Today (2025)
- 1,250,282 people
- By 2030
- 1,256,482 · +0.5%
- By 2040
- 1,256,318 · +0.5%
- By 2050
- 1,244,169 · -0.5%
- By 2075
- 1,197,693 · -4.2%
- By 2100
- 1,093,187 · -12.6%
Race, ethnicity, and origin ACS 2023
- Neighborhood character
- Diverse neighborhood (Simpson 0.58)
- Race & ethnicity
- White 51% Black 40% Two or more races 7% Hispanic / Latino 2%
- Common ancestry
- Romanian 5% Serbian 2% Slovak 1%
- Foreign-born
- 4% · Canada
- Languages at home
- 97% English-only · Other Indo-European 1% Spanish 1%
Political lean MEDSL · Allegheny
- 2024 margin
- Strong D (+20.3) · D 59.7% · R 39.4%
- 2008→2024 swing
- +4.8pp toward D · 2008: 15.5pp · 2024: 20.3pp
- All cycles
- 2024: D+20.3 2020: D+20.4 2016: D+16.4 2012: D+14.4 2008: D+15.5
Not yet ingested
- Civics
- —
Market trends
- HPI YoY
- ▼ -121.68%
- Current HPI
- 235.4861
- Rent YoY
- ▲ 7.63%
- Metro
- Pittsburgh, PA
- State GDP YoY
- ▲ 1.68%
- F500 in state
- 34
Industry mix (Fortune 500 HQ in PA)
| Industry | F500 HQs | Revenue |
|---|---|---|
| Healthcare | 2 | $309B |
|
||
| Insurance | 2 | $27B |
|
||
| Telecommunications / Media | 1 | $124B |
|
||
| Industrial Distribution | 1 | $22B |
|
||
| Financial Services | 1 | $20B |
|
||
| Chemicals / Materials | 1 | $18B |
|
||
Price history
+361.5% since first listed2 events — show timeline
- 2026-05-25 Listed $150,000 West Penn MLS
- 1978-08-11 Sold (Public Records) $32,500 Public Records
Property tax history
+2.0%/yrLatest (2026): $2,451 · +0.0% YoY. Source: county tax records.
Cash-flow waterfall
monthlySold comps — $/sqft
last 12 mo · ≤1 miLoading sold comps…