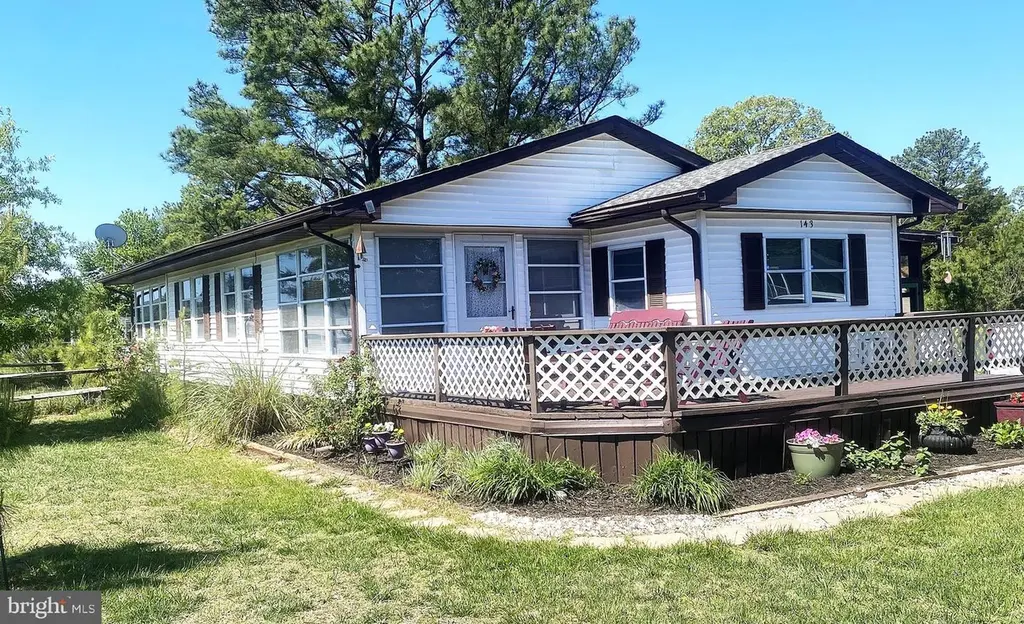
34678 Stem St Unit E-143 · Long Neck, DE
Flood risk 5/10 · Moderate
- FEMA flood zone
- X (unshaded)
- Chance of flooding over 30 yrs
- 0.44%
- Est. flood insurance / yr
- $473 – $860
Fire risk 1/10 · Minimal
- Est. fire insurance / yr
- $476 – $884
Heat risk 8/10 · Major
- Hot days now (above 101°F)
- 7 days/yr
- Hot days in 30 yrs
- 18 days/yr
Wind risk 8/10 · Major
- Chance of severe wind over 30 yrs
- 80.0%
Air-quality risk 2/10 · Minimal
- Unhealthy air days now
- 1 days/yr
- Unhealthy air days in 30 yrs
- 1 days/yr
Risk factors via First Street. Map © Google.
Why this score? — see what drove the B- grade
The composite is a weighted blend of 9 inputs, each scored 0–100. Each bar is that input's sub-score; the figure is the points it added to the 100-point composite (weight × sub-score).
- Cash flow +30.0/30.0
- 1% rule +10.0/10.0
- DSCR +10.0/10.0
- ARV discount +6.2/15.0
- Livability +3.5/5.0
- Schools +2.9/10.0
- Rent growth +2.5/5.0
- Condition / age +2.2/5.0
- Appreciation +0.0/10.0
$79,000
🖨 Deal sheet (PDF) 📄 Offer letter ✓ Due diligence
Key facts
- 4 parking spots
- Community pool
- Built 1971
Neighborhood map
What this means for you Summary
Snapshot
- This is a 3-bed/2.0-bath single-family listed at $79k. Condition is rated fair.
Deal economics
- At list price, monthly cash flow is $1k ($15k/yr) — positive.
- The deal already cash-flows at list — no discount required.
- Meets the 1% rule at list price ($2k rent vs $79k).
- Recommended offer: $70k (12.0% below list) — sets the bar for market timing.
- Cap rate 25.0% vs local median 3.4% in Long Neck — top-decile yield for the area; either an underpriced asset or a hidden risk that comps aren't pricing in. Stress-test before assuming the spread holds.
Location & tenants
- Location reads 69/100 on livability (#30 in DE) — a middle-class / working-renter tenant base. Strengths: cost of living A+, housing A+, crime A-; Watch: employment D+, amenities F, commute F.
- Indian River School District (rural): math 25% / reading 41% proficiency, ranked #14 of 26 in DE (top 54%) — families likely to look elsewhere, expect single-tenant / working-renter base with shorter leases.
- Zoned schools: Long Neck Elementary School (math 22% / reading 35%, grade F, #57 of 105 statewide, top 55%, 693 students, 0% FRL); Millsboro Middle School (math 24% / reading 42%, grade F, #14 of 36 statewide, top 37%, 771 students, 0% FRL); Sussex Central High School (math 23% / reading 42%, grade F, #24 of 40 statewide, top 59%, 2,039 students, 0% FRL) — zoned schools average 0% FRL vs 49% district-wide (49 pts lower); this property's tenant base skews higher-income than the district average.
- Market conditions: 870 active listings in the ZIP; 1 comparable units currently listed for rent nearby; solid renter incomes; 4,354 units permitted in Sussex County in 2024 (344 in 5+ unit buildings).
- This rent runs 34% of the median local income ($78k/yr) — at the standard rent-burdened threshold; future hikes will face affordability resistance.
Forward outlook
- Local home prices are declining (-3.0%/yr); year-one equity from $546 of loan paydown is wiped out by about $2k of value loss. Plan a longer hold.
- Sussex County population projected at +25% by 2050 — long-run rental-demand tailwind backs the buy-and-hold thesis.
- At projected returns (-3.0% appreciation + 3.0% rent growth), your $22k cash investment doubles in ~2 years — after that, you're playing with house money.
Negotiation context
- It's been on market 163 days — a 12% lower offer ($70k) is reasonable based on typical stale-listing flexibility.
- 2 sale attempts with the ask held roughly flat each time — persistent listings suggest the price (not the market) is what's stuck; bring a comps-based counter.
Risks & watch-outs
- Climate carrying-cost: moderate flood risk; severe wind risk, 80% chance of damaging wind over 30y; extreme-heat days projected 7→18/yr by 2055 (HVAC capex compounding) — expect insurance premiums to compound above CPI over the hold.
Questions for the listing agent
- It's been on market 163 days. Have you received any prior offers? Is the seller open to a 12% concession, seller financing, or rate buy-down credit?
- Have any recent inspections been done? Can we get a copy of the seller's disclosures and any deferred-maintenance estimates?
- Built in 1971 — when were the roof, HVAC, electrical panel, plumbing, and water heater last replaced?
- Why hasn't it sold? Are there any deal-killer items the seller is aware of (foundation, flood, title, zoning, code violations)?
- Is there a deadline driving the sale (1031 exchange, divorce, estate, relocation)? That informs how much negotiation room exists.
- Schools are F-rated, which usually means shorter tenancies and higher turnover. Who's the typical renter profile here, and what's been the actual vacancy rate?
- What's the average days-on-market for RENTAL listings here right now (not sales)? A rising rental-DOM trend means longer vacancies and softer asking-rent achievability than the comps imply.
- What's the recent tenant-quality profile in this submarket — average credit score on applications, eviction rate, late-payment / NSF rate, and stable-employment percentage? A property-management company in the area should have these aggregated.
- How much new for-sale + rental construction is in the pipeline within 1–3 miles? Heavy new supply typically softens prices + rents 12–24 months out; constrained supply supports both.
Investment metrics
- 1% rule
- 2.85% ✓
- Cap rate
- 25.00%
- Cash-on-cash
- 66.80%
- DSCR
- 3.97
- GRM
- 2.9
CMA / ARV
- ARV (median comp)
- $76,724
- List price
- $79,000
- Delta
- 2.97%
- Verdict
- FAIR
- Comps
- 2 within 1.0 mi
Show comp detail 12 sales within ~0.75 mi
| Address | Dist | Beds/Ba | Sqft | Sold | Price | $/sf | Match |
|---|---|---|---|---|---|---|---|
| 34635 Deck St Unit E-323 | 0.14mi | 4/2.0 (+1) | 1,168 (-2%) | 3mo | $134,900 | $115 | 83 |
| 34401 Mallard Rd #502 | 0.36mi | 3/2.0 | 1,200 (+1%) | 3mo | $99,900 | $83 | 79 |
| 34995 Keelson St Unit E-274 | 0.47mi | 3/2.0 | 1,232 (+4%) | 3mo | $158,500 | $129 | 69 |
| 26990 Wood Duck Rd #52697 | 0.27mi | 3/2.0 | 1,334 (+12%) | 1mo | $180,000 | $135 | 66 |
| 34249 Hillenwood Rd #48450 | 0.55mi | 3/2.0 | 1,152 (-3%) | 7mo | $239,000 | $207 | 64 |
| 26979 Flipper Rd #50027 | 0.34mi | 3/2.0 | 1,350 (+14%) | 9mo | $127,400 | $94 | 54 |
| 34144 Indian Cabin Creek Rd #259 | 0.62mi | 3/2.0 | 1,068 (-10%) | 4mo | $95,000 | $89 | 51 |
| 34848 Halyard St Unit E-431 | 0.42mi | 3/2.0 | 1,366 (+15%) | 5mo | $273,176 | $200 | 51 |
| 26930 White House Rd #53947 | 0.68mi | 2/2.0 (-1) | 1,249 (+5%) | 8mo | $175,000 | $140 | 48 |
| 26535 Woodchuck Ln Unit E-864 | 0.59mi | 2/2.0 (-1) | 1,260 (+6%) | 11mo | $153,000 | $121 | 48 |
| 35037 W Harbor Dr #20893 | 0.52mi | 2/1.0 (-1) | 1,100 (-7%) | 11mo | $62,000 | $56 | 45 |
| 35458 E River Dr | 0.70mi | 2/2.0 (-1) | 1,032 (-13%) | 7mo | $159,000 | $154 | 35 |
Match score weights: distance 35% · size 25% · config 20% · recency 20%. Top-matched comps best support the ARV.
Projected returns pro-forma
-3.0% appreciation · 3.0% rent growth · sell at horizon
- IRR
- 66.1%
- Equity multiple
- 3.97×
- Total profit
- $65,662
- Equity at exit
- $11,779
- IRR
- 70.4%
- Equity multiple
- 8.16×
- Total profit
- $158,307
- Equity at exit
- $6,830
Cash invested: $22,120 (down + closing). Projections, not guarantees.
Landlord ↔ Tenant lean methodology
- Overall (STATE)
- 70 Landlord-Friendly
- State Delaware
- 70 Landlord-Friendly · D+7
- County
- — inherits STATE
- City
- — inherits STATE
ZIP-level market 19966
- Home prices YoY
- -6.4%
- Active inventory
- 870
- Price-to-rent
- 2.9×
Monthly cashflow live
- Estimated rent
- $2,250 medium interval (Pro) →
- Mortgage (P&I)
- −$414
- Tax est. 1.5%
- −$99 /mo · $1,185/yr
- Insurance
- −$33
- HOA
- −$0
- Vacancy / Maint / Mgmt
- −$472
- Net cashflow
- $1,231
Break-even live
Sensitivity live
| Price | -10% $1,286 | -5% $1,259 | +0% $1,231 | +5% $1,204 | +10% $1,177 |
|---|---|---|---|---|---|
| Rent | -10% $1,054 | -5% $1,143 | +0% $1,231 | +5% $1,320 | +10% $1,409 |
| Rate | -1.0pp $1,271 | -0.5pp $1,252 | base $1,231 | +0.5pp $1,211 | +1.0pp $1,190 |
UW: 25.0% down · 7.5% · 30yr · 1.5% tax · 5.0% vac · 8.0% maint · 8.0% mgmt
Financing live
Cash to close
- Down payment
- $19,750
- Closing costs
- $2,370
- Reserves months
- —
- Total cash needed
- —
Loan-product check · same deal, 3 products live
Conventional
25% down · 7.5% · 30yr
- Down + closing
- —
- Monthly P&I
- —
- Monthly cashflow
- —
- DSCR
- —
- Eligible?
- —
Personal DTI + credit; lowest rate.
DSCR
20% down · 8.5% · 30yr
- Down + closing
- —
- Monthly P&I
- —
- Monthly cashflow
- —
- DSCR
- —
- Eligible?
- —
No personal income docs; deal must DSCR.
Hard money
10% down · 12.0% · 12mo
- Down + closing
- —
- Monthly P&I
- —
- Monthly cashflow
- —
- DSCR
- —
- Eligible?
- —
Short-term bridge; refi at stabilization.
Rent comps 1 comps
| Address | Beds | Baths | Sqft | Rent | $/sqft | DOM | Units | Dist |
|---|---|---|---|---|---|---|---|---|
| 35829 S Gloucester Cir Unit 35829 Long Neck, DE | 3.0 | 2.5 | 1500 | $1,995 | $1.33 | 15d | 1 | 0.86mi |
Listing history 18 events
-
2026-06-21days on market $79,000 Active 163 DOM
-
2026-06-18days on market $79,000 Active 160 DOM
-
2026-06-17days on market $79,000 Active 159 DOM
-
2026-06-16days on market $79,000 Active 158 DOM
-
2026-06-15days on market $79,000 Active 157 DOM
-
2026-06-14days on market $79,000 Active 155 DOM
-
2026-06-13days on market $79,000 Active 154 DOM
-
2026-06-10days on market $79,000 Active 152 DOM
-
2026-06-09days on market $79,000 Active 151 DOM
-
2026-06-08days on market $79,000 Active 150 DOM
-
2026-06-07days on market $79,000 Active 149 DOM
-
2026-06-02days on market $79,000 Active 144 DOM
-
2026-06-01days on market $79,000 Active 143 DOM
-
2026-05-31days on market $79,000 Active 142 DOM
-
2026-05-30days on market $79,000 Active 141 DOM
-
2026-01-09status Active
-
2026-01-08$79,000 Active
-
2026-01-08historical
ⓘ Source: listings_history table (triggers on properties + properties_extension) + one-shot
backfill from property_details.listing_events for pre-trigger history.
Climate risk First Street
- Flood 5/10 Major FEMA zone X (unshaded) · 44% chance over 30 yrs
- Wildfire 1/10 Low
- Heat 8/10 Severe 7 d/yr ≥101°F today · 18 d/yr by 30 yrs out
- Wind 8/10 Severe 80% chance of damaging wind over 30 yrs
- Air quality 2/10 Low 1 unhealthy d/yr today · 1 by 30 yrs out
Nearby sold comps map
Loading sold comps map…
Walkable amenities ~0.75 mi
Loading nearby amenities…
Taxation est. · year 1
- Rental income
- $26,998
- − Mortgage interest
- −$4,425
- − Property taxes
- −$1,185
- − Insurance
- −$395
- − Repairs & maintenance
- −$2,160
- − Management
- −$2,160
- − Depreciation
- −$2,298
- Taxable income
- $14,375
- Est. tax owed @ 24.0%
- −$3,450
- After-tax cash flow
- $11,327/yr
For passive investors: Depreciation is non-cash, so a rental often shows a tax loss while cash-flowing — sheltering income. Rental losses are passive: they offset passive income freely, and up to $25,000/yr can offset ordinary (W-2) income if you actively participate and your MAGI is under $100k (phasing out to $0 by $150k); unused losses carry forward. On sale, claimed depreciation is recaptured at up to 25%, and gains may owe capital-gains tax (a 1031 exchange can defer both). Figures are a year-1 estimate at your 24.0% rate — not tax advice; consult a CPA.
Condition & rehab AI · 12 photos
The home requires moderate repairs and maintenance to improve its condition and value. Focus on the deck, flooring, and exterior siding for the highest impact.
Repairs flagged
- Moderate deck — Significant wear and discoloration
- Moderate flooring — Worn hardwood flooring
- Minor interior walls — Some paint wear
Value-add opportunities
- Resale Paint exterior siding — Enhances curb appeal
- Resale Replace worn hardwood flooring — Improves home's aesthetic
- Rental Replace worn hardwood flooring — Improves home's aesthetic
- Resale Paint interior walls — Enhances home's aesthetic
- Rental Replace worn hardwood flooring — Improves home's aesthetic
Renovation cost estimate screening
| Repair item | Severity | Est. cost |
|---|---|---|
| deck · Significant wear and discoloration | Moderate | $3,000–15,000 |
| flooring · Worn hardwood flooring | Moderate | $3,000–15,000 |
| interior walls · Some paint wear | Minor | $500–3,000 |
| Total estimated repair cost · 3 items | $6,500–33,000 |
Value-add ROI direction
- Resale Paint exterior siding — Enhances curb appeal ↑
- Resale Replace worn hardwood flooring — Improves home's aesthetic ↑
- Rental Replace worn hardwood flooring — Improves home's aesthetic ↑
- Resale Paint interior walls — Enhances home's aesthetic ↑
- Rental Replace worn hardwood flooring — Improves home's aesthetic ↑
ⓘ Cost ranges are severity-bucket heuristics (US national rule-of-thumb). Get contractor quotes + a written scope before underwriting a rehab budget.
Schools (NCES district)
- District
- Indian River School District
- NCES district ID
- 1000680
- Math proficiency
- 25% ▼ -27.00%
- Reading proficiency
- 41% ▼ -17.00%
- Median HH income
- $53,838
- Composite
- 28.99/100
- National rank
- #6620
- State rank
- #14 of 26 in DE
Livability — Long Neck
- Score
- 69/100
- State rank
- #30
- US rank
- #8720
Category grades
Schools grade is shown separately in the Schools card above.
Census & demographics
- Census place
- Long Neck, DE
- County
- Sussex County · 82,708 people
- Metro
- Salisbury, MD-DE
- Population (ZIP)
- 35,884
- Household income
- $78,305
- Rent vs Own
- Severe rent burden
- 464.0
Population outlook (Sussex County) Hauer SSP2
- Today (2025)
- 248,853 people
- By 2030
- 264,464 · +6.3%
- By 2040
- 290,980 · +16.9%
- By 2050
- 311,259 · +25.1%
- By 2075
- 352,488 · +41.6%
- By 2100
- 367,406 · +47.6%
Race, ethnicity, and origin ACS 2023
- Neighborhood character
- Predominantly White (74%)
- Race & ethnicity
- White 74% Hispanic / Latino 11% Black 8% Two or more races 7% Native American 3% Asian 1%
- Hispanic origin (detail)
- Mexican 3%
- Common ancestry
- Romanian 4% Slovak 2% Serbian 1%
- Foreign-born
- 8% · Canada, China
- Languages at home
- 88% English-only · Spanish 9% Other Indo-European 1%
Political lean MEDSL · Sussex
- 2024 margin
- R (+11.0) · D 43.9% · R 54.9% · Other 1.2%
- 2008→2024 swing
- -2.4pp toward R · 2008: -8.6pp · 2024: -11.0pp
- All cycles
- 2024: R+11.0 2020: R+11.2 2016: R+22.0 2012: R+13.0 2008: R+8.6
Not yet ingested
- Civics
- —
Market trends
- HPI YoY
- ▼ -18.26%
- Current HPI
- 268.5609
- Rent YoY
- —
- Metro
- Salisbury, MD-DE
- State GDP YoY
- —
- F500 in state
- 0
Price history
3 events — show timeline
- 2026-01-09 Relisted — BRIGHT MLS
- 2026-01-08 Listing Removed — BRIGHT MLS
- 2026-01-08 Listed $79,000 BRIGHT MLS
Cash-flow waterfall
monthlySold comps — $/sqft
last 12 mo · ≤1 miLoading sold comps…