17614 Elwood Junction Rd · Neosho, MO
Flood risk 1/10 · Minimal
- FEMA flood zone
- X (unshaded)
- Chance of flooding over 30 yrs
- 0.0%
- Est. flood insurance / yr
- $507 – $1,088
Fire risk 6/10 · Moderate
- Est. fire insurance / yr
- $1,054 – $1,958
Heat risk 4/10 · Minor
- Hot days now (above 106°F)
- 7 days/yr
- Hot days in 30 yrs
- 20 days/yr
Wind risk 2/10 · Minimal
- Chance of severe wind over 30 yrs
- 2.0%
Air-quality risk 2/10 · Minimal
- Unhealthy air days now
- 1 days/yr
- Unhealthy air days in 30 yrs
- 1 days/yr
Risk factors via First Street. Map © Google.
Why this score? — see what drove the F grade
The composite is a weighted blend of 9 inputs, each scored 0–100. Each bar is that input's sub-score; the figure is the points it added to the 100-point composite (weight × sub-score).
- ARV discount +7.5/15.0
- Livability +3.6/5.0
- Schools +3.5/10.0
- Cash flow +3.2/30.0
- Rent growth +2.5/5.0
- Condition / age +2.5/5.0
- 1% rule +0.0/10.0
- DSCR +0.0/10.0
- Appreciation +0.0/10.0
$325,000
🖨 Deal sheet 📄 Offer letter ✓ Due diligence
Listing remarks MLS
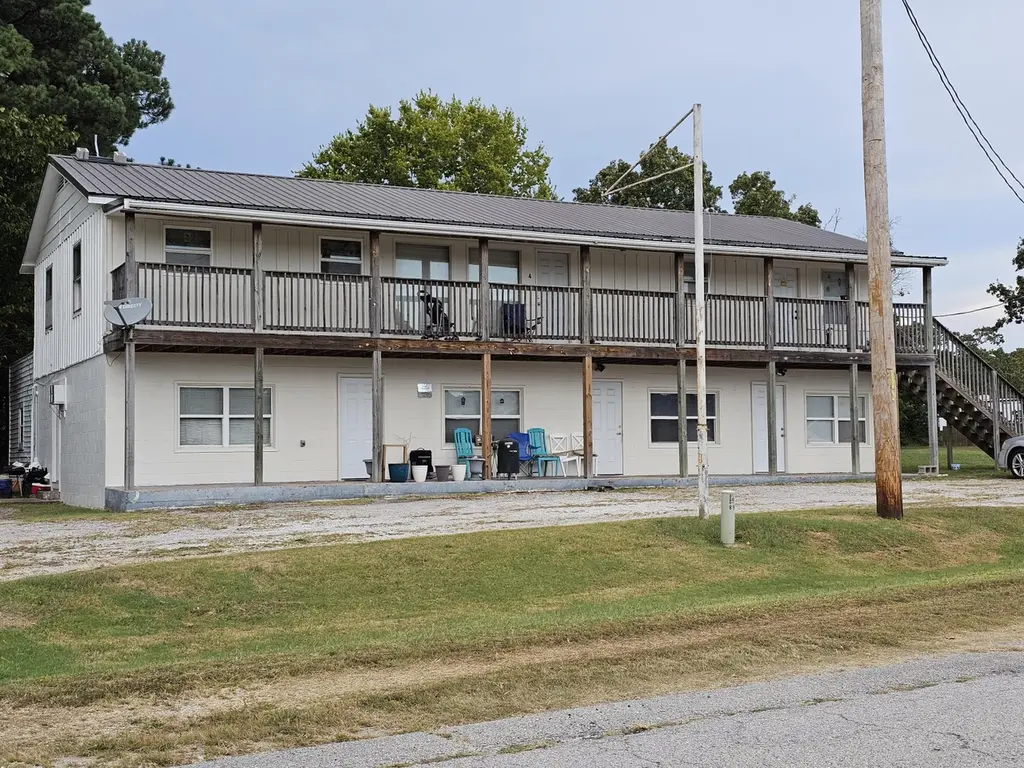
5 unit Apartment complex outside of Neosho near Hwy 59 for easy commuting. Located down a dead end road. Combined rent of $3250 monthly. All units metered separately for electric plus well unit (6 total). Landlord pays water and trash on all units. 3 units set up on HUD payments. Great income opportunity. All units currently rented. Lot is nearly half an acre. Unit 4 is 3 BD, all other units are 1BD 1BA.
Key facts
- Built 1967
- Listed 23 days
Property features AI
Finance
- Financial info: Annual tax noted
Exterior
- Utilities: Septic tank
- Home design: Residential income property (apartment)
- Construction: Metal roof
- Exterior features: No fencing; Lot dimensions approximately 172 x 107 x 120 x 195
Interior
- Flooring: Carpet; Vinyl
- Heating & cooling: Central heating (electric); Wall unit cooling
- Interior features: Carpet and vinyl flooring
Neighborhood map
What this means for you Summary
Snapshot
- This is a 2-bed/5.0-bath townhouse listed at $325k.
Deal economics
- At list price, monthly cash flow is $-1k ($-12k/yr) — negative.
- To cash-flow at today's rent, offer at most $145k (55.4% below list).
- To meet the 1% rule (rent ≥ 1% of price), the offer needs to be $117k (64.1% below list).
- Recommended offer: $117k (64.1% below list) — sets the bar for 1% rule.
Location & tenants
- Location reads 71/100 on livability (#103 in MO) — a middle-class / working-renter tenant base. Strengths: cost of living A+, housing A+, health & safety A+; Watch: schools D, employment D, amenities F.
- Neosho School District (town): math 36% / reading 48% proficiency, ranked #125 of 324 in MO (top 39%) — families likely to look elsewhere, expect single-tenant / working-renter base with shorter leases.
- Market conditions: 199 active listings in the ZIP; 110 units permitted in Newton County in 2024 (40 in 5+ unit buildings).
Forward outlook
- Local home prices are declining (-3.0%/yr); year-one equity from $2k of loan paydown is wiped out by about $10k of value loss. Plan a longer hold.
- Newton County population projected to shrink 7% by 2050 — rents likely to lag national; underwrite the cash flow, not the appreciation.
Negotiation context
- It's been on market 24 days — a 2% lower offer ($320k) is reasonable based on typical stale-listing flexibility.
- 4 sale attempts since 2y ago with the ask held roughly flat each time — persistent listings suggest the price (not the market) is what's stuck; bring a comps-based counter.
Risks & watch-outs
- Climate carrying-cost: major wildfire risk — expect insurance premiums to compound above CPI over the hold.
Questions for the listing agent
- What do current leases actually rent for vs. the listed asking? Can we see a recent rent roll and the last 12 months of T-12 income?
- Built in 1967 — when were the roof, HVAC, electrical panel, plumbing, and water heater last replaced?
- Is there a deadline driving the sale (1031 exchange, divorce, estate, relocation)? That informs how much negotiation room exists.
- Schools are D-rated, which usually means shorter tenancies and higher turnover. Who's the typical renter profile here, and what's been the actual vacancy rate?
- The area grade is low — what's the realistic commute time and amenity access for the typical tenant pool here? Any planned neighborhood developments (good or bad) we should know about?
- What's the average days-on-market for RENTAL listings here right now (not sales)? A rising rental-DOM trend means longer vacancies and softer asking-rent achievability than the comps imply.
- What's the recent tenant-quality profile in this submarket — average credit score on applications, eviction rate, late-payment / NSF rate, and stable-employment percentage? A property-management company in the area should have these aggregated.
- How much new for-sale + rental construction is in the pipeline within 1–3 miles? Heavy new supply typically softens prices + rents 12–24 months out; constrained supply supports both.
Investment metrics
- 1% rule
- 0.36% ✗
- Cap rate
- 2.53%
- Cash-on-cash
- -13.45%
- DSCR
- 0.40
- GRM
- 23.2
CMA / ARV
No comps found within radius.
Projected returns pro-forma
-3.0% appreciation · 3.0% rent growth · sell at horizon
- IRR
- -41.7%
- Equity multiple
- -0.29×
- Total profit
- $-117,778
- Equity at exit
- $48,459
- IRR
- -70.8%
- Equity multiple
- -1.05×
- Total profit
- $-186,871
- Equity at exit
- $28,100
Cash invested: $91,000 (down + closing). Projections, not guarantees.
Landlord ↔ Tenant lean methodology
- Overall (STATE)
- 81 Strongly Landlord-Friendly
- State Missouri
- 81 Strongly Landlord-Friendly · R+10
- County
- — inherits STATE
- City
- — inherits STATE
ZIP-level market 64850
- Home prices YoY
- -5.1%
- Active inventory
- 199
- Price-to-rent
- 23.2×
Monthly cashflow live
- Estimated rent
- $1,168 medium interval (Pro) →
- Mortgage (P&I)
- −$1,704
- Tax from tax record
- −$103 /mo · $1,234/yr
- Insurance
- −$135
- HOA
- −$0
- Vacancy / Maint / Mgmt
- −$245
- Net cashflow
- $-1,020
Break-even live
UW: 25.0% down · 7.5% · 30yr · 1.5% tax · 5.0% vac · 8.0% maint · 8.0% mgmt
Financing live
Cash to close
- Down payment
- $81,250
- Closing costs
- $9,750
- Reserves months
- —
- Total cash needed
- —
Loan-product check · same deal, 3 products live
Conventional
25% down · 7.5% · 30yr
- Down + closing
- —
- Monthly P&I
- —
- Monthly cashflow
- —
- DSCR
- —
- Eligible?
- —
Personal DTI + credit; lowest rate.
DSCR
20% down · 8.5% · 30yr
- Down + closing
- —
- Monthly P&I
- —
- Monthly cashflow
- —
- DSCR
- —
- Eligible?
- —
No personal income docs; deal must DSCR.
Hard money
10% down · 12.0% · 12mo
- Down + closing
- —
- Monthly P&I
- —
- Monthly cashflow
- —
- DSCR
- —
- Eligible?
- —
Short-term bridge; refi at stabilization.
Listing history 23 events
-
2026-06-19days on market $325,000 Active 24 DOM
-
2026-06-18days on market $325,000 Active 23 DOM
-
2026-06-17days on market $325,000 Active 22 DOM
-
2026-06-16days on market $325,000 Active 21 DOM
-
2026-06-15days on market $325,000 Active 20 DOM
-
2026-06-14days on market $325,000 Active 18 DOM
-
2026-06-13days on market $325,000 Active 17 DOM
-
2026-06-10days on market $325,000 Active 15 DOM
-
2026-06-09days on market $325,000 Active 14 DOM
-
2026-06-08days on market $325,000 Active 13 DOM
-
2026-06-07days on market $325,000 Active 12 DOM
-
2026-06-05days on market $325,000 Active 9 DOM
-
2026-06-02days on market $325,000 Active 7 DOM
-
2026-06-01days on market $325,000 Active 6 DOM
-
2026-05-31days on market $325,000 Active 5 DOM
-
2026-05-30days on market $325,000 Active 4 DOM
-
2026-05-27$325,000 Active 407-char remark
Show marketing remark (407 chars)
5 unit Apartment complex outside of Neosho near Hwy 59 for easy commuting. Located down a dead end road. Combined rent of $3250 monthly. All units metered separately for electric plus well unit (6 total). Landlord pays water and trash on all units. 3 units set up on HUD payments. Great income opportunity. All units currently rented. Lot is nearly half an acre. Unit 4 is 3 BD, all other units are 1BD 1BA.
-
2026-05-27$325,000 Active
Show marketing remark (407 chars)
5 unit Apartment complex outside of Neosho near Hwy 59 for easy commuting. Located down a dead end road. Combined rent of $3250 monthly. All units metered separately for electric plus well unit (6 total). Landlord pays water and trash on all units. 3 units set up on HUD payments. Great income opportunity. All units currently rented. Lot is nearly half an acre. Unit 4 is 3 BD, all other units are 1BD 1BA.
-
2025-01-28$309,500 Active
-
2024-11-22price $319,500
-
2024-11-22price $319,500
-
2024-09-19$350,000 Active
-
2020-01-15soldstatus
ⓘ Source: listings_history table (triggers on properties + properties_extension) + one-shot
backfill from property_details.listing_events for pre-trigger history.
Tax reassessment forecast MO · Resets to sale price
- Current annual tax
- $1,234 · $103/mo
- Projected year-2 tax
- $3,152 · $263/mo
- Expected delta
- +$1,919/yr (+$160/mo · 155.5%)
ⓘ Screening estimate from a state-policy table — verify with the county assessor before closing.
Climate risk First Street
- Flood 1/10 Low FEMA zone X (unshaded) · 0% chance over 30 yrs
- Wildfire 6/10 Major
- Heat 4/10 Moderate 7 d/yr ≥106°F today · 20 d/yr by 30 yrs out
- Wind 2/10 Low 2% chance of damaging wind over 30 yrs
- Air quality 2/10 Low 1 unhealthy d/yr today · 1 by 30 yrs out
Nearby sold comps map
Loading sold comps map…
Walkable amenities ~0.75 mi
Loading nearby amenities…
Taxation est. · year 1
- Rental income
- $14,018
- − Mortgage interest
- −$18,205
- − Property taxes
- −$1,234
- − Insurance
- −$1,625
- − Repairs & maintenance
- −$1,121
- − Management
- −$1,121
- − Depreciation
- −$9,455
- Taxable loss
- −$18,743
- Est. tax savings @ 24.0%
- +$4,498
- After-tax cash flow
- $-7,738/yr
For passive investors: Depreciation is non-cash, so a rental often shows a tax loss while cash-flowing — sheltering income. Rental losses are passive: they offset passive income freely, and up to $25,000/yr can offset ordinary (W-2) income if you actively participate and your MAGI is under $100k (phasing out to $0 by $150k); unused losses carry forward. On sale, claimed depreciation is recaptured at up to 25%, and gains may owe capital-gains tax (a 1031 exchange can defer both). Figures are a year-1 estimate at your 24.0% rate — not tax advice; consult a CPA.
Schools (NCES district)
- District
- Neosho School District
- NCES district ID
- 2921810
- Math proficiency
- 36% ▬ 0.00%
- Reading proficiency
- 48% ▲ 2.00%
- Median HH income
- $40,574
- Composite
- 35.21/100
- National rank
- #4987
- State rank
- #125 of 324 in MO
Livability — Neosho
- Score
- 71/100
- State rank
- #103
- US rank
- #6875
Category grades
Schools grade is shown separately in the Schools card above.
Census & demographics
- Population (ZIP)
- 25,355
Population outlook (Newton County) Hauer SSP2
- Today (2025)
- 59,151 people
- By 2030
- 58,961 · -0.3%
- By 2040
- 57,609 · -2.6%
- By 2050
- 54,775 · -7.4%
- By 2075
- 46,140 · -22.0%
- By 2100
- 34,348 · -41.9%
Race, ethnicity, and origin ACS 2023
- Neighborhood character
- Predominantly White (77%)
- Race & ethnicity
- White 77% Two or more races 12% Hispanic / Latino 9% Pacific Islander 2% Native American 2% Asian 2% Black 1%
- Hispanic origin (detail)
- Mexican 5%
- Common ancestry
- Slovak 2% Italian 1% Scottish 1%
- Foreign-born
- 6% · Canada
- Languages at home
- 90% English-only · Spanish 6% Other Asian/Pacific 3%
Political lean MEDSL · Newton
- 2024 margin
- Solid R (+58.6) · D 20.2% · R 78.8% · Other 1.0%
- 2008→2024 swing
- -18.5pp toward R · 2008: -40.1pp · 2024: -58.6pp
- All cycles
- 2024: R+58.6 2020: R+57.4 2016: R+58.7 2012: R+46.9 2008: R+40.1
Not yet ingested
- Civics
- —
Market trends
- HPI YoY
- ▼ -15.98%
- Current HPI
- 295.9911
- Rent YoY
- —
- Metro
- —
- State GDP YoY
- ▲ 1.84%
- F500 in state
- 20
Industry mix (Fortune 500 HQ in MO)
| Industry | F500 HQs | Revenue |
|---|---|---|
| Healthcare | 1 | $163B |
|
||
| Insurance | 1 | $21B |
|
||
| Industrial Technology | 1 | $17B |
|
||
| Retail | 1 | $16B |
|
||
| Industrial Distribution | 1 | $10B |
|
||
| Utilities | 1 | $9B |
|
||
Price history
-7.1% since first listed7 events — show timeline
- 2026-05-27 Listed $325,000 SOMO
- 2026-05-27 Listed $325,000 OGAR
- 2025-01-28 Listed $309,500 SOMO
- 2024-11-22 Price Changed $319,500 OGAR
- 2024-11-22 Price Changed $319,500 SOMO
- 2024-09-19 Listed $350,000 SOMO
- 2020-01-15 Sold (Public Records) — Public Records
Property tax history
+1.7%/yrLatest (2025): $1,234 · +0.2% YoY. Source: county tax records.
Cash-flow waterfall
monthlySold comps — $/sqft
last 12 mo · ≤1 miLoading sold comps…