 🌊 Lakefront
10802 Bonapartes Gull · Estero, FL
Flood risk 4/10 · Minor
- FEMA flood zone
- AH
- Chance of flooding over 30 yrs
- 0.13%
- Est. flood insurance / yr
- $1,142 – $2,507
Fire risk 5/10 · Moderate
- Est. fire insurance / yr
- $947 – $1,759
Heat risk 9/10 · Severe
- Hot days now (above 107°F)
- 7 days/yr
- Hot days in 30 yrs
- 27 days/yr
Wind risk 10/10 · Severe
- Chance of severe wind over 30 yrs
- 99.0%
Air-quality risk 3/10 · Minor
- Unhealthy air days now
- 2 days/yr
- Unhealthy air days in 30 yrs
- 2 days/yr
Risk factors via First Street. Map © Google.
Why this score? — see what drove the B grade
The composite is a weighted blend of 9 inputs, each scored 0–100. Each bar is that input's sub-score; the figure is the points it added to the 100-point composite (weight × sub-score).
- Cash flow +30.0/30.0
- ARV discount +13.7/15.0
- DSCR +10.0/10.0
- 1% rule +7.8/10.0
- Schools +4.1/10.0
- Livability +4.0/5.0
- Condition / age +2.5/5.0
- Rent growth +2.1/5.0
- Appreciation +0.0/10.0
$167,000
🖨 Deal sheet (PDF) 📄 Offer letter ✓ Due diligence
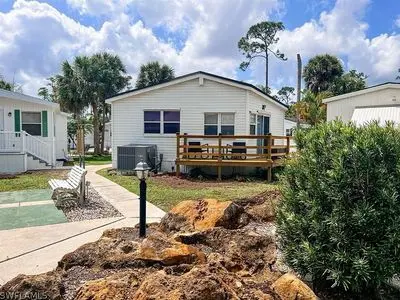
Listing remarks
Find your piece of paradise in this gem of a community! Corkscrew Woodlands is an exclusive gated community for those 55 and older looking to enjoy the best of Florida living! This active community is loaded with amenities! Enjoy the lakefront lap pool, hot tub, and fishing pier. Paddle-boat or kayak on the 23-acre lake. Spot wildlife on the miles of nature trails, golf cart bridges and canals throughout the community, including a butterfly garden and 1/2 mile wooded nature loop. This bustling community hosts Live Music, Entertainment, Sporting and Social events, something for everyone! This home features two master suites, one with laundry and the other with a large walk in closet. Vaulted
Key facts
- Gated community
- Fishing pier
- Wooded nature loop
Tags
Neighborhood map
What this means for you Summary
Snapshot
- This is a 2-bed/2.0-bath manufactured listed at $167k.
Deal economics
- At list price, monthly cash flow is $513 ($6k/yr) — positive.
- The deal already cash-flows at list — no discount required.
- Meets the 1% rule at list price ($2k rent vs $167k).
- Recommended offer: $162k (3.0% below list) — sets the bar for market timing.
- Cap rate 11.1% vs local median 3.4% in Estero — top-decile yield for the area; either an underpriced asset or a hidden risk that comps aren't pricing in. Stress-test before assuming the spread holds.
Location & tenants
- Location reads 79/100 on livability (#149 in FL, #2,242 nationally) — a middle-class / working-renter tenant base. Strengths: crime A+, employment A+, housing A+; Watch: amenities F, commute F, cost of living D-.
- Lee (suburban): math 47% / reading 50% proficiency, ranked #42 of 73 in FL (top 58%) — families likely to look elsewhere, expect single-tenant / working-renter base with shorter leases.
- Zoned schools: Pinewoods Elementary School (math 81% / reading 74%, grade A, #163 of 2,144 statewide, top 8%, 1,089 students, 25% FRL); Lexington Middle School (math 55% / reading 54%, grade B-, #183 of 571 statewide, top 34%, 1,138 students, 44% FRL); South Fort Myers High School (math 23% / reading 30%, grade F, #489 of 667 statewide, top 74%, 1,917 students, 50% FRL) — zoned schools average 39% FRL vs 57% district-wide (18 pts lower); this property's tenant base skews higher-income than the district average.
- Market conditions: Rents soft (-1.4%/yr); 675 active listings in the ZIP; 1 comparable units currently listed for rent nearby; solid renter incomes; 15,411 units permitted in Lee County in 2024 (4,686 in 5+ unit buildings).
Forward outlook
- Local home prices are declining (-3.0%/yr); year-one equity from $1k of loan paydown is wiped out by about $5k of value loss. Plan a longer hold.
- Lee County population projected at +44% by 2050 — long-run rental-demand tailwind backs the buy-and-hold thesis.
Negotiation context
- It's been on market 40 days — a 3% lower offer ($162k) is reasonable based on typical stale-listing flexibility.
- 8 sale attempts since 13y ago with the ask held roughly flat each time — persistent listings suggest the price (not the market) is what's stuck; bring a comps-based counter.
- Current owner paid $99k; list at $167k implies a 69% gain — meaningful room to come down on a strong offer.
Risks & watch-outs
- Watch-outs: flood insurance adds $152/mo.
- Climate carrying-cost: in FEMA flood zone AH (mandatory federal flood insurance); severe wind risk, 99% chance of damaging wind over 30y; moderate wildfire risk; extreme-heat days projected 7→27/yr by 2055 (HVAC capex compounding) — expect insurance premiums to compound above CPI over the hold.
Questions for the listing agent
- It's been on market 40 days. Have you received any prior offers? Is the seller open to a 3% concession, seller financing, or rate buy-down credit?
- What's the actual annual flood-insurance premium (NFIP or private), and is the property in a SFHA with mandatory coverage?
- Is there a deadline driving the sale (1031 exchange, divorce, estate, relocation)? That informs how much negotiation room exists.
- Schools are A-rated — typically a magnet for longer-tenancy family renters. What's the average tenant stay here, and is there a school-zone premium baked into asking?
- This sits on a lake — are riparian / water-frontage rights deeded with the parcel? Any dock permits, shoreline easements, or HOA water-use restrictions?
- What's the documented flood / surge / shoreline-erosion history here (FEMA AND non-FEMA — e.g., storm surge, creek backup, septic-field saturation)?
- Any water-quality or seasonal algae-bloom issues that affect tenant satisfaction or short-term-rental demand?
- What's the average days-on-market for RENTAL listings here right now (not sales)? A rising rental-DOM trend means longer vacancies and softer asking-rent achievability than the comps imply.
- What's the recent tenant-quality profile in this submarket — average credit score on applications, eviction rate, late-payment / NSF rate, and stable-employment percentage? A property-management company in the area should have these aggregated.
- How much new for-sale + rental construction is in the pipeline within 1–3 miles? Heavy new supply typically softens prices + rents 12–24 months out; constrained supply supports both.
Investment metrics
- 1% rule
- 1.28% ✓
- Cap rate
- 11.07%
- Cash-on-cash
- 17.06%
- DSCR
- 1.76
- GRM
- 6.5
CMA / ARV
- ARV (on-the-fly)
- $193,622
- Comps found
- 2
Show comp detail 2 sales within ~0.75 mi
| Address | Dist | Beds/Ba | Sqft | Sold | Price | $/sf | Match |
|---|---|---|---|---|---|---|---|
| 10840 Bonapartes Gull | 0.03mi | 2/1.0 | 782 (+5%) | 13mo | $90,000 | $115 | 76 |
| 10713 Roseate Spoonbill Cir | 0.13mi | 1/1.0 (-1) | 702 (-6%) | 9mo | $135,000 | $192 | 68 |
Match score weights: distance 35% · size 25% · config 20% · recency 20%. Top-matched comps best support the ARV.
Projected returns pro-forma
-3.0% appreciation · 0.0% rent growth · sell at horizon
- IRR
- -0.4%
- Equity multiple
- 0.99×
- Total profit
- $-602
- Equity at exit
- $24,900
- IRR
- 5.9%
- Equity multiple
- 1.38×
- Total profit
- $17,577
- Equity at exit
- $14,439
Cash invested: $46,760 (down + closing). Projections, not guarantees.
Landlord ↔ Tenant lean methodology
- Overall (STATE)
- 87 Strongly Landlord-Friendly
- State Florida
- 87 Strongly Landlord-Friendly · R+3
- County
- — inherits STATE
- City
- — inherits STATE
ZIP-level market 33928
- Rents YoY
- -1.4%
- Active inventory
- 675
- Price-to-rent
- 6.5×
Monthly cashflow live
- Estimated rent
- $2,130 medium interval (Pro) →
- Mortgage (P&I)
- −$876
- Tax from tax record
- −$72 /mo · $870/yr
- Insurance
- −$70
- Flood insurance flood zone
- −$152 /mo · $1,824/yr
- HOA
- −$0
- Vacancy / Maint / Mgmt
- −$447
- Net cashflow
- $513
Break-even live
Sensitivity live
| Price | -10% $607 | -5% $560 | +0% $513 | +5% $466 | +10% $418 |
|---|---|---|---|---|---|
| Rent | -10% $345 | -5% $429 | +0% $513 | +5% $597 | +10% $681 |
| Rate | -1.0pp $597 | -0.5pp $555 | base $513 | +0.5pp $470 | +1.0pp $425 |
UW: 25.0% down · 7.5% · 30yr · 1.5% tax · 5.0% vac · 8.0% maint · 8.0% mgmt
Financing live
Cash to close
- Down payment
- $41,750
- Closing costs
- $5,010
- Reserves months
- —
- Total cash needed
- —
Loan-product check · same deal, 3 products live
Conventional
25% down · 7.5% · 30yr
- Down + closing
- —
- Monthly P&I
- —
- Monthly cashflow
- —
- DSCR
- —
- Eligible?
- —
Personal DTI + credit; lowest rate.
DSCR
20% down · 8.5% · 30yr
- Down + closing
- —
- Monthly P&I
- —
- Monthly cashflow
- —
- DSCR
- —
- Eligible?
- —
No personal income docs; deal must DSCR.
Hard money
10% down · 12.0% · 12mo
- Down + closing
- —
- Monthly P&I
- —
- Monthly cashflow
- —
- DSCR
- —
- Eligible?
- —
Short-term bridge; refi at stabilization.
Rent comps 1 comps
| Address | Beds | Baths | Sqft | Rent | $/sqft | DOM | Units | Dist |
|---|---|---|---|---|---|---|---|---|
| 19520 Highland Oaks Dr Estero, FL | 3.0 | 1.0–2.0 | 977 | $2,292 | $2.34 | 4d | 18 | 1.16mi |
Listing history 31 events
-
2026-06-22days on market $167,000 Active 40 DOM
-
2026-06-17days on market $167,000 Active 36 DOM
-
2026-06-16days on market $167,000 Active 35 DOM
-
2026-06-16days on market $167,000 Active 34 DOM
-
2026-06-13days on market $167,000 Active 32 DOM
-
2026-06-09days on market $167,000 Active 28 DOM
-
2026-06-07days on market $167,000 Active 26 DOM
-
2026-06-01days on market $167,000 Active 20 DOM
-
2026-06-01days on market $167,000 Active 19 DOM
-
2026-05-12$167,000 Active
-
2024-12-31historical
-
2024-06-23price $183,000
-
2024-03-28$195,000 Active
-
2024-03-25historical
-
2024-01-18price $199,500
-
2023-12-10price $205,000
-
2023-09-25$215,000 Active
-
2020-10-08soldstatus $99,000
-
2020-10-07soldstatus $99,000 Closed
-
2020-09-19status Pending
-
2020-06-18price $105,000
-
2020-01-03$112,000 Active
-
2019-07-15historical
-
2019-07-10status Active
-
2019-07-03status Pending With Contingencies
-
2019-04-04$116,000 Active
-
2015-04-01soldstatus $75,000
-
2013-12-20historical
-
2013-07-12$74,490
-
2013-03-11$74,490
-
2005-01-28soldstatus $46,000
ⓘ Source: listings_history table (triggers on properties + properties_extension) + one-shot
backfill from property_details.listing_events for pre-trigger history.
Tax reassessment forecast FL · Resets to sale price
- Current annual tax
- $870 · $72/mo
- Projected year-2 tax
- $1,386 · $116/mo
- Expected delta
- +$516/yr (+$43/mo · 59.3%)
ⓘ Screening estimate from a state-policy table — verify with the county assessor before closing.
Climate risk First Street
- Flood 4/10 Moderate FEMA zone AH · 13% chance over 30 yrs
- Wildfire 5/10 Major
- Heat 9/10 Extreme 7 d/yr ≥107°F today · 27 d/yr by 30 yrs out
- Wind 10/10 Extreme 99% chance of damaging wind over 30 yrs
- Air quality 3/10 Moderate 2 unhealthy d/yr today · 2 by 30 yrs out
Nearby sold comps map
Loading sold comps map…
Walkable amenities ~0.75 mi
Loading nearby amenities…
Taxation est. · year 1
- Rental income
- $25,560
- − Mortgage interest
- −$9,355
- − Property taxes
- −$870
- − Insurance
- −$2,660
- − Repairs & maintenance
- −$2,045
- − Management
- −$2,045
- − Depreciation
- −$4,858
- Taxable income
- $3,728
- Est. tax owed @ 24.0%
- −$895
- After-tax cash flow
- $5,259/yr
For passive investors: Depreciation is non-cash, so a rental often shows a tax loss while cash-flowing — sheltering income. Rental losses are passive: they offset passive income freely, and up to $25,000/yr can offset ordinary (W-2) income if you actively participate and your MAGI is under $100k (phasing out to $0 by $150k); unused losses carry forward. On sale, claimed depreciation is recaptured at up to 25%, and gains may owe capital-gains tax (a 1031 exchange can defer both). Figures are a year-1 estimate at your 24.0% rate — not tax advice; consult a CPA.
Schools (NCES district)
- District
- Lee
- NCES district ID
- 1201080
- Math proficiency
- 47% ▼ -11.00%
- Reading proficiency
- 50% ▼ -4.00%
- Median HH income
- $49,518
- Composite
- 41.49/100
- National rank
- #3458
- State rank
- #42 of 73 in FL
Livability — Estero
- Score
- 79/100
- State rank
- #149
- US rank
- #2242
Category grades
Schools grade is shown separately in the Schools card above.
Census & demographics
- Census place
- Estero, FL
- County
- Lee County · 788,662 people
- City population
- 31,926
- Metro
- Cape Coral-Fort Myers, FL
- Population (ZIP)
- 31,926
- Household income
- $102,624
- Rent vs Own
- Severe rent burden
- 606.0
Population outlook (Lee County) Hauer SSP2
- Today (2025)
- 871,946 people
- By 2030
- 955,468 · +9.6%
- By 2040
- 1,113,587 · +27.7%
- By 2050
- 1,256,891 · +44.1%
- By 2075
- 1,560,270 · +78.9%
- By 2100
- 1,726,848 · +98.0%
Race, ethnicity, and origin ACS 2023
- Neighborhood character
- Predominantly White (85%)
- Race & ethnicity
- White 85% Hispanic / Latino 8% Two or more races 7% Asian 3% Black 1%
- Hispanic origin (detail)
- Mexican 2% Puerto Rican 2% Cuban 1%
- Common ancestry
- Romanian 5% Lithuanian 3% Slovak 2%
- Foreign-born
- 11% · Canada, China, Jamaica
- Languages at home
- 90% English-only · Spanish 5% Other Indo-European 1% French/Haitian/Cajun 1%
Political lean MEDSL · Lee
- 2024 margin
- Strong R (+28.4) · D 35.5% · R 63.9%
- 2008→2024 swing
- -18.0pp toward R · 2008: -10.4pp · 2024: -28.4pp
- All cycles
- 2024: R+28.4 2020: R+19.2 2016: R+20.4 2012: R+16.6 2008: R+10.4
Not yet ingested
- Civics
- —
Market trends
- HPI YoY
- ▼ -109.49%
- Current HPI
- 197.5913
- Rent YoY
- ▼ -1.42%
- Metro
- Cape Coral-Fort Myers, FL
- State GDP YoY
- ▲ 3.28%
- F500 in state
- 36
Industry mix (Fortune 500 HQ in FL)
| Industry | F500 HQs | Revenue |
|---|---|---|
| Industrial Technology | 2 | $29B |
|
||
| Insurance | 2 | $17B |
|
||
| Retail | 1 | $60B |
|
||
| Technology Distribution | 1 | $58B |
|
||
| Homebuilding | 1 | $35B |
|
||
| Technology Manufacturing | 1 | $35B |
|
||
Price history
+263.0% since first listed22 events — show timeline
- 2026-05-12 Listed $167,000 FSBO.com
- 2024-12-31 Listing Removed — FORTMLS
- 2024-06-23 Price Changed $183,000 FORTMLS
- 2024-03-28 Listed $195,000 FORTMLS
- 2024-03-25 Listing Removed — FORTMLS
- 2024-01-18 Price Changed $199,500 FORTMLS
- 2023-12-10 Price Changed $205,000 FORTMLS
- 2023-09-25 Listed $215,000 FORTMLS
- 2020-10-08 Sold (Public Records) $99,000 Public Records
- 2020-10-07 Sold (MLS) $99,000 FORTMLS
- 2020-09-19 Pending — FORTMLS
- 2020-06-18 Price Changed $105,000 FORTMLS
- 2020-01-03 Listed $112,000 FORTMLS
- 2019-07-15 Listing Removed — FORTMLS
- 2019-07-10 Relisted — FORTMLS
- 2019-07-03 Pending — FORTMLS
- 2019-04-04 Listed $116,000 FORTMLS
- 2015-04-01 Sold (Public Records) $75,000 Public Records
- 2013-12-20 Listing Removed — NAPLESMLS
- 2013-07-12 Listed $74,490 NAPLESMLS
- 2013-03-11 Listed $74,490 NAPLESMLS
- 2005-01-28 Sold (Public Records) $46,000 Public Records
Property tax history
+0.3%/yrLatest (2025): $870 · -50.3% YoY. Source: county tax records.
Cash-flow waterfall
monthlySold comps — $/sqft
last 12 mo · ≤1 miLoading sold comps…