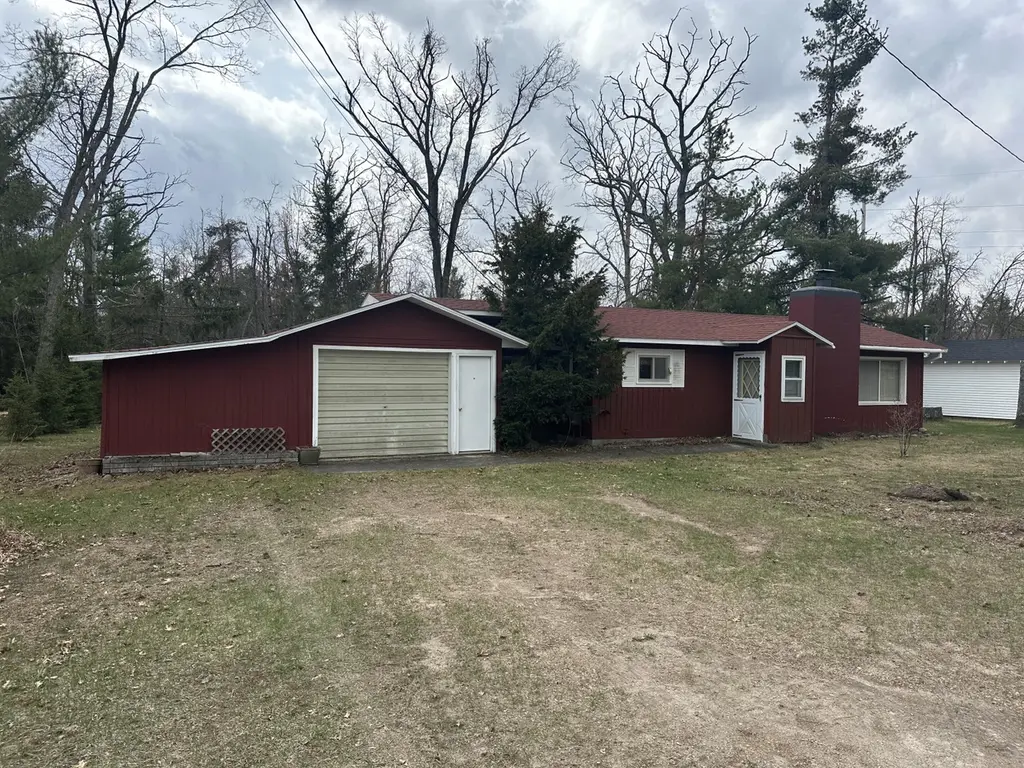
3909 Dorothy St · Albert, MI
Flood risk 1/10 · Minimal
- FEMA flood zone
- —
- Chance of flooding over 30 yrs
- 0.0%
- Est. flood insurance / yr
- —
Fire risk 4/10 · Minor
- Est. fire insurance / yr
- $784 – $1,456
Heat risk 1/10 · Minimal
- Hot days now (above 93°F)
- 7 days/yr
- Hot days in 30 yrs
- 13 days/yr
Wind risk 1/10 · Minimal
- Chance of severe wind over 30 yrs
- —
Air-quality risk 1/10 · Minimal
- Unhealthy air days now
- 0 days/yr
- Unhealthy air days in 30 yrs
- 0 days/yr
Risk factors via First Street. Map © Google.
Why this score? — see what drove the D+ grade
The composite is a weighted blend of 9 inputs, each scored 0–100. Each bar is that input's sub-score; the figure is the points it added to the 100-point composite (weight × sub-score).
- Cash flow +15.1/30.0
- ARV discount +15.0/15.0
- DSCR +4.6/10.0
- 1% rule +3.4/10.0
- Schools +3.1/10.0
- Rent growth +2.5/5.0
- Livability +2.5/5.0
- Condition / age +2.5/5.0
- Appreciation +0.0/10.0
$119,000
🖨 Deal sheet 📄 Offer letter ✓ Due diligence
Listing remarks
Affordable 2 bed 1 bath home with newer shingles, natural gas furnace, fireplace & woodstove, and attached one-car garage. Located close to town, ATV trails and public access to several lakes. Motivated Seller with Immediate occupancy, partially furnished. Would make a perfect up north cabin, rental opportunity or fulltime home.
Key facts
- Newer shingles
- Woodstove
- Natural gas furnace
Tags
Property features AI
Finance
- Other: Lot approximately 0.3 acres (dimensions 100 x 131); Subdivision: Johns Sub; Directions: From CR 612, north on Buttles, left on Dorothy.
Exterior
- Parking: Attached garage (1 car)
- Utilities: Well water; Septic tank
- Home design: Single family residence; Residential property; Single-story (above grade finished area listed)
- Construction: Crawl space foundation
- Exterior features: Deck; Gravel road access
Interior
- Kitchen: Refrigerator; Oven; Range; Microwave; Dishwasher
- Bathrooms: 1 full bathroom
- Heating & cooling: Forced air heating; Natural gas heating available; Wood heating/wood stove
- Interior features: Blinds and drapes; Wood burning stove fireplace
- Laundry & utility: Washer and dryer on main level
Neighborhood map
What this means for you Summary
Snapshot
- This is a 2-bed/1.0-bath single-family listed at $119k.
Deal economics
- At list price, monthly cash flow is $38 ($459/yr) — positive.
- The deal already cash-flows at list — no discount required.
- To meet the 1% rule (rent ≥ 1% of price), the offer needs to be $101k (15.5% below list).
- Recommended offer: $101k (15.5% below list) — sets the bar for 1% rule.
Location & tenants
- Location reads: area grade D — affects rentability + tenant quality, not the cash-flow math above.
- Johannesburg-Lewiston Area Schools (rural): math 33% / reading 42% proficiency, ranked #257 of 540 in MI (top 48%) — families likely to look elsewhere, expect single-tenant / working-renter base with shorter leases.
- Market conditions: 99 active listings in the ZIP.
Forward outlook
- Local home prices are declining (-3.0%/yr); year-one equity from $823 of loan paydown is wiped out by about $4k of value loss. Plan a longer hold.
- Montmorency County population projected at -38% by 2050 — secular population decline; favor cash flow + early exit over multi-decade hold.
Negotiation context
- It's been on market 38 days — a 3% lower offer ($115k) is reasonable based on typical stale-listing flexibility.
Questions for the listing agent
- It's been on market 38 days. Have you received any prior offers? Is the seller open to a 16% concession, seller financing, or rate buy-down credit?
- Built in 1962 — when were the roof, HVAC, electrical panel, plumbing, and water heater last replaced?
- Is there a deadline driving the sale (1031 exchange, divorce, estate, relocation)? That informs how much negotiation room exists.
- The area grade is low — what's the realistic commute time and amenity access for the typical tenant pool here? Any planned neighborhood developments (good or bad) we should know about?
- What's the average days-on-market for RENTAL listings here right now (not sales)? A rising rental-DOM trend means longer vacancies and softer asking-rent achievability than the comps imply.
- What's the recent tenant-quality profile in this submarket — average credit score on applications, eviction rate, late-payment / NSF rate, and stable-employment percentage? A property-management company in the area should have these aggregated.
- How much new for-sale + rental construction is in the pipeline within 1–3 miles? Heavy new supply typically softens prices + rents 12–24 months out; constrained supply supports both.
Investment metrics
- 1% rule
- 0.84% ✗
- Cap rate
- 6.68%
- Cash-on-cash
- 1.38%
- DSCR
- 1.06
- GRM
- 9.9
CMA / ARV
- ARV (on-the-fly)
- $157,920
- Comps found
- 5
Show comp detail 5 sales within ~0.75 mi
| Address | Dist | Beds/Ba | Sqft | Sold | Price | $/sf | Match |
|---|---|---|---|---|---|---|---|
| 3909 Dorothy St | 0.00mi | 2/1.0 | 1,120 (0%) | 0mo | $108,500 | $97 | 100 |
| 3216 Marius St | 0.66mi | 2/1.0 | 1,132 (+1%) | 19mo | $149,000 | $132 | 52 |
| 3670 Kneeland St | 0.64mi | 2/1.0 | 1,100 (-2%) | 23mo | $155,500 | $141 | 48 |
| 3211 Jenson St | 0.57mi | 3/2.0 (+1) | 1,257 (+12%) | 9mo | $255,000 | $203 | 37 |
| 3231 Jensen St | 0.56mi | 3/2.0 (+1) | 1,257 (+12%) | 23mo | $225,000 | $179 | 25 |
Match score weights: distance 35% · size 25% · config 20% · recency 20%. Top-matched comps best support the ARV.
Projected returns pro-forma
-3.0% appreciation · 3.0% rent growth · sell at horizon
- IRR
- -14.1%
- Equity multiple
- 0.49×
- Total profit
- $-16,874
- Equity at exit
- $17,743
- IRR
- -5.4%
- Equity multiple
- 0.65×
- Total profit
- $-11,663
- Equity at exit
- $10,289
Cash invested: $33,320 (down + closing). Projections, not guarantees.
Landlord ↔ Tenant lean methodology
- Overall (STATE)
- 62 Landlord-Friendly
- State Michigan
- 62 Landlord-Friendly · EVEN
- County
- — inherits STATE
- City
- — inherits STATE
ZIP-level market 49756
- Active inventory
- 99
- Price-to-rent
- 9.9×
Monthly cashflow live
- Estimated rent
- $1,005 medium interval (Pro) →
- Mortgage (P&I)
- −$624
- Tax from tax record
- −$82 /mo · $990/yr
- Insurance
- −$50
- HOA
- −$0
- Vacancy / Maint / Mgmt
- −$211
- Net cashflow
- $38
Break-even live
UW: 25.0% down · 7.5% · 30yr · 1.5% tax · 5.0% vac · 8.0% maint · 8.0% mgmt
Financing live
Cash to close
- Down payment
- $29,750
- Closing costs
- $3,570
- Reserves months
- —
- Total cash needed
- —
Loan-product check · same deal, 3 products live
Conventional
25% down · 7.5% · 30yr
- Down + closing
- —
- Monthly P&I
- —
- Monthly cashflow
- —
- DSCR
- —
- Eligible?
- —
Personal DTI + credit; lowest rate.
DSCR
20% down · 8.5% · 30yr
- Down + closing
- —
- Monthly P&I
- —
- Monthly cashflow
- —
- DSCR
- —
- Eligible?
- —
No personal income docs; deal must DSCR.
Hard money
10% down · 12.0% · 12mo
- Down + closing
- —
- Monthly P&I
- —
- Monthly cashflow
- —
- DSCR
- —
- Eligible?
- —
Short-term bridge; refi at stabilization.
Listing history 9 events
-
2026-06-07statusdays on market $119,000 Pending 38 DOM
-
2026-06-04days on market $119,000 Active Under Contract 37 DOM
-
2026-06-02days on market $119,000 Active Under Contract 36 DOM
-
2026-06-01days on market $119,000 Active Under Contract 35 DOM
-
2026-05-31days on market $119,000 Active Under Contract 34 DOM
-
2026-05-31days on market $119,000 Active Under Contract 33 DOM
-
2026-05-15historical Active Under Contract
-
2026-05-11price $119,000
-
2026-04-24$129,000 Active
ⓘ Source: listings_history table (triggers on properties + properties_extension) + one-shot
backfill from property_details.listing_events for pre-trigger history.
Tax reassessment forecast MI · Partial reset (capped growth)
- Current annual tax
- $990 · $82/mo
- Projected year-2 tax
- $1,411 · $118/mo
- Expected delta
- +$422/yr (+$35/mo · 42.6%)
ⓘ Screening estimate from a state-policy table — verify with the county assessor before closing.
Climate risk First Street
- Flood 1/10 Low 0% chance over 30 yrs
- Wildfire 4/10 Moderate
- Heat 1/10 Low 7 d/yr ≥93°F today · 13 d/yr by 30 yrs out
- Wind 1/10 Low
- Air quality 1/10 Low 0 unhealthy d/yr today · 0 by 30 yrs out
Nearby sold comps map
Loading sold comps map…
Walkable amenities ~0.75 mi
Loading nearby amenities…
Taxation est. · year 1
- Rental income
- $12,066
- − Mortgage interest
- −$6,666
- − Property taxes
- −$990
- − Insurance
- −$595
- − Repairs & maintenance
- −$965
- − Management
- −$965
- − Depreciation
- −$3,462
- Taxable loss
- −$1,577
- Est. tax savings @ 24.0%
- +$379
- After-tax cash flow
- $837/yr
For passive investors: Depreciation is non-cash, so a rental often shows a tax loss while cash-flowing — sheltering income. Rental losses are passive: they offset passive income freely, and up to $25,000/yr can offset ordinary (W-2) income if you actively participate and your MAGI is under $100k (phasing out to $0 by $150k); unused losses carry forward. On sale, claimed depreciation is recaptured at up to 25%, and gains may owe capital-gains tax (a 1031 exchange can defer both). Figures are a year-1 estimate at your 24.0% rate — not tax advice; consult a CPA.
Schools (NCES district)
- District
- Johannesburg-Lewiston Area Schools
- NCES district ID
- 2619890
- Math proficiency
- 33% ▼ -6.00%
- Reading proficiency
- 42% ▼ -10.00%
- Median HH income
- $39,218
- Composite
- 31.36/100
- National rank
- #5995
- State rank
- #257 of 540 in MI
Livability — Albert
No livability data for this city. (Only ~50 U.S. cities are tracked.)
Census & demographics
- Census place
- Lewiston, MI
- Population (ZIP)
- 3,965
Population outlook (Montmorency County) Hauer SSP2
- Today (2025)
- 8,233 people
- By 2030
- 7,575 · -8.0%
- By 2040
- 6,202 · -24.7%
- By 2050
- 5,081 · -38.3%
- By 2075
- 3,119 · -62.1%
- By 2100
- 1,923 · -76.6%
Race, ethnicity, and origin ACS 2023
- Neighborhood character
- Predominantly White (93%)
- Race & ethnicity
- White 93% Two or more races 6%
- Common ancestry
- Romanian 14% Lithuanian 8% Iranian 2%
- Foreign-born
- 1% · Canada, China
- Languages at home
- 98% English-only · Spanish 1% French/Haitian/Cajun 1%
Political lean MEDSL · Montmorency
- 2024 margin
- Solid R (+45.3) · D 26.6% · R 72.0% · Other 1.4%
- 2008→2024 swing
- -37.2pp toward R · 2008: -8.2pp · 2024: -45.3pp
- All cycles
- 2024: R+45.3 2020: R+43.4 2016: R+44.2 2012: R+17.4 2008: R+8.2
Not yet ingested
- Civics
- —
Market trends
- HPI YoY
- ▼ -111.19%
- Current HPI
- 134.8693
- Rent YoY
- —
- Metro
- —
- State GDP YoY
- ▲ 1.37%
- F500 in state
- 28
Industry mix (Fortune 500 HQ in MI)
| Industry | F500 HQs | Revenue |
|---|---|---|
| Automotive Parts | 3 | $48B |
|
||
| Automotive | 2 | $372B |
|
||
| Chemicals | 1 | $45B |
|
||
| Automotive Retail | 1 | $29B |
|
||
| Healthcare / Medical Devices | 1 | $23B |
|
||
| Automotive Technology | 1 | $20B |
|
||
Price history
-7.8% since first listed3 events — show timeline
- 2026-05-15 Contingent — WWMLS
- 2026-05-11 Price Changed $119,000 WWMLS
- 2026-04-24 Listed $129,000 WWMLS
Property tax history
+3.3%/yrLatest (2024): $990 · -25.2% YoY. Source: county tax records.
Cash-flow waterfall
monthlySold comps — $/sqft
last 12 mo · ≤1 miLoading sold comps…