 🌊 Lakefront
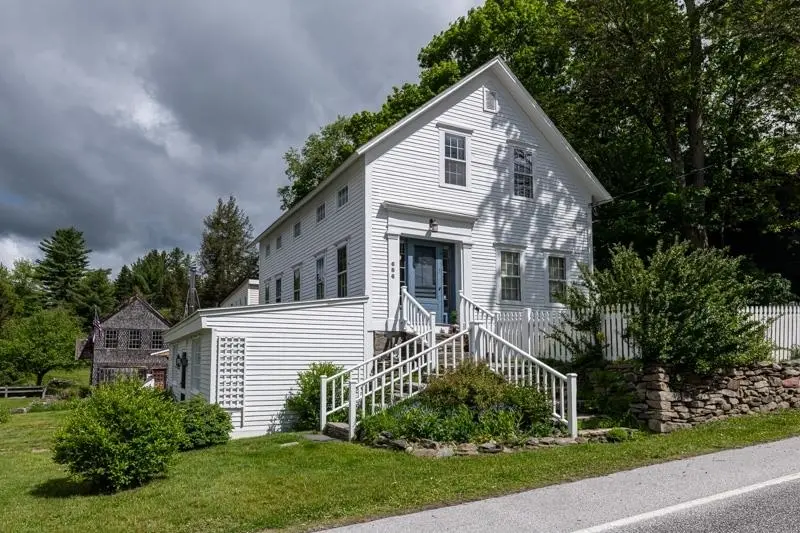
686 Main St · Weston, VT
Flood risk 1/10 · Minimal
- FEMA flood zone
- AE
- Chance of flooding over 30 yrs
- 0.0%
- Est. flood insurance / yr
- $2,026 – $9,024
Fire risk 1/10 · Minimal
- Est. fire insurance / yr
- $480 – $892
Heat risk 1/10 · Minimal
- Hot days now (above 86°F)
- 7 days/yr
- Hot days in 30 yrs
- 17 days/yr
Wind risk 3/10 · Minor
- Chance of severe wind over 30 yrs
- 6.0%
Air-quality risk 2/10 · Minimal
- Unhealthy air days now
- 0 days/yr
- Unhealthy air days in 30 yrs
- 1 days/yr
Risk factors via First Street. Map © Google.
Why this score? — see what drove the F grade
The composite is a weighted blend of 9 inputs, each scored 0–100. Each bar is that input's sub-score; the figure is the points it added to the 100-point composite (weight × sub-score).
- ARV discount +8.5/15.0
- Cash flow +6.4/30.0
- Schools +5.0/10.0
- Rent growth +2.5/5.0
- Livability +2.5/5.0
- Condition / age +2.5/5.0
- 1% rule +0.8/10.0
- DSCR +0.7/10.0
- Appreciation +0.0/10.0
$550,000
🖨 Deal sheet 📄 Offer letter ✓ Due diligence
Listing remarks MLS
Located in the heart of the village, this beautiful historic village home has been completely renovated with grace, charm and historical accuracy. There are 3BR/2BA and a lower level guest suite (or office, home gym or business space). It is absolutely perfect in every way with period details at every turn and special features include pretty perennial gardens, two stone patios (one in front and one in back), and a screened summer room for al fresco dining in the warmer months. There is ample storage and a large workshop in the beautiful attached antique barn. Weston is home to the much respected Weston Playhouse and summer theater, music, the library, post office, shops and restaurants are all a short walk away. Although it is currently used as a residence only, the property also offers two potential business or retail spaces (approx 36x33 and 22x11).
Key facts
- 6,098 sq ft lot
- Built 1860
- Listed 7 days
Tags
Property features AI
Exterior
- Parking: Common/shared driveway
- Utilities: Drilled well water; Septic (drywell); Circuit breaker electrical service; Green Mountain Power; Irving Energy fuel provider; High-speed internet available (cable)
- Home design: Cape-style, historic/vintage home; Existing structure; Built in 1860
- Construction: Wood frame construction; Clapboard and wood exterior; Metal and shingle roof; Originally built in 1860
- Exterior features: Landscaped grounds; Water view; Near skiing; Common/shared driveway; Easements present
Interior
- Kitchen: Gas cooktop; Gas range; Dishwasher; Exhaust hood; Refrigerator
- Bedrooms: Master bedroom (2nd level); Two additional bedrooms (2nd level)
- Bathrooms: Two full bathrooms; One 3/4 bathroom
- Heating & cooling: Propane and oil heating; Baseboard heat; Hot air heating
- Interior features: Daylight, finished basement with interior stairs and walkout; Sunroom; Foyer; Open living and family room spaces; Bonus room; Recreation room; Den
- Laundry & utility: Washer; Dryer; Owned water heater
Neighborhood map
What this means for you Summary
Snapshot
- This is a 3-bed/2.0-bath single-family listed at $550k.
Deal economics
- At list price, monthly cash flow is $-1k ($-17k/yr) — negative.
- To cash-flow at today's rent, offer at most $299k (45.6% below list).
- To meet the 1% rule (rent ≥ 1% of price), the offer needs to be $316k (42.5% below list).
- Recommended offer: $299k (45.6% below list) — sets the bar for cash-flow.
Location & tenants
- Location reads: area grade F — affects rentability + tenant quality, not the cash-flow math above.
- Market conditions: 10 active listings in the ZIP; 339 units permitted in Windsor County in 2024 (240 in 5+ unit buildings).
Forward outlook
- Local home prices are declining (-3.0%/yr); year-one equity from $4k of loan paydown is wiped out by about $16k of value loss. Plan a longer hold.
- Windsor County population projected at -21% by 2050 — secular population decline; favor cash flow + early exit over multi-decade hold.
Negotiation context
- Only 8 days on market — expect competitive offers; lowballing is unlikely to land.
- 2 sale attempts since 8y ago with the ask held roughly flat each time — persistent listings suggest the price (not the market) is what's stuck; bring a comps-based counter.
- Current owner paid $202k; list at $550k implies a 172% gain — meaningful room to come down on a strong offer.
Risks & watch-outs
- Watch-outs: flood insurance adds $460/mo; built in 1860 — expect roof / HVAC / electrical / plumbing capex.
- Climate carrying-cost: in FEMA flood zone AE (mandatory federal flood insurance) — expect insurance premiums to compound above CPI over the hold.
Questions for the listing agent
- What do current leases actually rent for vs. the listed asking? Can we see a recent rent roll and the last 12 months of T-12 income?
- Built in 1860 — when were the roof, HVAC, electrical panel, plumbing, and water heater last replaced?
- What's the actual annual flood-insurance premium (NFIP or private), and is the property in a SFHA with mandatory coverage?
- Is there a deadline driving the sale (1031 exchange, divorce, estate, relocation)? That informs how much negotiation room exists.
- The area grade is low — what's the realistic commute time and amenity access for the typical tenant pool here? Any planned neighborhood developments (good or bad) we should know about?
- This sits on a lake — are riparian / water-frontage rights deeded with the parcel? Any dock permits, shoreline easements, or HOA water-use restrictions?
- What's the documented flood / surge / shoreline-erosion history here (FEMA AND non-FEMA — e.g., storm surge, creek backup, septic-field saturation)?
- Any water-quality or seasonal algae-bloom issues that affect tenant satisfaction or short-term-rental demand?
- What's the average days-on-market for RENTAL listings here right now (not sales)? A rising rental-DOM trend means longer vacancies and softer asking-rent achievability than the comps imply.
- What's the recent tenant-quality profile in this submarket — average credit score on applications, eviction rate, late-payment / NSF rate, and stable-employment percentage? A property-management company in the area should have these aggregated.
- How much new for-sale + rental construction is in the pipeline within 1–3 miles? Heavy new supply typically softens prices + rents 12–24 months out; constrained supply supports both.
Investment metrics
- 1% rule
- 0.58% ✗
- Cap rate
- 4.20%
- Cash-on-cash
- -7.48%
- DSCR
- 0.67
- GRM
- 14.5
CMA / ARV
- ARV (on-the-fly)
- $562,242
- Comps found
- 2
Show comp detail 2 sales within ~0.75 mi
| Address | Dist | Beds/Ba | Sqft | Sold | Price | $/sf | Match |
|---|---|---|---|---|---|---|---|
| 35 Markham Ln | 0.20mi | 3/1.5 | 2,185 (-3%) | 11mo | $543,000 | $249 | 74 |
| 87 Lawrence Hill Rd | 0.34mi | 4/3.0 (+1) | 2,145 (-5%) | 20mo | $489,000 | $228 | 50 |
Match score weights: distance 35% · size 25% · config 20% · recency 20%. Top-matched comps best support the ARV.
Projected returns pro-forma
-3.0% appreciation · 3.0% rent growth · sell at horizon
- IRR
- -36.4%
- Equity multiple
- -0.17×
- Total profit
- $-179,488
- Equity at exit
- $82,007
- IRR
- -50.7%
- Equity multiple
- -0.77×
- Total profit
- $-272,317
- Equity at exit
- $47,554
Cash invested: $154,000 (down + closing). Projections, not guarantees.
Landlord ↔ Tenant lean methodology
- Overall (STATE)
- 41 Moderately Tenant-Leaning
- State Vermont
- 41 Moderately Tenant-Leaning · D+15
- County
- — inherits STATE
- City
- — inherits STATE
ZIP-level market 05161
- Home prices YoY
- -11.9%
- Active inventory
- 10
- Price-to-rent
- 14.5×
Monthly cashflow live
- Estimated rent
- $3,164 medium interval (Pro) →
- Mortgage (P&I)
- −$2,884
- Tax from tax record
- −$346 /mo · $4,154/yr
- Insurance
- −$229
- Flood insurance flood zone
- −$460 /mo · $5,525/yr
- HOA
- −$0
- Vacancy / Maint / Mgmt
- −$664
- Net cashflow
- $-1,421
Break-even live
UW: 25.0% down · 7.5% · 30yr · 1.5% tax · 5.0% vac · 8.0% maint · 8.0% mgmt
Financing live
Cash to close
- Down payment
- $137,500
- Closing costs
- $16,500
- Reserves months
- —
- Total cash needed
- —
Loan-product check · same deal, 3 products live
Conventional
25% down · 7.5% · 30yr
- Down + closing
- —
- Monthly P&I
- —
- Monthly cashflow
- —
- DSCR
- —
- Eligible?
- —
Personal DTI + credit; lowest rate.
DSCR
20% down · 8.5% · 30yr
- Down + closing
- —
- Monthly P&I
- —
- Monthly cashflow
- —
- DSCR
- —
- Eligible?
- —
No personal income docs; deal must DSCR.
Hard money
10% down · 12.0% · 12mo
- Down + closing
- —
- Monthly P&I
- —
- Monthly cashflow
- —
- DSCR
- —
- Eligible?
- —
Short-term bridge; refi at stabilization.
Listing history 8 events
-
2026-06-18days on market $550,000 Active 8 DOM
-
2026-06-17days on market $550,000 Active 7 DOM
-
2026-06-16days on market $550,000 Active 6 DOM
-
2026-06-15days on market $550,000 Active 5 DOM
-
2026-06-15days on market $550,000 Active 4 DOM
-
2026-06-13days on market $550,000 Active 3 DOM
-
2026-06-12remarks 699-char remark
-
2026-06-12$550,000 Active 2 DOM
ⓘ Source: listings_history table (triggers on properties + properties_extension) + one-shot
backfill from property_details.listing_events for pre-trigger history.
Tax reassessment forecast VT · Partial reset (capped growth)
- Current annual tax
- $4,154 · $346/mo
- Projected year-2 tax
- $7,302 · $608/mo
- Expected delta
- +$3,148/yr (+$262/mo · 75.8%)
ⓘ Screening estimate from a state-policy table — verify with the county assessor before closing.
Climate risk First Street
- Flood 1/10 Low FEMA zone AE · 0% chance over 30 yrs
- Wildfire 1/10 Low
- Heat 1/10 Low 7 d/yr ≥86°F today · 17 d/yr by 30 yrs out
- Wind 3/10 Moderate 6% chance of damaging wind over 30 yrs
- Air quality 2/10 Low 0 unhealthy d/yr today · 1 by 30 yrs out
Nearby sold comps map
Loading sold comps map…
Walkable amenities ~0.75 mi
Loading nearby amenities…
Taxation est. · year 1
- Rental income
- $37,964
- − Mortgage interest
- −$30,809
- − Property taxes
- −$4,154
- − Insurance
- −$8,275
- − Repairs & maintenance
- −$3,037
- − Management
- −$3,037
- − Depreciation
- −$16,000
- Taxable loss
- −$27,348
- Est. tax savings @ 24.0%
- +$6,563
- After-tax cash flow
- $-10,485/yr
For passive investors: Depreciation is non-cash, so a rental often shows a tax loss while cash-flowing — sheltering income. Rental losses are passive: they offset passive income freely, and up to $25,000/yr can offset ordinary (W-2) income if you actively participate and your MAGI is under $100k (phasing out to $0 by $150k); unused losses carry forward. On sale, claimed depreciation is recaptured at up to 25%, and gains may owe capital-gains tax (a 1031 exchange can defer both). Figures are a year-1 estimate at your 24.0% rate — not tax advice; consult a CPA.
Schools (NCES district)
No district data.
Livability — Weston
No livability data for this city. (Only ~50 U.S. cities are tracked.)
Census & demographics
- Census place
- Weston, VT
- Population (ZIP)
- 759
Population outlook (Windsor County) Hauer SSP2
- Today (2025)
- 53,235 people
- By 2030
- 51,269 · -3.7%
- By 2040
- 46,517 · -12.6%
- By 2050
- 41,859 · -21.4%
- By 2075
- 33,298 · -37.5%
- By 2100
- 24,523 · -53.9%
Race, ethnicity, and origin ACS 2023
- Neighborhood character
- Predominantly White (86%)
- Race & ethnicity
- White 86% Asian 7% Two or more races 6% Hispanic / Latino 3%
- Common ancestry
- Romanian 9% Lithuanian 5% Slovak 4%
- Foreign-born
- 11% · Canada, Vietnam, China
- Languages at home
- 89% English-only · Spanish 2% Vietnamese 2% French/Haitian/Cajun 2%
Political lean MEDSL · Windsor
- 2024 margin
- Solid D (+35.6) · D 66.3% · R 30.7% · Other 2.9%
- 2008→2024 swing
- -4.1pp toward R · 2008: 39.7pp · 2024: 35.6pp
- All cycles
- 2024: D+35.6 2020: D+38.9 2016: D+32.1 2012: D+38.1 2008: D+39.7
Not yet ingested
- Civics
- —
Market trends
- HPI YoY
- ▼ -24.58%
- Current HPI
- 181.3305
- Rent YoY
- —
- Metro
- —
- State GDP YoY
- —
- F500 in state
- 0
Price history
+103.7% since first listed9 events — show timeline
- 2026-06-10 Listed $550,000 PrimeMLS
- 2019-08-01 Sold (Public Records) $202,500 Public Records
- 2019-07-31 Sold (MLS) $202,500 PrimeMLS
- 2019-06-14 Contingent — PrimeMLS
- 2018-12-21 Price Changed $250,000 PrimeMLS
- 2018-05-17 Listed $275,000 PrimeMLS
- 2016-07-27 Price Changed $240,000 PrimeMLS
- 2016-06-15 Price Changed $250,000 PrimeMLS
- 2015-05-13 Price Changed $270,000 PrimeMLS
Property tax history
-1.7%/yrLatest (2024): $4,154 · +5.4% YoY. Source: county tax records.
Cash-flow waterfall
monthlySold comps — $/sqft
last 12 mo · ≤1 miLoading sold comps…