285 Sorrel Ct · Stephenville, TX
Flood risk 1/10 · Minimal
- FEMA flood zone
- X (unshaded)
- Chance of flooding over 30 yrs
- 0.0%
- Est. flood insurance / yr
- $507 – $1,088
Fire risk 8/10 · Major
- Est. fire insurance / yr
- $1,222 – $2,270
Heat risk 6/10 · Moderate
- Hot days now (above 105°F)
- 7 days/yr
- Hot days in 30 yrs
- 22 days/yr
Wind risk 6/10 · Moderate
- Chance of severe wind over 30 yrs
- 27.0%
Air-quality risk 1/10 · Minimal
- Unhealthy air days now
- 0 days/yr
- Unhealthy air days in 30 yrs
- 0 days/yr
Risk factors via First Street. Map © Google.
Why this score? — see what drove the C- grade
The composite is a weighted blend of 9 inputs, each scored 0–100. Each bar is that input's sub-score; the figure is the points it added to the 100-point composite (weight × sub-score).
- Cash flow +21.0/30.0
- ARV discount +7.5/15.0
- DSCR +6.7/10.0
- 1% rule +4.7/10.0
- Schools +4.2/10.0
- Livability +3.8/5.0
- Rent growth +2.5/5.0
- Condition / age +2.5/5.0
- Appreciation +0.0/10.0
$195,000
🖨 Deal sheet 📄 Offer letter ✓ Due diligence
Listing remarks MLS
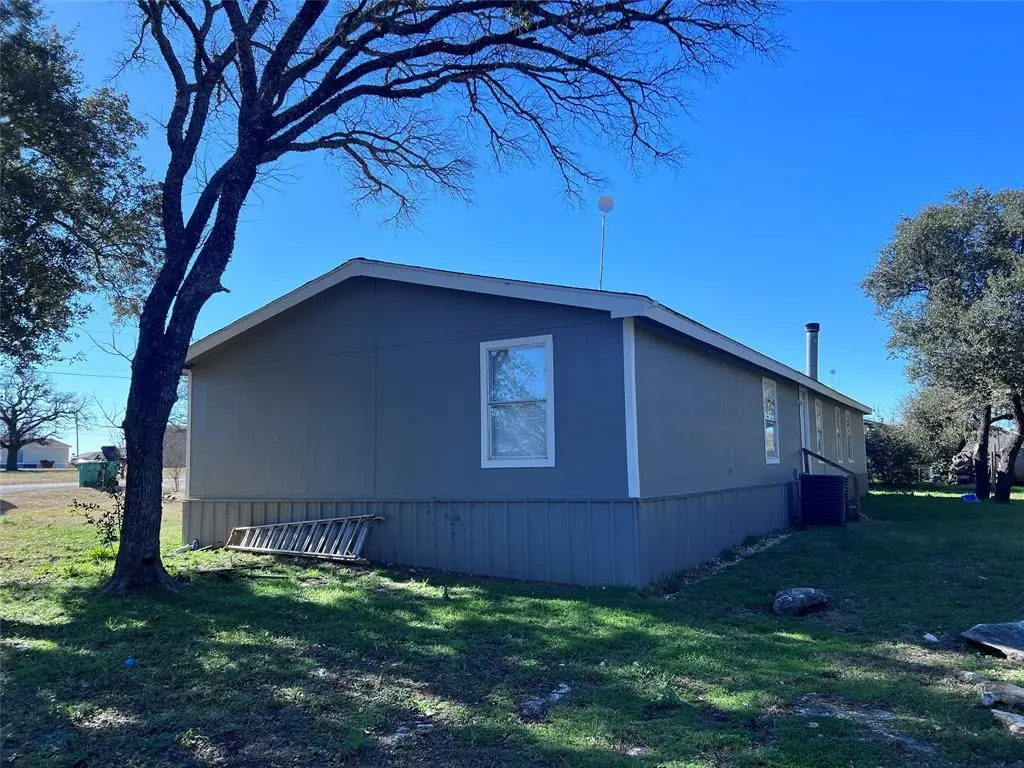
Discover the perfect blend of convenience and charm with this charming six bedroom, two and a half bath manufactured doublewide home just outside of Dublin, TX. This home features central heat and air, laminate hardwood flooring and a fireplace for those winter nights. Nestled on a generous half acre lot, this property offers ample space for living, entertaining and enjoying the outdoors.
Key facts
- Central heat and air
- Half acre lot
- Fireplace
Tags
Neighborhood map
What this means for you Summary
Snapshot
- This is a 6-bed/2.5-bath single-family listed at $195k.
Deal economics
- At list price, monthly cash flow is $275 ($3k/yr) — positive.
- The deal already cash-flows at list — no discount required.
- To meet the 1% rule (rent ≥ 1% of price), the offer needs to be $189k (3.3% below list).
- Recommended offer: $172k (12.0% below list) — sets the bar for market timing.
- Cap rate 8.0% vs local median 2.1% in Stephenville — top-decile yield for the area; either an underpriced asset or a hidden risk that comps aren't pricing in. Stress-test before assuming the spread holds.
Location & tenants
- Location reads 75/100 on livability (#124 in TX, #3,840 nationally) — a middle-class / working-renter tenant base. Strengths: cost of living A+, housing A+, health & safety A+; Watch: schools C-, commute F, employment D-.
- Stephenville ISD (town): math 53% / reading 48% proficiency, ranked #191 of 826 in TX (top 23%) — acceptable for families but not a draw, mixed tenant base, ~2y average lease.
- Market conditions: Rents flat; 383 active listings in the ZIP; 110 units permitted in Erath County in 2024 (61 in 5+ unit buildings).
- This rent runs 37% of the median local income ($61k/yr) — at the standard rent-burdened threshold; future hikes will face affordability resistance.
Forward outlook
- Local home prices are declining (-3.0%/yr); year-one equity from $1k of loan paydown is wiped out by about $6k of value loss. Plan a longer hold.
- Erath County population projected at +55% by 2050 — long-run rental-demand tailwind backs the buy-and-hold thesis.
Negotiation context
- It's been on market 186 days — a 12% lower offer ($172k) is reasonable based on typical stale-listing flexibility.
- 2 sale attempts; this cycle's ask has dropped $13k (6%) from the opening price — seller is motivated, your offer sets the floor, not the list.
Risks & watch-outs
- Climate carrying-cost: major wind risk, 27% chance of damaging wind over 30y; severe wildfire risk; extreme-heat days projected 7→22/yr by 2055 (HVAC capex compounding) — expect insurance premiums to compound above CPI over the hold.
Questions for the listing agent
- It's been on market 186 days. Have you received any prior offers? Is the seller open to a 12% concession, seller financing, or rate buy-down credit?
- Why hasn't it sold? Are there any deal-killer items the seller is aware of (foundation, flood, title, zoning, code violations)?
- Is there a deadline driving the sale (1031 exchange, divorce, estate, relocation)? That informs how much negotiation room exists.
- What's the average days-on-market for RENTAL listings here right now (not sales)? A rising rental-DOM trend means longer vacancies and softer asking-rent achievability than the comps imply.
- What's the recent tenant-quality profile in this submarket — average credit score on applications, eviction rate, late-payment / NSF rate, and stable-employment percentage? A property-management company in the area should have these aggregated.
- How much new for-sale + rental construction is in the pipeline within 1–3 miles? Heavy new supply typically softens prices + rents 12–24 months out; constrained supply supports both.
Investment metrics
- 1% rule
- 0.97% ✗
- Cap rate
- 7.99%
- Cash-on-cash
- 6.05%
- DSCR
- 1.27
- GRM
- 8.6
CMA / ARV
- ARV (median comp)
- $608,616
- List price
- $195,000
- Delta
- -67.96%
- Verdict
- UNDERPRICED
- Comps
- 1 within 2.0 mi
Projected returns pro-forma
-3.0% appreciation · 0.07% rent growth · sell at horizon
- IRR
- -10.1%
- Equity multiple
- 0.64×
- Total profit
- $-19,510
- Equity at exit
- $29,075
- IRR
- -4.9%
- Equity multiple
- 0.72×
- Total profit
- $-15,516
- Equity at exit
- $16,860
Cash invested: $54,600 (down + closing). Projections, not guarantees.
Landlord ↔ Tenant lean methodology
- Overall (STATE)
- 87 Strongly Landlord-Friendly
- State Texas
- 87 Strongly Landlord-Friendly · R+5
- County
- — inherits STATE
- City
- — inherits STATE
ZIP-level market 76401
- Rents YoY
- 0.1%
- Active inventory
- 383
- Price-to-rent
- 8.6×
Monthly cashflow live
- Estimated rent
- $1,886 medium interval (Pro) →
- Mortgage (P&I)
- −$1,023
- Tax from tax record
- −$110 /mo · $1,323/yr
- Insurance
- −$81
- HOA
- −$0
- Vacancy / Maint / Mgmt
- −$396
- Net cashflow
- $275
Break-even live
UW: 25.0% down · 7.5% · 30yr · 1.5% tax · 5.0% vac · 8.0% maint · 8.0% mgmt
Financing live
Cash to close
- Down payment
- $48,750
- Closing costs
- $5,850
- Reserves months
- —
- Total cash needed
- —
Loan-product check · same deal, 3 products live
Conventional
25% down · 7.5% · 30yr
- Down + closing
- —
- Monthly P&I
- —
- Monthly cashflow
- —
- DSCR
- —
- Eligible?
- —
Personal DTI + credit; lowest rate.
DSCR
20% down · 8.5% · 30yr
- Down + closing
- —
- Monthly P&I
- —
- Monthly cashflow
- —
- DSCR
- —
- Eligible?
- —
No personal income docs; deal must DSCR.
Hard money
10% down · 12.0% · 12mo
- Down + closing
- —
- Monthly P&I
- —
- Monthly cashflow
- —
- DSCR
- —
- Eligible?
- —
Short-term bridge; refi at stabilization.
Listing history 17 events
-
2026-06-09statusdays on market $195,000 Pending 186 DOM
-
2026-06-08days on market $195,000 Active Option Contract 185 DOM
-
2026-06-07days on market $195,000 Active Option Contract 184 DOM
-
2026-06-03days on market $195,000 Active Option Contract 180 DOM
-
2026-06-02days on market $195,000 Active Option Contract 179 DOM
-
2026-06-01days on market $195,000 Active Option Contract 178 DOM
-
2026-05-31statusdays on market $195,000 Active Option Contract 177 DOM
-
2026-05-30days on market $195,000 Active 176 DOM
-
2026-02-14price $199,900 393-char remark
Show marketing remark (393 chars)
Discover the perfect blend of convenience and charm with this charming six bedroom, two and a half bath manufactured doublewide home just outside of Dublin, TX. This home features central heat and air, laminate hardwood flooring and a fireplace for those winter nights. Nestled on a generous half acre lot, this property offers ample space for living, entertaining and enjoying the outdoors.
-
2025-12-02$208,000 Active 393-char remark
Show marketing remark (393 chars)
Discover the perfect blend of convenience and charm with this charming six bedroom, two and a half bath manufactured doublewide home just outside of Dublin, TX. This home features central heat and air, laminate hardwood flooring and a fireplace for those winter nights. Nestled on a generous half acre lot, this property offers ample space for living, entertaining and enjoying the outdoors.
-
2025-12-01historical
-
2025-10-17price $212,000
-
2025-08-19price $219,000
-
2025-05-19price $230,000
-
2025-04-03price $240,000
-
2025-01-02$250,000 Active
-
2021-03-17soldstatus
ⓘ Source: listings_history table (triggers on properties + properties_extension) + one-shot
backfill from property_details.listing_events for pre-trigger history.
Tax reassessment forecast TX · Resets to sale price
- Current annual tax
- $1,323 · $110/mo
- Projected year-2 tax
- $3,568 · $297/mo
- Expected delta
- +$2,245/yr (+$187/mo · 169.7%)
ⓘ Screening estimate from a state-policy table — verify with the county assessor before closing.
Climate risk First Street
- Flood 1/10 Low FEMA zone X (unshaded) · 0% chance over 30 yrs
- Wildfire 8/10 Severe
- Heat 6/10 Major 7 d/yr ≥105°F today · 22 d/yr by 30 yrs out
- Wind 6/10 Major 27% chance of damaging wind over 30 yrs
- Air quality 1/10 Low 0 unhealthy d/yr today · 0 by 30 yrs out
Nearby sold comps map
Loading sold comps map…
Walkable amenities ~0.75 mi
Loading nearby amenities…
Taxation est. · year 1
- Rental income
- $22,626
- − Mortgage interest
- −$10,923
- − Property taxes
- −$1,323
- − Insurance
- −$975
- − Repairs & maintenance
- −$1,810
- − Management
- −$1,810
- − Depreciation
- −$5,673
- Taxable income
- $112
- Est. tax owed @ 24.0%
- −$27
- After-tax cash flow
- $3,278/yr
For passive investors: Depreciation is non-cash, so a rental often shows a tax loss while cash-flowing — sheltering income. Rental losses are passive: they offset passive income freely, and up to $25,000/yr can offset ordinary (W-2) income if you actively participate and your MAGI is under $100k (phasing out to $0 by $150k); unused losses carry forward. On sale, claimed depreciation is recaptured at up to 25%, and gains may owe capital-gains tax (a 1031 exchange can defer both). Figures are a year-1 estimate at your 24.0% rate — not tax advice; consult a CPA.
Schools (NCES district)
- District
- Stephenville ISD
- NCES district ID
- 4841520
- Math proficiency
- 53% ▼ -1.00%
- Reading proficiency
- 48% ▼ -4.00%
- Median HH income
- $39,565
- Composite
- 42.23/100
- National rank
- #3283
- State rank
- #191 of 826 in TX
Livability — Stephenville
- Score
- 75/100
- State rank
- #124
- US rank
- #3840
Category grades
Schools grade is shown separately in the Schools card above.
Census & demographics
- County
- Erath County · 31,375 people
- City population
- 31,375
- Metro
- Stephenville, TX
- Population (ZIP)
- 31,375
- Household income
- $61,210
- Rent vs Own
- Severe rent burden
- 1758.0
Population outlook (Erath County) Hauer SSP2
- Today (2025)
- 50,437 people
- By 2030
- 55,510 · +10.1%
- By 2040
- 66,379 · +31.6%
- By 2050
- 77,981 · +54.6%
- By 2075
- 109,727 · +117.6%
- By 2100
- 132,574 · +162.9%
Race, ethnicity, and origin ACS 2023
- Neighborhood character
- Predominantly White (76%)
- Race & ethnicity
- White 76% Hispanic / Latino 18% Two or more races 8% Black 2% Asian 1%
- Hispanic origin (detail)
- Mexican 15%
- Common ancestry
- Slovak 2% Italian 1% Serbian 1%
- Foreign-born
- 5% · Canada, China
- Languages at home
- 88% English-only · Spanish 10% Chinese 1%
Political lean MEDSL · Erath
- 2024 margin
- Solid R (+68.0) · D 15.7% · R 83.7%
- 2008→2024 swing
- -13.5pp toward R · 2008: -54.5pp · 2024: -68.0pp
- All cycles
- 2024: R+68.0 2020: R+63.9 2016: R+65.5 2012: R+67.1 2008: R+54.5
Not yet ingested
- Civics
- —
Market trends
- HPI YoY
- ▼ -133.71%
- Current HPI
- 234.4986
- Rent YoY
- ▲ 0.07%
- Metro
- Stephenville, TX
- State GDP YoY
- ▲ 3.95%
- F500 in state
- 110
Industry mix (Fortune 500 HQ in TX)
| Industry | F500 HQs | Revenue |
|---|---|---|
| Energy | 16 | $1,198B |
|
||
| Technology | 5 | $198B |
|
||
| Engineering / Construction | 4 | $72B |
|
||
| Energy Services | 3 | $60B |
|
||
| Utilities | 3 | $41B |
|
||
| Healthcare | 2 | $330B |
|
||
Price history
-20.0% since first listed9 events — show timeline
- 2026-02-14 Price Changed $199,900 NTREIS
- 2025-12-02 Listed $208,000 NTREIS
- 2025-12-01 Listing Removed — NTREIS
- 2025-10-17 Price Changed $212,000 NTREIS
- 2025-08-19 Price Changed $219,000 NTREIS
- 2025-05-19 Price Changed $230,000 NTREIS
- 2025-04-03 Price Changed $240,000 NTREIS
- 2025-01-02 Listed $250,000 NTREIS
- 2021-03-17 Sold (Public Records) — Public Records
Property tax history
+28.3%/yrLatest (2025): $1,323 · -8.3% YoY. Source: county tax records.
Cash-flow waterfall
monthlySold comps — $/sqft
last 12 mo · ≤1 miLoading sold comps…