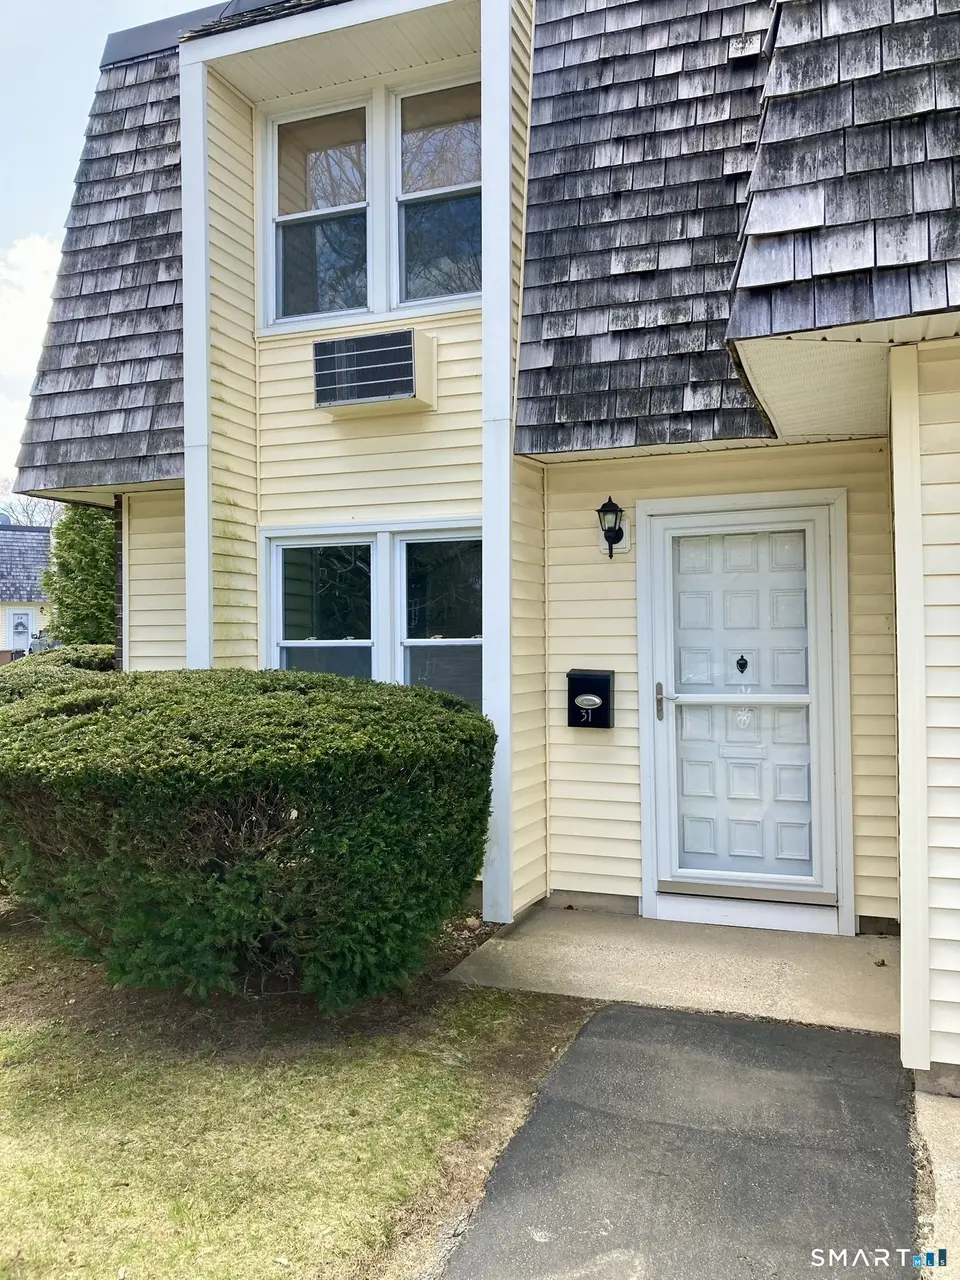
127 Black Point Rd #31 · Niantic, CT
Flood risk 4/10 · Minor
- FEMA flood zone
- X (shaded)
- Chance of flooding over 30 yrs
- 0.22%
- Est. flood insurance / yr
- $507 – $1,088
Fire risk 1/10 · Minimal
- Est. fire insurance / yr
- $829 – $1,539
Heat risk 6/10 · Moderate
- Hot days now (above 95°F)
- 7 days/yr
- Hot days in 30 yrs
- 17 days/yr
Wind risk 8/10 · Major
- Chance of severe wind over 30 yrs
- 80.0%
Air-quality risk 4/10 · Minor
- Unhealthy air days now
- 4 days/yr
- Unhealthy air days in 30 yrs
- 5 days/yr
Risk factors via First Street. Map © Google.
Why this score? — see what drove the B grade
The composite is a weighted blend of 9 inputs, each scored 0–100. Each bar is that input's sub-score; the figure is the points it added to the 100-point composite (weight × sub-score).
- Cash flow +30.0/30.0
- 1% rule +10.0/10.0
- DSCR +10.0/10.0
- ARV discount +7.5/15.0
- Schools +5.5/10.0
- Livability +3.9/5.0
- Rent growth +2.5/5.0
- Condition / age +2.5/5.0
- Appreciation +0.0/10.0
$179,000
🖨 Deal sheet 📄 Offer letter ✓ Due diligence
Listing remarks MLS
End unit, quiet complex in crescent beach. Can not be rented until owned for 2 years.Needs a cosmetic makeover, bathroom, paint,carpeting. Sewer balance to be assumed by buyer.Slider to patio on first floor, slider to deck on second floor. N second floor.
Key facts
- $326 HOA
- Parking
- Built 1971
Property features AI
Finance
- Other: Professional off-site property management; Pets allowed with restrictions (ask about pet policy); Renting allowed (per encumbrances/restrictions)
- HOA & community: Monthly HOA fee; HOA covers water, sewer, trash pickup, snow removal, grounds maintenance, tennis, and property management; Community amenities include tennis and basketball courts
Exterior
- Parking: Assigned parking (1 space)
- Utilities: Public water; Public sewer
- Home design: Condominium in a multi-unit complex (Black Point Farms); End unit; Yellow exterior color
- Construction: Frame construction
- Exterior features: Aluminum siding; Balcony; Deck; Patio; Tennis court access; Level lot; Beach rights
Interior
- Kitchen: Refrigerator
- Bedrooms: One bedroom
- Bathrooms: One full bathroom
- Heating & cooling: Radiant heat (electric); Wall air-conditioning unit; 40-gallon electric hot water tank
- Interior features: Two-level unit; No basement
- Laundry & utility: Coin-operated common laundry (short walk from unit)
Neighborhood map
What this means for you Summary
Snapshot
- This is a 1-bed/1.0-bath condo listed at $179k.
Deal economics
- At list price, monthly cash flow is $983 ($12k/yr) — positive.
- The deal already cash-flows at list — no discount required.
- Meets the 1% rule at list price ($3k rent vs $179k).
- Cap rate 12.9% vs local median 3.0% in Niantic — top-decile yield for the area; either an underpriced asset or a hidden risk that comps aren't pricing in. Stress-test before assuming the spread holds.
Location & tenants
- Location reads 78/100 on livability (#35 in CT, #2,462 nationally) — a middle-class / working-renter tenant base. Strengths: crime A+, employment A+, housing A; Watch: cost of living D+, amenities F, commute F.
- East Lyme School District (rural): math 55% / reading 68% proficiency, ranked #42 of 153 in CT (top 28%) — acceptable for families but not a draw, mixed tenant base, ~2y average lease; only 10% free/reduced lunch — higher-income household profile.
- Zoned schools: East Lyme High School (math 57% / reading 79%, grade B, #25 of 194 statewide, top 12%, 966 students, 20% FRL).
- Market conditions: 61 active listings in the ZIP; 6 comparable units currently listed for rent nearby; rentals leasing fast (median 13d on market — plan ~1-2 weeks tenant-placement turnaround); solid renter incomes; 487 units permitted in Southeastern Connecticut Planning Region in 2024 (244 in 5+ unit buildings).
- This rent runs 41% of the median local income ($93k/yr) — at the standard rent-burdened threshold; future hikes will face affordability resistance.
Forward outlook
- Local home prices are declining (-3.0%/yr); year-one equity from $1k of loan paydown is wiped out by about $5k of value loss. Plan a longer hold.
- At projected returns (-3.0% appreciation + 3.0% rent growth), your $50k cash investment doubles in ~6 years — after that, you're playing with house money.
Negotiation context
- Only 2 days on market — expect competitive offers; lowballing is unlikely to land.
- 2 sale attempts since 22y ago with the ask held roughly flat each time — persistent listings suggest the price (not the market) is what's stuck; bring a comps-based counter.
- Current owner paid $90k; list at $179k implies a 99% gain — meaningful room to come down on a strong offer.
Risks & watch-outs
- Climate carrying-cost: severe wind risk, 80% chance of damaging wind over 30y; extreme-heat days projected 7→17/yr by 2055 (HVAC capex compounding) — expect insurance premiums to compound above CPI over the hold.
Questions for the listing agent
- Built in 1971 — when were the roof, HVAC, electrical panel, plumbing, and water heater last replaced?
- What does the HOA fee cover, when was the last increase, and are there any pending special assessments or reserve-fund shortfalls?
- Any open or pending special assessments — roof, HVAC, plumbing, elevator, façade? What's the per-unit balance and payoff schedule, and is the seller paying it off at close or rolling it to the buyer?
- Is there a deadline driving the sale (1031 exchange, divorce, estate, relocation)? That informs how much negotiation room exists.
- Schools are A-rated — typically a magnet for longer-tenancy family renters. What's the average tenant stay here, and is there a school-zone premium baked into asking?
- What's the average days-on-market for RENTAL listings here right now (not sales)? A rising rental-DOM trend means longer vacancies and softer asking-rent achievability than the comps imply.
- What's the recent tenant-quality profile in this submarket — average credit score on applications, eviction rate, late-payment / NSF rate, and stable-employment percentage? A property-management company in the area should have these aggregated.
- How much new apartment / multifamily construction is in the pipeline within 1–3 miles? Heavy new supply (>2% of stock underway) typically softens rents 12–24 months out; light construction supports rent growth.
Investment metrics
- 1% rule
- 1.76% ✓
- Cap rate
- 12.88%
- Cash-on-cash
- 23.53%
- DSCR
- 2.05
- GRM
- 4.7
CMA / ARV
No comps found within radius.
Projected returns pro-forma
-3.0% appreciation · 3.0% rent growth · sell at horizon
- IRR
- 16.7%
- Equity multiple
- 1.67×
- Total profit
- $33,805
- Equity at exit
- $26,689
- IRR
- 25.3%
- Equity multiple
- 3.21×
- Total profit
- $110,900
- Equity at exit
- $15,477
Cash invested: $50,120 (down + closing). Projections, not guarantees.
Landlord ↔ Tenant lean methodology
- Overall (STATE)
- 27 Tenant-Leaning
- State Connecticut
- 27 Tenant-Leaning · D+7
- County
- — inherits STATE
- City
- — inherits STATE
ZIP-level market 06357
- Home prices YoY
- -21.9%
- Active inventory
- 61
- Price-to-rent
- 4.7×
Monthly cashflow live
- Estimated rent
- $3,146 high interval (Pro) →
- Mortgage (P&I)
- −$939
- Tax from tax record
- −$163 /mo · $1,958/yr
- Insurance
- −$75
- HOA
- −$326
- Vacancy / Maint / Mgmt
- −$661
- Net cashflow
- $983
Break-even live
UW: 25.0% down · 7.5% · 30yr · 1.5% tax · 5.0% vac · 8.0% maint · 8.0% mgmt
Financing live
Cash to close
- Down payment
- $44,750
- Closing costs
- $5,370
- Reserves months
- —
- Total cash needed
- —
Loan-product check · same deal, 3 products live
Conventional
25% down · 7.5% · 30yr
- Down + closing
- —
- Monthly P&I
- —
- Monthly cashflow
- —
- DSCR
- —
- Eligible?
- —
Personal DTI + credit; lowest rate.
DSCR
20% down · 8.5% · 30yr
- Down + closing
- —
- Monthly P&I
- —
- Monthly cashflow
- —
- DSCR
- —
- Eligible?
- —
No personal income docs; deal must DSCR.
Hard money
10% down · 12.0% · 12mo
- Down + closing
- —
- Monthly P&I
- —
- Monthly cashflow
- —
- DSCR
- —
- Eligible?
- —
Short-term bridge; refi at stabilization.
Rent comps 6 comps
| Address | Beds | Baths | Sqft | Rent | $/sqft | DOM | Units | Dist |
|---|---|---|---|---|---|---|---|---|
| 61 Old Black Point Rd Niantic, CT | 1.0 | 1.0 | 798 | $5,000 | $6.27 | 21d | 1 | 0.51mi |
| 2 Bidwell St Niantic, CT | 2.0 | 1.0 | 1032 | $2,600 | $2.52 | 43d | 1 | 0.79mi |
| 157 W Main St Unit 4 Niantic, CT | 2.0 | 1.0 | 1100 | $2,000 | $1.82 | 13d | 1 | 0.84mi |
| 344 Main St Unit 207 Niantic, CT | 2.0 | 1.0 | 798 | $3,200 | $4.01 | 13d | 1 | 0.99mi |
| 344 Main St Unit 201 Niantic, CT | 1.0 | 1.0 | 645 | $2,700 | $4.19 | 13d | 1 | 0.99mi |
| 344 Main St Unit 202 Niantic, CT | 1.0 | 1.0 | 572 | $2,500 | $4.37 | 13d | 1 | 0.99mi |
HOA detail condo
- Monthly dues
- $326 · $3,912/yr
- Likely covers
- sewer
- Assessments
- None detected in remarks — confirm with the listing agent.
Listing history 6 events
-
2026-04-12status Under Contract
-
2026-04-10$179,000 Active
-
2026-04-08historical $179,000
-
2004-09-16soldstatus $90,000 257-char remark
Show marketing remark (257 chars)
End unit, quiet complex in crescent beach. Can not be rented until owned for 2 years.Needs a cosmetic makeover, bathroom, paint,carpeting. Sewer balance to be assumed by buyer.Slider to patio on first floor, slider to deck on second floor. N second floor.
-
2004-09-15soldstatus $90,000
-
2004-07-02$99,000 257-char remark
Show marketing remark (257 chars)
End unit, quiet complex in crescent beach. Can not be rented until owned for 2 years.Needs a cosmetic makeover, bathroom, paint,carpeting. Sewer balance to be assumed by buyer.Slider to patio on first floor, slider to deck on second floor. N second floor.
ⓘ Source: listings_history table (triggers on properties + properties_extension) + one-shot
backfill from property_details.listing_events for pre-trigger history.
Tax reassessment forecast CT · Partial reset (capped growth)
- Current annual tax
- $1,958 · $163/mo
- Projected year-2 tax
- $2,894 · $241/mo
- Expected delta
- +$936/yr (+$78/mo · 47.8%)
ⓘ Screening estimate from a state-policy table — verify with the county assessor before closing.
Climate risk First Street
- Flood 4/10 Moderate FEMA zone X (shaded) · 22% chance over 30 yrs
- Wildfire 1/10 Low
- Heat 6/10 Major 7 d/yr ≥95°F today · 17 d/yr by 30 yrs out
- Wind 8/10 Severe 80% chance of damaging wind over 30 yrs
- Air quality 4/10 Moderate 4 unhealthy d/yr today · 5 by 30 yrs out
Nearby sold comps map
Loading sold comps map…
Walkable amenities ~0.75 mi
Loading nearby amenities…
Taxation est. · year 1
- Rental income
- $37,752
- − Mortgage interest
- −$10,027
- − Property taxes
- −$1,958
- − Insurance
- −$895
- − Repairs & maintenance
- −$3,020
- − Management
- −$3,020
- − HOA
- −$3,912
- − Depreciation
- −$5,207
- Taxable income
- $9,712
- Est. tax owed @ 24.0%
- −$2,331
- After-tax cash flow
- $9,464/yr
For passive investors: Depreciation is non-cash, so a rental often shows a tax loss while cash-flowing — sheltering income. Rental losses are passive: they offset passive income freely, and up to $25,000/yr can offset ordinary (W-2) income if you actively participate and your MAGI is under $100k (phasing out to $0 by $150k); unused losses carry forward. On sale, claimed depreciation is recaptured at up to 25%, and gains may owe capital-gains tax (a 1031 exchange can defer both). Figures are a year-1 estimate at your 24.0% rate — not tax advice; consult a CPA.
Schools (NCES district)
- District
- East Lyme School District
- NCES district ID
- 0901320
- Math proficiency
- 55% ▼ -10.00%
- Reading proficiency
- 68% ▼ -7.00%
- Median HH income
- $81,441
- Composite
- 55.28/100
- National rank
- #1264
- State rank
- #42 of 153 in CT
Livability — Niantic
- Score
- 78/100
- State rank
- #35
- US rank
- #2462
Category grades
Schools grade is shown separately in the Schools card above.
Census & demographics
- County
- New London County · 147,197 people
- City population
- 11,332
- Metro
- Norwich-New London, CT
- Population (ZIP)
- 11,332
- Household income
- $93,026
- Rent vs Own
- Severe rent burden
- 329.0
Population outlook (Southeastern Connecticut County) Hauer SSP2
- By 2040
- 293,442
Race, ethnicity, and origin ACS 2023
- Neighborhood character
- Predominantly White (83%)
- Race & ethnicity
- White 83% Asian 6% Two or more races 6% Hispanic / Latino 4% Black 3%
- Common ancestry
- Romanian 7% Lithuanian 6% Slovak 3%
- Foreign-born
- 10% · Canada, China
- Languages at home
- 86% English-only · Other Indo-European 5% Spanish 3% Other Asian/Pacific 2%
Political lean MEDSL · Southeastern Connecticut
- 2024 margin
- D (+13.0) · D 55.6% · R 42.6% · Other 1.8%
- All cycles
- 2024: D+13.0
Not yet ingested
- Civics
- —
Market trends
- HPI YoY
- ▼ -87.97%
- Current HPI
- 313.6313
- Rent YoY
- —
- Metro
- Norwich-New London, CT
- State GDP YoY
- ▲ 1.06%
- F500 in state
- 38
Industry mix (Fortune 500 HQ in CT)
| Industry | F500 HQs | Revenue |
|---|---|---|
| Industrial Machinery | 4 | $38B |
|
||
| Insurance | 3 | $71B |
|
||
| Financial Services | 2 | $25B |
|
||
| Transportation / Logistics | 2 | $18B |
|
||
| Healthcare | 1 | $247B |
|
||
| Telecommunications | 1 | $55B |
|
||
Price history
+80.8% since first listed6 events — show timeline
- 2026-04-12 Pending — Smart MLS
- 2026-04-10 Listed $179,000 Smart MLS
- 2026-04-08 Coming Soon $179,000 Smart MLS
- 2004-09-16 Sold (MLS) $90,000 Smart MLS
- 2004-09-15 Sold (Public Records) $90,000 Public Records
- 2004-07-02 Listed $99,000 Smart MLS
Property tax history
+0.7%/yrLatest (2023): $1,958 · +4.4% YoY. Source: county tax records.
Cash-flow waterfall
monthlySold comps — $/sqft
last 12 mo · ≤1 miLoading sold comps…