34895 Mission Hills Dr · Rancho Mirage, CA
Flood risk 1/10 · Minimal
- FEMA flood zone
- X (unshaded)
- Chance of flooding over 30 yrs
- 0.0%
- Est. flood insurance / yr
- $507 – $1,088
Fire risk 2/10 · Minimal
- Est. fire insurance / yr
- $659 – $1,223
Heat risk 9/10 · Severe
- Hot days now (above 113°F)
- 6 days/yr
- Hot days in 30 yrs
- 16 days/yr
Wind risk 1/10 · Minimal
- Chance of severe wind over 30 yrs
- —
Air-quality risk 4/10 · Minor
- Unhealthy air days now
- 5 days/yr
- Unhealthy air days in 30 yrs
- 7 days/yr
Risk factors via First Street. Map © Google.
Why this score? — see what drove the C grade
The composite is a weighted blend of 9 inputs, each scored 0–100. Each bar is that input's sub-score; the figure is the points it added to the 100-point composite (weight × sub-score).
- Cash flow +25.1/30.0
- DSCR +8.2/10.0
- 1% rule +8.0/10.0
- ARV discount +7.5/15.0
- Rent growth +3.4/5.0
- Schools +2.7/10.0
- Livability +2.6/5.0
- Condition / age +2.5/5.0
- Appreciation +0.0/10.0
$549,000
🖨 Deal sheet 📄 Offer letter ✓ Due diligence
Listing remarks
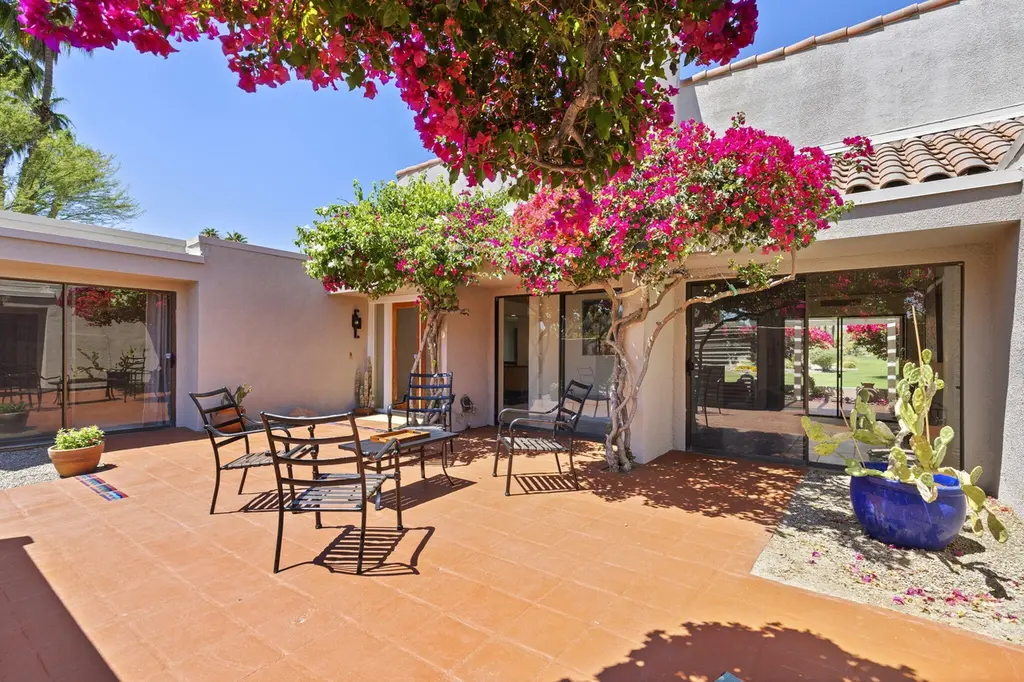
Located a short distance from the guard gates and Club House, Villa Joie, is an example of Mission Hills living at its best. This rare Phase One end unit is ideally positioned with East and West facing vistas. The Villa is surrounded entirely by landscaped grounds built and maintained by the owner. A unique characteristic for Mission Hills Country Club. Step through glass double doors and enter the great room with its dramatic step-down floors, vaulted ceilings and oversized fireplace. This grand home is surrounded by walls of glass and every room has access to the outdoors. The first bedroom has its own entrance on the North side of the home and is perfect for a Casita or home office. Next
Key facts
- Open concept kitchen
- Landscaped grounds
- Glass double doors
Tags
Property features AI
Finance
- Other: View of golf course, pool, park/green belt, mountains, lake and hills; Community in development with on-site golf course; Disclosures include CC&R, pet restrictions, property sold as-is and HOA disclosures; Listing terms: cash to new loan; short-term rentals not allowed; will not consider lease
- Financial info: Land is lease type (land lease details apply)
- HOA & community: Monthly association fee of $1,076; Association covers building & grounds, trash and insurance; Community amenities include controlled access, guest parking and golf course access; Association has pet rules
Exterior
- Parking: Assigned, covered parking with garage door opener; Detached 2-car garage; Total of 4 parking spaces (2 covered)
- Security: Gated community with controlled access and guest parking
- Utilities: Septic tank sewer service; Cable TV available; Within a PUD
- Home design: Contemporary/Mediterranean style condominium; Single-story (ground level); Front door faces east; leisure areas face west
- Construction: Stucco exterior; Clay tile roof; Accessory buildings on property; Year built per assessor
- Exterior features: Located on/near golf course, greenbelt and close to clubhouse; Landscaped grounds; Covered, enclosed patio; End unit; Privacy and wrought-iron fencing; Sprinkler system; Solar system financed
Interior
- Kitchen: Gourmet kitchen with island; Electric cooktop, electric oven, microwave, dishwasher, refrigerator
- Flooring: Carpet; Ceramic tile
- Bathrooms: Three full bathrooms
- Heating & cooling: Central heating (natural gas); Central air and ceiling fans
- Interior features: Beamed and vaulted ceilings with cathedral/high (9 ft+) ceiling areas; Double-door entry and sliding doors; Unfurnished
- Laundry & utility: Laundry area with washer included
Neighborhood map
What this means for you Summary
Snapshot
- This is a 3-bed/3.0-bath condo listed at $549k.
Deal economics
- At list price, monthly cash flow is $1k ($15k/yr) — positive.
- The deal already cash-flows at list — no discount required.
- Meets the 1% rule at list price ($7k rent vs $549k).
- Recommended offer: $541k (1.5% below list) — sets the bar for market timing.
- Cap rate 8.9% vs local median 3.0% in Rancho Mirage — top-decile yield for the area; either an underpriced asset or a hidden risk that comps aren't pricing in. Stress-test before assuming the spread holds.
Location & tenants
- Location reads 51/100 on livability (#1,065 in CA) — a working-class tenant base; expect higher turnover. Strengths: employment A+; Watch: amenities F, commute F, cost of living F.
- Palm Springs Unified (suburban): math 21% / reading 42% proficiency, ranked #328 of 517 in CA (top 63%) — families likely to look elsewhere, expect single-tenant / working-renter base with shorter leases; 73% free/reduced lunch — lower-income household profile, screen leases tightly.
- Market conditions: Rents rising (+3.7%/yr); 529 active listings in the ZIP; 40 comparable units currently listed for rent nearby; rentals lingering (median 44d on market — plan ~5-8 weeks vacancy on turnover, expect pricing pressure); 72% of comp listings sitting > 30 days — soft ceiling on asking rent; solid renter incomes; 9,195 units permitted in Riverside County in 2024 (1,512 in 5+ unit buildings).
- At $7,113/mo this rent would consume 79% of the median local household income ($107k/yr) (locally 498% of renters already pay >50% of income on rent) — very limited rent-growth headroom before tenants either downsize or default.
Forward outlook
- Local home prices are declining (-3.0%/yr); year-one equity from $4k of loan paydown is wiped out by about $16k of value loss. Plan a longer hold.
- Riverside County population projected at +22% by 2050 — long-run rental-demand tailwind backs the buy-and-hold thesis.
- At projected returns (-3.0% appreciation + 3.7% rent growth), your $154k cash investment doubles in ~10 years — after that, you're playing with house money.
Negotiation context
- It's been on market 20 days — a 2% lower offer ($541k) is reasonable based on typical stale-listing flexibility.
- 3 sale attempts since 24y ago with the ask held roughly flat each time — persistent listings suggest the price (not the market) is what's stuck; bring a comps-based counter.
Risks & watch-outs
- Climate carrying-cost: extreme-heat days projected 6→16/yr by 2055 (HVAC capex compounding) — expect insurance premiums to compound above CPI over the hold.
Questions for the listing agent
- Built in 1971 — when were the roof, HVAC, electrical panel, plumbing, and water heater last replaced?
- What does the HOA fee cover, when was the last increase, and are there any pending special assessments or reserve-fund shortfalls?
- Any open or pending special assessments — roof, HVAC, plumbing, elevator, façade? What's the per-unit balance and payoff schedule, and is the seller paying it off at close or rolling it to the buyer?
- Is there a deadline driving the sale (1031 exchange, divorce, estate, relocation)? That informs how much negotiation room exists.
- What's the average days-on-market for RENTAL listings here right now (not sales)? A rising rental-DOM trend means longer vacancies and softer asking-rent achievability than the comps imply.
- What's the recent tenant-quality profile in this submarket — average credit score on applications, eviction rate, late-payment / NSF rate, and stable-employment percentage? A property-management company in the area should have these aggregated.
- How much new apartment / multifamily construction is in the pipeline within 1–3 miles? Heavy new supply (>2% of stock underway) typically softens rents 12–24 months out; light construction supports rent growth.
Investment metrics
- 1% rule
- 1.30% ✓
- Cap rate
- 8.94%
- Cash-on-cash
- 9.44%
- DSCR
- 1.42
- GRM
- 6.4
CMA / ARV
No comps found within radius.
Projected returns pro-forma
-3.0% appreciation · 3.72% rent growth · sell at horizon
- IRR
- -1.1%
- Equity multiple
- 0.96×
- Total profit
- $-6,277
- Equity at exit
- $81,858
- IRR
- 9.5%
- Equity multiple
- 1.76×
- Total profit
- $117,279
- Equity at exit
- $47,467
Cash invested: $153,720 (down + closing). Projections, not guarantees.
Landlord ↔ Tenant lean methodology
- Overall (STATE)
- 18 Strongly Tenant-Friendly
- State California
- 18 Strongly Tenant-Friendly · D+13
- County
- — inherits STATE
- City
- — inherits STATE
ZIP-level market 92270
- Rents YoY
- 3.7%
- Active inventory
- 529
- Price-to-rent
- 6.4×
Monthly cashflow live
- Estimated rent
- $7,113 high interval (Pro) →
- Mortgage (P&I)
- −$2,879
- Tax from tax record
- −$226 /mo · $2,714/yr
- Insurance
- −$229
- HOA
- −$1,076
- Vacancy / Maint / Mgmt
- −$1,494
- Net cashflow
- $1,209
Break-even live
UW: 25.0% down · 7.5% · 30yr · 1.5% tax · 5.0% vac · 8.0% maint · 8.0% mgmt
Financing live
Cash to close
- Down payment
- $137,250
- Closing costs
- $16,470
- Reserves months
- —
- Total cash needed
- —
Loan-product check · same deal, 3 products live
Conventional
25% down · 7.5% · 30yr
- Down + closing
- —
- Monthly P&I
- —
- Monthly cashflow
- —
- DSCR
- —
- Eligible?
- —
Personal DTI + credit; lowest rate.
DSCR
20% down · 8.5% · 30yr
- Down + closing
- —
- Monthly P&I
- —
- Monthly cashflow
- —
- DSCR
- —
- Eligible?
- —
No personal income docs; deal must DSCR.
Hard money
10% down · 12.0% · 12mo
- Down + closing
- —
- Monthly P&I
- —
- Monthly cashflow
- —
- DSCR
- —
- Eligible?
- —
Short-term bridge; refi at stabilization.
Rent comps 40 comps
| Address | Beds | Baths | Sqft | Rent | $/sqft | DOM | Units | Dist |
|---|---|---|---|---|---|---|---|---|
| 645 Hospitality Dr Rancho Mirage, CA | 3.0 | 3.0 | 2727 | $4,300 | $1.58 | 43d | 1 | 0.23mi |
| 35018 Mission Hills Dr Rancho Mirage, CA | 3.0 | 3.0 | 3066 | $7,500 | $2.45 | 16d | 1 | 0.23mi |
| 35018 Mission Hills Dr Rancho Mirage, CA | 3.0 | 3.0 | 3066 | $7,500 | $2.45 | 43d | 1 | 0.23mi |
| 522 Desert West Dr Rancho Mirage, CA | 2.0 | 2.0 | 1984 | $4,500 | $2.27 | 43d | 1 | 0.28mi |
| 35202 Vista del Monte Rancho Mirage, CA | 4.0 | 3.5 | 3650 | $9,000 | $2.47 | 43d | 1 | 0.33mi |
| 624 Hospitality Dr Rancho Mirage, CA | 2.0 | 2.0 | 2000 | $3,295 | $1.65 | 43d | 1 | 0.33mi |
| 714 Inverness Dr Rancho Mirage, CA | 3.0 | 3.0 | 2227 | $3,500 | $1.57 | 43d | 1 | 0.33mi |
| 507 Desert West Dr Rancho Mirage, CA | 3.0 | 2.0 | 2265 | $8,500 | $3.75 | 43d | 1 | 0.37mi |
| 913 Inverness Dr Rancho Mirage, CA | 3.0 | 3.0 | 2690 | $6,800 | $2.53 | 43d | 1 | 0.46mi |
| 9 Via Santanella Rancho Mirage, CA | 3.0 | 4.0 | 3108 | $11,999 | $3.86 | 43d | 1 | 0.57mi |
| 69707 Camino Pacifico Rancho Mirage, CA | 4.0 | 3.5 | 3815 | $9,500 | $2.49 | 14d | 1 | 0.61mi |
| 37 Shoreline Dr Rancho Mirage, CA | 3.0 | 3.0 | 1928 | $3,650 | $1.89 | 43d | 1 | 0.63mi |
| 13 Vista Mirage Way Rancho Mirage, CA | 3.0 | 2.0 | 2071 | $3,700 | $1.79 | 44d | 1 | 0.63mi |
| 104 Loch Lomond Rd Rancho Mirage, CA | 4.0 | 3.0 | 3812 | $15,000 | $3.93 | 21d | 1 | 0.67mi |
| 59 Shoreline Dr Rancho Mirage, CA | 3.0 | 3.5 | 2235 | $3,995 | $1.79 | 43d | 1 | 0.70mi |
| 9 Loch Ness Lake Ct Rancho Mirage, CA | 4.0 | 4.5 | 2373 | $5,000 | $2.11 | 43d | 1 | 0.71mi |
| 829 Inverness Dr Rancho Mirage, CA | 4.0 | 3.0 | 2527 | $11,000 | $4.35 | 12d | 1 | 0.71mi |
| 20 Lincoln Pl Rancho Mirage, CA | 3.0 | 3.5 | 2700 | $3,995 | $1.48 | 43d | 1 | 0.74mi |
| 99 Shoreline Dr Rancho Mirage, CA | 3.0 | 3.0 | 2102 | $4,000 | $1.90 | 43d | 1 | 0.75mi |
| 41 Lincoln Pl Rancho Mirage, CA | 3.0 | 3.0 | 2272 | $4,900 | $2.16 | 43d | 1 | 0.77mi |
| 134 Royal Saint Georges Way Rancho Mirage, CA | 3.0 | 3.5 | 3598 | $12,000 | $3.34 | 43d | 1 | 0.86mi |
| 136 Royal Saint Georges Way Rancho Mirage, CA | 3.0 | 3.0 | 3349 | $13,000 | $3.88 | 20d | 1 | 0.86mi |
| 69 San Marino Cir Rancho Mirage, CA | 3.0 | 2.5 | 2601 | $3,795 | $1.46 | 21d | 1 | 0.89mi |
| 278 Loch Lomond Rd Rancho Mirage, CA | 4.0 | 4.0 | 2471 | $12,000 | $4.86 | 43d | 1 | 0.93mi |
| 70895 Ironwood Dr Rancho Mirage, CA | 4.0 | 2.5 | 2575 | $7,995 | $3.10 | 5d | 1 | 0.98mi |
| 267 Loch Lomond Rd Rancho Mirage, CA | 4.0 | 5.0 | 3038 | $13,000 | $4.28 | 43d | 1 | 1.01mi |
| 71000 Los Altos Ct Rancho Mirage, CA | 3.0 | 4.0 | 4038 | $14,000 | $3.47 | 43d | 1 | 1.01mi |
| 253 Loch Lomond Rd Rancho Mirage, CA | 3.0 | 4.0 | 2452 | $11,900 | $4.85 | 43d | 1 | 1.01mi |
| 24 Via Las Flores Rancho Mirage, CA | 2.0 | 2.0 | 2331 | $6,500 | $2.79 | 43d | 1 | 1.03mi |
| 96 Via Bella Rancho Mirage, CA | 3.0 | 3.5 | 3006 | $13,000 | $4.32 | 43d | 1 | 1.07mi |
| 38 Burgundy Rancho Mirage, CA | 3.0 | 3.0 | 2726 | $4,500 | $1.65 | 18d | 1 | 1.10mi |
| 15 Via Verde Rancho Mirage, CA | 4.0 | 3.0 | 3763 | $8,500 | $2.26 | 43d | 1 | 1.11mi |
| 36726 Jasmine Ln Rancho Mirage, CA | 4.0 | 3.0 | 2539 | $14,000 | $5.51 | 43d | 1 | 1.11mi |
| 22 Calle Escala Rancho Mirage, CA | 3.0 | 2.5 | 2116 | $3,800 | $1.80 | 10d | 1 | 1.14mi |
| 39 Barolo Rancho Mirage, CA | 2.0 | 2.5 | 2509 | $10,000 | $3.99 | 43d | 1 | 1.17mi |
| 70955 Sunny Ln Rancho Mirage, CA | 4.0 | 4.5 | 3623 | $17,500 | $4.83 | 43d | 1 | 1.18mi |
| 42 Colonial Dr Rancho Mirage, CA | 3.0 | 3.0 | 2005 | $3,600 | $1.80 | 21d | 1 | 1.19mi |
| 42 Colonial Dr Rancho Mirage, CA | 3.0 | 3.0 | 2005 | $3,600 | $1.80 | 3d | 1 | 1.19mi |
| 70451 Cobb Rd Rancho Mirage, CA | 3.0 | 2.0 | 2148 | $3,750 | $1.75 | 43d | 1 | 1.20mi |
| 88 Via Las Flores Rancho Mirage, CA | 3.0 | 2.5 | 2333 | $5,000 | $2.14 | 43d | 1 | 1.23mi |
HOA detail condo
- Monthly dues
- $1,076 · $12,912/yr
- Likely covers
- landscaping
- Assessments
- None detected in remarks — confirm with the listing agent.
Listing history 14 events
-
2026-06-18days on market $549,000 Active 20 DOM
-
2026-06-17days on market $549,000 Active 19 DOM
-
2026-06-16days on market $549,000 Active 18 DOM
-
2026-06-15days on market $549,000 Active 17 DOM
-
2026-06-13days on market $549,000 Active 15 DOM
-
2026-06-13days on market $549,000 Active 14 DOM
-
2026-06-09days on market $549,000 Active 11 DOM
-
2026-06-08days on market $549,000 Active 10 DOM
-
2026-06-07days on market $549,000 Active 9 DOM
-
2026-06-04days on market $549,000 Active 6 DOM
-
2026-06-03days on market $549,000 Active 5 DOM
-
2026-06-02days on market $549,000 Active 4 DOM
-
2026-06-01days on market $549,000 Active 3 DOM
-
2026-05-31days on market $549,000 Active 2 DOM
ⓘ Source: listings_history table (triggers on properties + properties_extension) + one-shot
backfill from property_details.listing_events for pre-trigger history.
Tax reassessment forecast CA · Resets to sale price
- Current annual tax
- $2,714 · $226/mo
- Projected year-2 tax
- $4,172 · $348/mo
- Expected delta
- +$1,459/yr (+$122/mo · 53.8%)
ⓘ Screening estimate from a state-policy table — verify with the county assessor before closing.
Climate risk First Street
- Flood 1/10 Low FEMA zone X (unshaded) · 0% chance over 30 yrs
- Wildfire 2/10 Low
- Heat 9/10 Extreme 6 d/yr ≥113°F today · 16 d/yr by 30 yrs out
- Wind 1/10 Low
- Air quality 4/10 Moderate 5 unhealthy d/yr today · 7 by 30 yrs out
Nearby sold comps map
Loading sold comps map…
Walkable amenities ~0.75 mi
Loading nearby amenities…
Taxation est. · year 1
- Rental income
- $85,352
- − Mortgage interest
- −$30,753
- − Property taxes
- −$2,714
- − Insurance
- −$2,745
- − Repairs & maintenance
- −$6,828
- − Management
- −$6,828
- − HOA
- −$12,912
- − Depreciation
- −$15,971
- Taxable income
- $6,602
- Est. tax owed @ 24.0%
- −$1,584
- After-tax cash flow
- $12,925/yr
For passive investors: Depreciation is non-cash, so a rental often shows a tax loss while cash-flowing — sheltering income. Rental losses are passive: they offset passive income freely, and up to $25,000/yr can offset ordinary (W-2) income if you actively participate and your MAGI is under $100k (phasing out to $0 by $150k); unused losses carry forward. On sale, claimed depreciation is recaptured at up to 25%, and gains may owe capital-gains tax (a 1031 exchange can defer both). Figures are a year-1 estimate at your 24.0% rate — not tax advice; consult a CPA.
Schools (NCES district)
- District
- Palm Springs Unified
- NCES district ID
- 0629550
- Math proficiency
- 21% ▼ -7.00%
- Reading proficiency
- 42% ▬ 0.00%
- Median HH income
- $43,638
- Composite
- 26.76/100
- National rank
- #7131
- State rank
- #328 of 517 in CA
Livability — Rancho Mirage
- Score
- 51/100
- State rank
- #1065
- US rank
- #25255
Category grades
Schools grade is shown separately in the Schools card above.
Census & demographics
- Census place
- Rancho Mirage, CA
- County
- Riverside County · 2,287,001 people
- City population
- 17,563
- Metro
- Riverside-San Bernardino-Ontario, CA
- Population (ZIP)
- 17,563
- Household income
- $107,364
- Rent vs Own
- Severe rent burden
- 498.0
Population outlook (Riverside County) Hauer SSP2
- Today (2025)
- 2,664,475 people
- By 2030
- 2,802,692 · +5.2%
- By 2040
- 3,050,904 · +14.5%
- By 2050
- 3,256,783 · +22.2%
- By 2075
- 3,655,058 · +37.2%
- By 2100
- 3,766,594 · +41.4%
Race, ethnicity, and origin ACS 2023
- Neighborhood character
- Predominantly White (77%)
- Race & ethnicity
- White 77% Hispanic / Latino 15% Two or more races 6% Asian 4% Black 2%
- Hispanic origin (detail)
- Mexican 12%
- Common ancestry
- Slovak 4% Romanian 3% Lithuanian 3%
- Foreign-born
- 17% · Canada, South Korea, China
- Languages at home
- 81% English-only · Spanish 11% Other Indo-European 3% French/Haitian/Cajun 1%
Political lean MEDSL · Riverside
- 2024 margin
- Toss-up / Even · D 48.0% · R 49.3% · Other 2.6%
- 2008→2024 swing
- -3.6pp toward R · 2008: 2.3pp · 2024: -1.3pp
- All cycles
- 2024: R+1.3 2020: D+8.0 2016: D+4.3 2012: R+0.4 2008: D+2.3
Not yet ingested
- Civics
- —
Market trends
- HPI YoY
- ▼ -210.99%
- Current HPI
- 282.2957
- Rent YoY
- ▲ 3.72%
- Metro
- Riverside-San Bernardino-Ontario, CA
- State GDP YoY
- ▲ 3.21%
- F500 in state
- 116
Industry mix (Fortune 500 HQ in CA)
| Industry | F500 HQs | Revenue |
|---|---|---|
| Technology | 27 | $1,492B |
|
||
| Financial Services | 3 | $174B |
|
||
| Retail | 3 | $44B |
|
||
| Insurance | 3 | $26B |
|
||
| Media / Entertainment | 2 | $115B |
|
||
| Pharmaceuticals / Biotech | 2 | $62B |
|
||
Price history
+42.6% since first listed5 events — show timeline
- 2026-05-29 Listed $549,000 GPSMLS
- 2003-01-20 Listing Removed — GPSMLS
- 2002-12-02 Listed $299,000 GPSMLS
- 2002-10-31 Listing Removed — GPSMLS
- 2002-07-22 Listed $385,000 GPSMLS
Property tax history
+2.1%/yrLatest (2025): $2,714 · -1.5% YoY. Source: county tax records.
Cash-flow waterfall
monthlySold comps — $/sqft
last 12 mo · ≤1 miLoading sold comps…