 Duplex
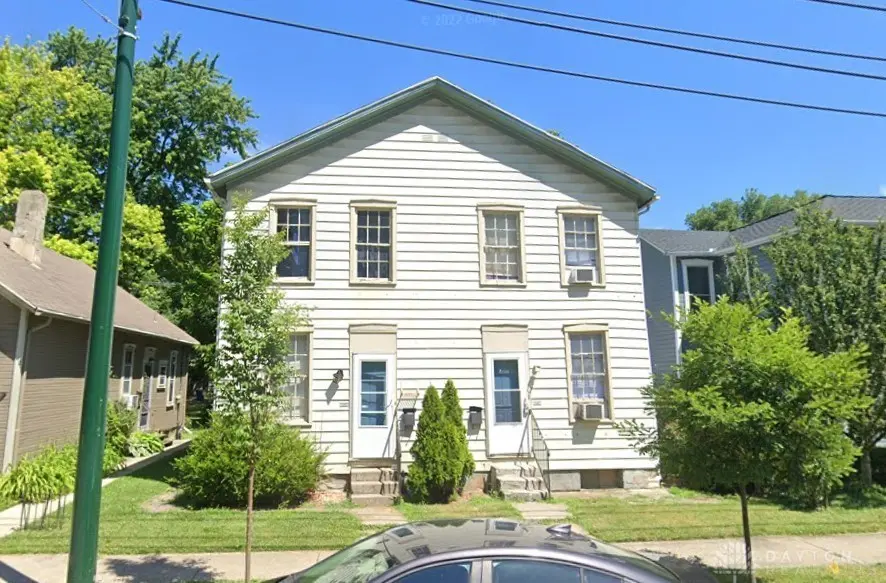
553 Wyoming St · Dayton, OH
Flood risk 1/10 · Minimal
- FEMA flood zone
- X (unshaded)
- Chance of flooding over 30 yrs
- 0.0%
- Est. flood insurance / yr
- $473 – $860
Fire risk 1/10 · Minimal
- Est. fire insurance / yr
- $713 – $1,323
Heat risk 4/10 · Minor
- Hot days now (above 101°F)
- 7 days/yr
- Hot days in 30 yrs
- 18 days/yr
Wind risk 2/10 · Minimal
- Chance of severe wind over 30 yrs
- 0.0%
Air-quality risk 3/10 · Minor
- Unhealthy air days now
- 3 days/yr
- Unhealthy air days in 30 yrs
- 5 days/yr
Risk factors via First Street. Map © Google.
Why this score? — see what drove the C grade
The composite is a weighted blend of 9 inputs, each scored 0–100. Each bar is that input's sub-score; the figure is the points it added to the 100-point composite (weight × sub-score).
- Cash flow +24.5/30.0
- ARV discount +8.4/15.0
- DSCR +7.9/10.0
- 1% rule +6.2/10.0
- Rent growth +5.0/5.0
- Livability +3.2/5.0
- Condition / age +2.5/5.0
- Schools +1.3/10.0
- Appreciation +0.0/10.0
$220,000
🖨 Deal sheet 📄 Offer letter ✓ Due diligence
Multi-family units
County records classify this as Multi-Family (2-4 Unit). Listing-text estimate: 2 units. confirmed
Listing remarks MLS
Located in the desirable South Park neighborhood, this duplex is fully occupied. It has a NEW ROOF. Tenants pay all utilities
Key facts
- New roof
- 7,562 sq ft lot
- Built 1865
Tags
Neighborhood map
What this means for you Summary
Snapshot
- This is a 2 × 2-bed/1.0-bath units multifamily listed at $220k.
Deal economics
- At list price, monthly cash flow is $451 ($5k/yr) — positive. Per door: $226/mo.
- The deal already cash-flows at list — no discount required.
- Meets the 1% rule at list price ($2k rent vs $220k).
- Recommended offer: $194k (12.0% below list) — sets the bar for market timing.
Location & tenants
- Location reads 65/100 on livability (#716 in OH) — a middle-class / working-renter tenant base. Strengths: cost of living A+, housing A+, health & safety A; Watch: schools C-, amenities C-, crime F.
- Dayton City (urban): math 12% / reading 21% proficiency, ranked #641 of 656 in OH (top 98%) — low school quality limits family demand, transient renter base, plan for 1-2y turnover; 74% free/reduced lunch — lower-income household profile, screen leases tightly.
- Market conditions: Rents rising fast (+11.4%/yr); 92 active listings in the ZIP; 24 comparable units currently listed for rent nearby; rentals at typical pace (median 14d on market — plan ~3-4 weeks tenant-placement turnaround); 907 units permitted in Montgomery County in 2024 (416 in 5+ unit buildings).
- At $2,474/mo this rent would consume 64% of the median local household income ($47k/yr) (locally 961% of renters already pay >50% of income on rent) — very limited rent-growth headroom before tenants either downsize or default.
Forward outlook
- Local home prices are declining (-3.0%/yr); year-one equity from $2k of loan paydown is wiped out by about $7k of value loss. Plan a longer hold.
- Montgomery County population projected at -10% by 2050 — secular population decline; favor cash flow + early exit over multi-decade hold.
- At projected returns (-3.0% appreciation + 8.0% rent growth), your $62k cash investment doubles in ~8 years — after that, you're playing with house money.
Negotiation context
- It's been on market 160 days — a 12% lower offer ($194k) is reasonable based on typical stale-listing flexibility.
Risks & watch-outs
- Watch-outs: built in 1865 — expect roof / HVAC / electrical / plumbing capex.
Questions for the listing agent
- It's been on market 160 days. Have you received any prior offers? Is the seller open to a 12% concession, seller financing, or rate buy-down credit?
- Can we see the unit-by-unit rent roll, current vacancy, and any below-market leases? What's the average tenancy length?
- What capital expenditures (roof, boiler, parking lot, exteriors) have been made in the last 5 years, and what's planned in the next 2?
- Built in 1865 — when were the roof, HVAC, electrical panel, plumbing, and water heater last replaced?
- Why hasn't it sold? Are there any deal-killer items the seller is aware of (foundation, flood, title, zoning, code violations)?
- Is there a deadline driving the sale (1031 exchange, divorce, estate, relocation)? That informs how much negotiation room exists.
- Crime grade is F in this area — have there been break-ins, vandalism, or insurance claims at this property in the last 3 years? What carrier currently insures it and at what premium?
- What's the average days-on-market for RENTAL listings here right now (not sales)? A rising rental-DOM trend means longer vacancies and softer asking-rent achievability than the comps imply.
- What's the recent tenant-quality profile in this submarket — average credit score on applications, eviction rate, late-payment / NSF rate, and stable-employment percentage? A property-management company in the area should have these aggregated.
- How much new apartment / multifamily construction is in the pipeline within 1–3 miles? Heavy new supply (>2% of stock underway) typically softens rents 12–24 months out; light construction supports rent growth.
Investment metrics
- 1% rule
- 1.12% ✓
- Cap rate
- 8.75%
- Cash-on-cash
- 8.79%
- DSCR
- 1.39
- GRM
- 7.4
CMA / ARV
- ARV (median comp)
- $224,406
- List price
- $220,000
- Delta
- -1.96%
- Verdict
- FAIR
- Comps
- 20 within 1.0 mi
Show comp detail 6 sales within ~0.75 mi
| Address | Dist | Beds/Ba | Sqft | Sold | Price | $/sf | Match |
|---|---|---|---|---|---|---|---|
| 110-112 Johnson St | 0.29mi | 4/2.0 | 2,418 (+10%) | 0mo | $255,000 | $105 | 69 |
| 161 Park Dr | 0.28mi | 4/2.0 | 1,950 (-11%) | 3mo | $226,000 | $116 | 66 |
| 319 Morton Ave Unit 317-319 | 0.38mi | 4/2.0 | 2,312 (+6%) | 13mo | $241,000 | $104 | 62 |
| 438 Clover St | 0.36mi | 4/4.0 | 2,156 (-2%) | 16mo | $155,000 | $72 | 59 |
| 349 Morton Ave | 0.34mi | 5/2.0 (+1) | 2,400 (+10%) | 7mo | $322,500 | $134 | 58 |
| 48 Indiana Ave | 0.68mi | 4/2.0 | 1,924 (-12%) | 11mo | $145,000 | $75 | 38 |
Match score weights: distance 35% · size 25% · config 20% · recency 20%. Top-matched comps best support the ARV.
Projected returns pro-forma
-3.0% appreciation · 8.0% rent growth · sell at horizon
- IRR
- 2.5%
- Equity multiple
- 1.10×
- Total profit
- $6,199
- Equity at exit
- $32,803
- IRR
- 16.4%
- Equity multiple
- 2.66×
- Total profit
- $102,030
- Equity at exit
- $19,022
Cash invested: $61,600 (down + closing). Projections, not guarantees.
Landlord ↔ Tenant lean methodology
- Overall (STATE)
- 73 Landlord-Friendly
- State Ohio
- 73 Landlord-Friendly · R+6
- County
- — inherits STATE
- City
- — inherits STATE
ZIP-level market 45410
- Home prices YoY
- -21.4%
- Rents YoY
- 11.4%
- Active inventory
- 92
- Price-to-rent
- 14.8×
Monthly cashflow live
- Estimated rent
- $2,474 high interval (Pro) →
- Mortgage (P&I)
- −$1,154
- Tax from tax record
- −$258 /mo · $3,093/yr
- Insurance
- −$92
- HOA
- −$0
- Vacancy / Maint / Mgmt
- −$520
- Net cashflow
- $451
Break-even live
2-unit breakdown (identical units grouped — click to expand)
| Units | Beds | Baths | Est. rent |
|---|---|---|---|
| 2× units | 2 | 1 | $2,474 |
| #1 | 2 | 1 | $1,237 |
| #2 | 2 | 1 | $1,237 |
| Total (2 units) | $2,474 | ||
UW: 25.0% down · 7.5% · 30yr · 1.5% tax · 5.0% vac · 8.0% maint · 8.0% mgmt
Financing live
Cash to close
- Down payment
- $55,000
- Closing costs
- $6,600
- Reserves months
- —
- Total cash needed
- —
Loan-product check · same deal, 3 products live
Conventional
25% down · 7.5% · 30yr
- Down + closing
- —
- Monthly P&I
- —
- Monthly cashflow
- —
- DSCR
- —
- Eligible?
- —
Personal DTI + credit; lowest rate.
DSCR
20% down · 8.5% · 30yr
- Down + closing
- —
- Monthly P&I
- —
- Monthly cashflow
- —
- DSCR
- —
- Eligible?
- —
No personal income docs; deal must DSCR.
Hard money
10% down · 12.0% · 12mo
- Down + closing
- —
- Monthly P&I
- —
- Monthly cashflow
- —
- DSCR
- —
- Eligible?
- —
Short-term bridge; refi at stabilization.
Rent comps 24 comps
| Address | Beds | Baths | Sqft | Rent | $/sqft | DOM | Units | Dist |
|---|---|---|---|---|---|---|---|---|
| 320 Park Dr Dayton, OH | 4.0 | 3.0 | 2100 | $2,400 | $1.14 | 14d | 1 | 0.09mi |
| 1603 Manette Pl Dayton, OH | 4.0 | 2.0 | 2000 | $1,695 | $0.85 | 14d | 1 | 0.19mi |
| 229 James St Unit 228 Dayton, OH | 3.0 | 1.0 | 1700 | $1,200 | $0.71 | 23d | 1 | 0.30mi |
| 227 James St Unit 1 Dayton, OH | 3.0 | 1.0 | 1700 | $1,200 | $0.71 | 3d | 1 | 0.30mi |
| 244 Quitman St Unit A Dayton, OH | 3.0 | 1.0 | 1987 | $1,325 | $0.67 | 23d | 1 | 0.31mi |
| 228 James St Dayton, OH | 3.0 | 1.0 | 1700 | $1,200 | $0.71 | 43d | 1 | 0.32mi |
| 319 Wyoming St Dayton, OH | 4.0 | 2.5 | 2064 | $2,000 | $0.97 | 2d | 1 | 0.32mi |
| 438 Clover St Dayton, OH | 3.0 | 2.0 | 2156 | $1,025 | $0.48 | 43d | 1 | 0.38mi |
| 32 Gebhart St Dayton, OH | 4.0 | 1.0 | 1800 | $1,400 | $0.78 | 14d | 1 | 0.41mi |
| 2114 Wayne Ave Dayton, OH | 4.0 | 2.0 | 1723 | $1,595 | $0.93 | 43d | 1 | 0.62mi |
| 2132 Wayne Ave Dayton, OH | 3.0 | 2.0 | 1484 | $1,350 | $0.91 | 2d | 1 | 0.65mi |
| 534 Beckman St Dayton, OH | 3.0 | 2.0 | 1452 | $1,400 | $0.96 | 2d | 1 | 0.68mi |
| 23 Jasper St Dayton, OH | 4.0 | 4.0 | 1490 | $3,600 | $2.42 | 3d | 1 | 0.74mi |
| 218 Brown St Dayton, OH | 3.0 | 2.5 | 1800 | $3,200 | $1.78 | 43d | 1 | 0.76mi |
| 218 Brown St Unit 218 Dayton, OH | 3.0 | 2.5 | 1789 | $2,200 | $1.23 | 43d | 1 | 0.76mi |
| 216 Brown St Dayton, OH | 3.0 | 1.5 | 1563 | $2,500 | $1.60 | 43d | 1 | 0.76mi |
| 511 Parrot St Dayton, OH | 3.0 | 1.5 | 1618 | $1,100 | $0.68 | 14d | 1 | 0.77mi |
| 1515 Wyoming St Dayton, OH | 3.0 | 1.0 | 1400 | $1,000 | $0.71 | 43d | 1 | 0.78mi |
| 121 E Schantz Ave #3 Dayton, OH | 3.0 | 2.0 | 2200 | $3,500 | $1.59 | 2d | 1 | 1.11mi |
| 1112 Irving Ave Dayton, OH | 3.0 | 4.0 | 2041 | $4,500 | $2.20 | 3d | 1 | 1.20mi |
| 204 Sears St Dayton, OH | 3.0 | 1.0–2.5 | 1124 | $2,793 | $2.48 | 2d | 10 | 1.29mi |
| 836 Wellmeier Ave Dayton, OH | 4.0 | 1.0 | 2148 | $1,500 | $0.70 | 3d | 1 | 1.31mi |
| 140 E Monument Ave Dayton, OH | 3.0 | 1.0–2.0 | 1048 | $2,344 | $2.24 | 2d | 11 | 1.46mi |
| 115 Livingston Ave Dayton, OH | 3.0 | 1.0 | 1624 | $1,450 | $0.89 | 44d | 1 | 1.48mi |
Listing history 16 events
-
2026-06-18days on market $220,000 Active 160 DOM
-
2026-06-17days on market $220,000 Active 159 DOM
-
2026-06-16days on market $220,000 Active 158 DOM
-
2026-06-15days on market $220,000 Active 157 DOM
-
2026-06-14days on market $220,000 Active 155 DOM
-
2026-06-13days on market $220,000 Active 154 DOM
-
2026-06-10days on market $220,000 Active 152 DOM
-
2026-06-09days on market $220,000 Active 151 DOM
-
2026-06-08days on market $220,000 Active 150 DOM
-
2026-06-07days on market $220,000 Active 149 DOM
-
2026-06-05days on market $220,000 Active 146 DOM
-
2026-06-03days on market $220,000 Active 145 DOM
-
2026-06-02days on market $220,000 Active 144 DOM
-
2026-06-01days on market $220,000 Active 143 DOM
-
2026-05-31days on market $220,000 Active 142 DOM
-
2026-01-09$220,000 Active 125-char remark
Show marketing remark (125 chars)
Located in the desirable South Park neighborhood, this duplex is fully occupied. It has a NEW ROOF. Tenants pay all utilities
ⓘ Source: listings_history table (triggers on properties + properties_extension) + one-shot
backfill from property_details.listing_events for pre-trigger history.
Tax reassessment forecast OH · Partial reset (capped growth)
- Current annual tax
- $3,093 · $258/mo
- Projected year-2 tax
- $3,262 · $272/mo
- Expected delta
- +$170/yr (+$14/mo · 5.5%)
ⓘ Screening estimate from a state-policy table — verify with the county assessor before closing.
Climate risk First Street
- Flood 1/10 Low FEMA zone X (unshaded) · 0% chance over 30 yrs
- Wildfire 1/10 Low
- Heat 4/10 Moderate 7 d/yr ≥101°F today · 18 d/yr by 30 yrs out
- Wind 2/10 Low 0% chance of damaging wind over 30 yrs
- Air quality 3/10 Moderate 3 unhealthy d/yr today · 5 by 30 yrs out
Nearby sold comps map
Loading sold comps map…
Walkable amenities ~0.75 mi
Loading nearby amenities…
Taxation est. · year 1
- Rental income
- $29,688
- − Mortgage interest
- −$12,323
- − Property taxes
- −$3,093
- − Insurance
- −$1,100
- − Repairs & maintenance
- −$2,375
- − Management
- −$2,375
- − Depreciation
- −$6,400
- Taxable income
- $2,022
- Est. tax owed @ 24.0%
- −$485
- After-tax cash flow
- $4,931/yr
For passive investors: Depreciation is non-cash, so a rental often shows a tax loss while cash-flowing — sheltering income. Rental losses are passive: they offset passive income freely, and up to $25,000/yr can offset ordinary (W-2) income if you actively participate and your MAGI is under $100k (phasing out to $0 by $150k); unused losses carry forward. On sale, claimed depreciation is recaptured at up to 25%, and gains may owe capital-gains tax (a 1031 exchange can defer both). Figures are a year-1 estimate at your 24.0% rate — not tax advice; consult a CPA.
Schools (NCES district)
- District
- Dayton City
- NCES district ID
- 3904384
- Math proficiency
- 12% ▼ -12.00%
- Reading proficiency
- 21% ▼ -11.00%
- Median HH income
- $28,688
- Composite
- 12.94/100
- National rank
- #9579
- State rank
- #641 of 656 in OH
Livability — Dayton
- Score
- 65/100
- State rank
- #716
- US rank
- #12895
Category grades
Schools grade is shown separately in the Schools card above.
Census & demographics
- Census place
- Dayton, OH
- County
- Montgomery County · 459,541 people
- City population
- 164,387
- Metro
- Dayton-Kettering, OH
- Population (ZIP)
- 14,694
- Household income
- $46,651
- Rent vs Own
- Severe rent burden
- 961.0
Population outlook (Montgomery County) Hauer SSP2
- Today (2025)
- 523,241 people
- By 2030
- 514,948 · -1.6%
- By 2040
- 493,378 · -5.7%
- By 2050
- 469,639 · -10.2%
- By 2075
- 418,360 · -20.0%
- By 2100
- 353,315 · -32.5%
Race, ethnicity, and origin ACS 2023
- Neighborhood character
- Predominantly White (71%)
- Race & ethnicity
- White 71% Black 15% Hispanic / Latino 7% Two or more races 6% Asian 1%
- Hispanic origin (detail)
- Mexican 3%
- Common ancestry
- Lithuanian 2% Iranian 2% Slovak 2%
- Foreign-born
- 5% · Canada, United Kingdom
- Languages at home
- 91% English-only · Spanish 6% Tagalog/Filipino 1% Other Asian/Pacific 1%
Political lean MEDSL · Montgomery
- 2024 margin
- Toss-up / Even · D 49.8% · R 49.3%
- 2008→2024 swing
- -5.8pp toward R · 2008: 6.2pp · 2024: 0.5pp
- All cycles
- 2024: D+0.5 2020: D+2.2 2016: R+1.2 2012: D+3.1 2008: D+6.2
Not yet ingested
- Civics
- —
Market trends
- HPI YoY
- ▼ -100.61%
- Current HPI
- 369.3938
- Rent YoY
- ▲ 11.37%
- Metro
- Dayton-Kettering, OH
- State GDP YoY
- ▲ 1.98%
- F500 in state
- 48
Industry mix (Fortune 500 HQ in OH)
| Industry | F500 HQs | Revenue |
|---|---|---|
| Insurance | 3 | $145B |
|
||
| Industrial Machinery | 3 | $49B |
|
||
| Financial Services | 3 | $24B |
|
||
| Consumer Goods | 2 | $93B |
|
||
| Aerospace / Defense | 2 | $47B |
|
||
| Utilities | 2 | $33B |
|
||
Price history
1 event — show timeline
- 2026-01-09 Listed $220,000 Dayton MLS
Property tax history
+3.5%/yrLatest (2025): $3,093 · -0.2% YoY. Source: county tax records.
Cash-flow waterfall
monthlySold comps — $/sqft
last 12 mo · ≤1 miLoading sold comps…