13115 140th Ave NW · Stansberry Lake, WA
Flood risk 1/10 · Minimal
- FEMA flood zone
- X (unshaded)
- Chance of flooding over 30 yrs
- 0.0%
- Est. flood insurance / yr
- $507 – $1,088
Fire risk 3/10 · Minor
- Est. fire insurance / yr
- $604 – $1,122
Heat risk 3/10 · Minor
- Hot days now (above 87°F)
- 7 days/yr
- Hot days in 30 yrs
- 14 days/yr
Wind risk 1/10 · Minimal
- Chance of severe wind over 30 yrs
- —
Air-quality risk 6/10 · Moderate
- Unhealthy air days now
- 7 days/yr
- Unhealthy air days in 30 yrs
- 8 days/yr
Risk factors via First Street. Map © Google.
Why this score? — see what drove the B grade
The composite is a weighted blend of 9 inputs, each scored 0–100. Each bar is that input's sub-score; the figure is the points it added to the 100-point composite (weight × sub-score).
- Cash flow +30.0/30.0
- DSCR +10.0/10.0
- 1% rule +8.9/10.0
- ARV discount +7.5/15.0
- Schools +6.0/10.0
- Livability +3.2/5.0
- Rent growth +2.5/5.0
- Condition / age +2.5/5.0
- Appreciation +0.0/10.0
$140,000
🖨 Deal sheet (PDF) 📄 Offer letter ✓ Due diligence
Listing remarks
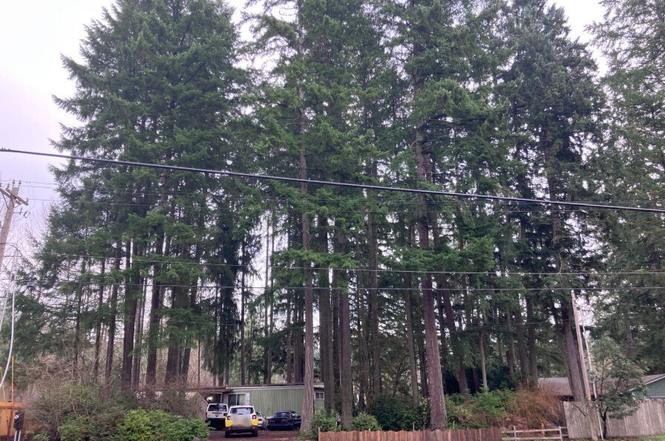
Unlock the potential of this 15,000 sq ft lot in the desirable Lake of the Woods community in Gig Harbor, Washington. Being sold cash-out, as-is, this property offers mature timber and a rare opportunity to invest, renovate, or reimagine. Currently situated on the lot is an 840 sq ft singlewide manufactured home featuring 2 bedrooms and 1.75 baths. Whether you're looking for a project, land value, or future development potential, this property delivers flexibility and upside. Conveniently located with an easy commute to shopping, dining, entertainment, and major employment. Cash Out As-Is, Where-Is.
Key facts
- Mature timber
- 15
- 000 sq ft lot
Tags
Neighborhood map
What this means for you Summary
Snapshot
- This is a 3-bed/2.0-bath manufactured listed at $140k.
Deal economics
- At list price, monthly cash flow is $527 ($6k/yr) — positive.
- The deal already cash-flows at list — no discount required.
- Meets the 1% rule at list price ($2k rent vs $140k).
- Recommended offer: $136k (3.0% below list) — sets the bar for market timing.
Location & tenants
- Location reads 64/100 on livability (#358 in WA) — a middle-class / working-renter tenant base. Strengths: crime A+, employment A+, housing A+; Watch: cost of living C-, health & safety C-, amenities F.
- Peninsula School District (suburban): math 61% / reading 72% proficiency, ranked #21 of 291 in WA (top 7%) — acceptable for families but not a draw, mixed tenant base, ~2y average lease; only 19% free/reduced lunch — higher-income household profile.
- Zoned schools: Vaughn Elementary School (327 students, 42% FRL); Key Peninsula Middle School (469 students, 42% FRL); Peninsula High School (1,372 students, 28% FRL) — zoned schools average 38% FRL vs 19% district-wide (19 pts higher); higher-poverty schools than district average — tighter screening recommended.
- Market conditions: 96 active listings in the ZIP; 1 comparable units currently listed for rent nearby; 3,209 units permitted in Pierce County in 2024 (1,269 in 5+ unit buildings).
Forward outlook
- Local home prices are declining (-3.0%/yr); year-one equity from $968 of loan paydown is wiped out by about $4k of value loss. Plan a longer hold.
- Pierce County population projected at +26% by 2050 — long-run rental-demand tailwind backs the buy-and-hold thesis.
- At projected returns (-3.0% appreciation + 3.0% rent growth), your $39k cash investment doubles in ~8 years — after that, you're playing with house money.
Negotiation context
- It's been on market 35 days — a 3% lower offer ($136k) is reasonable based on typical stale-listing flexibility.
Questions for the listing agent
- It's been on market 35 days. Have you received any prior offers? Is the seller open to a 3% concession, seller financing, or rate buy-down credit?
- Built in 1971 — when were the roof, HVAC, electrical panel, plumbing, and water heater last replaced?
- What does the HOA fee cover, when was the last increase, and are there any pending special assessments or reserve-fund shortfalls?
- Is there a deadline driving the sale (1031 exchange, divorce, estate, relocation)? That informs how much negotiation room exists.
- Schools are F-rated, which usually means shorter tenancies and higher turnover. Who's the typical renter profile here, and what's been the actual vacancy rate?
- What's the average days-on-market for RENTAL listings here right now (not sales)? A rising rental-DOM trend means longer vacancies and softer asking-rent achievability than the comps imply.
- What's the recent tenant-quality profile in this submarket — average credit score on applications, eviction rate, late-payment / NSF rate, and stable-employment percentage? A property-management company in the area should have these aggregated.
- How much new for-sale + rental construction is in the pipeline within 1–3 miles? Heavy new supply typically softens prices + rents 12–24 months out; constrained supply supports both.
Investment metrics
- 1% rule
- 1.39% ✓
- Cap rate
- 10.81%
- Cash-on-cash
- 16.13%
- DSCR
- 1.72
- GRM
- 6.0
CMA / ARV
- ARV (on-the-fly)
- $309,120
- Comps found
- 2
Show comp detail 2 sales within ~0.75 mi
| Address | Dist | Beds/Ba | Sqft | Sold | Price | $/sf | Match |
|---|---|---|---|---|---|---|---|
| 13115 140th Ave NW | 0.00mi | 2/2.0 (-1) | 840 (0%) | 0mo | $120,000 | $143 | 95 |
| 13618 130th St NW | 0.23mi | 2/1.0 (-1) | 924 (+10%) | 18mo | $340,000 | $368 | 48 |
Match score weights: distance 35% · size 25% · config 20% · recency 20%. Top-matched comps best support the ARV.
Projected returns pro-forma
-3.0% appreciation · 3.0% rent growth · sell at horizon
- IRR
- 7.1%
- Equity multiple
- 1.28×
- Total profit
- $10,936
- Equity at exit
- $20,874
- IRR
- 16.5%
- Equity multiple
- 2.35×
- Total profit
- $52,977
- Equity at exit
- $12,105
Cash invested: $39,200 (down + closing). Projections, not guarantees.
Landlord ↔ Tenant lean methodology
- Overall (STATE)
- 28 Tenant-Leaning
- State Washington
- 28 Tenant-Leaning · D+8
- County
- — inherits STATE
- City
- — inherits STATE
ZIP-level market 98329
- Active inventory
- 96
- Price-to-rent
- 6.0×
Monthly cashflow live
- Estimated rent
- $1,950 medium interval (Pro) →
- Mortgage (P&I)
- −$734
- Tax est. 1.5%
- −$175 /mo · $2,100/yr
- Insurance
- −$58
- HOA
- −$46
- Vacancy / Maint / Mgmt
- −$410
- Net cashflow
- $527
Break-even live
Sensitivity live
| Price | -10% $624 | -5% $575 | +0% $527 | +5% $479 | +10% $430 |
|---|---|---|---|---|---|
| Rent | -10% $373 | -5% $450 | +0% $527 | +5% $604 | +10% $681 |
| Rate | -1.0pp $597 | -0.5pp $563 | base $527 | +0.5pp $491 | +1.0pp $454 |
UW: 25.0% down · 7.5% · 30yr · 1.5% tax · 5.0% vac · 8.0% maint · 8.0% mgmt
Financing live
Cash to close
- Down payment
- $35,000
- Closing costs
- $4,200
- Reserves months
- —
- Total cash needed
- —
Loan-product check · same deal, 3 products live
Conventional
25% down · 7.5% · 30yr
- Down + closing
- —
- Monthly P&I
- —
- Monthly cashflow
- —
- DSCR
- —
- Eligible?
- —
Personal DTI + credit; lowest rate.
DSCR
20% down · 8.5% · 30yr
- Down + closing
- —
- Monthly P&I
- —
- Monthly cashflow
- —
- DSCR
- —
- Eligible?
- —
No personal income docs; deal must DSCR.
Hard money
10% down · 12.0% · 12mo
- Down + closing
- —
- Monthly P&I
- —
- Monthly cashflow
- —
- DSCR
- —
- Eligible?
- —
Short-term bridge; refi at stabilization.
Rent comps 1 comps
| Address | Beds | Baths | Sqft | Rent | $/sqft | DOM | Units | Dist |
|---|---|---|---|---|---|---|---|---|
| 14214 Holly Burn Ln NW Gig Harbor, WA | 3.0 | 1.0 | 1040 | $1,950 | $1.88 | 26d | 1 | 0.90mi |
HOA detail
- Monthly dues
- $46 · $552/yr
Listing history 2 events
-
2026-04-08status Pending
-
2026-03-04$140,000 Active
ⓘ Source: listings_history table (triggers on properties + properties_extension) + one-shot
backfill from property_details.listing_events for pre-trigger history.
Climate risk First Street
- Flood 1/10 Low FEMA zone X (unshaded) · 0% chance over 30 yrs
- Wildfire 3/10 Moderate
- Heat 3/10 Moderate 7 d/yr ≥87°F today · 14 d/yr by 30 yrs out
- Wind 1/10 Low
- Air quality 6/10 Major 7 unhealthy d/yr today · 8 by 30 yrs out
Nearby sold comps map
Loading sold comps map…
Walkable amenities ~0.75 mi
Loading nearby amenities…
Taxation est. · year 1
- Rental income
- $23,400
- − Mortgage interest
- −$7,842
- − Property taxes
- −$2,100
- − Insurance
- −$700
- − Repairs & maintenance
- −$1,872
- − Management
- −$1,872
- − HOA
- −$552
- − Depreciation
- −$4,073
- Taxable income
- $4,389
- Est. tax owed @ 24.0%
- −$1,053
- After-tax cash flow
- $5,271/yr
For passive investors: Depreciation is non-cash, so a rental often shows a tax loss while cash-flowing — sheltering income. Rental losses are passive: they offset passive income freely, and up to $25,000/yr can offset ordinary (W-2) income if you actively participate and your MAGI is under $100k (phasing out to $0 by $150k); unused losses carry forward. On sale, claimed depreciation is recaptured at up to 25%, and gains may owe capital-gains tax (a 1031 exchange can defer both). Figures are a year-1 estimate at your 24.0% rate — not tax advice; consult a CPA.
Schools (NCES district)
- District
- Peninsula School District
- NCES district ID
- 5306690
- Math proficiency
- 61% ▲ 1.00%
- Reading proficiency
- 72% ▼ -1.00%
- Median HH income
- $76,796
- Composite
- 60.35/100
- National rank
- #1718
- State rank
- #21 of 291 in WA
Livability — Stansberry Lake
- Score
- 64/100
- State rank
- #358
- US rank
- #13660
Category grades
Schools grade is shown separately in the Schools card above.
Census & demographics
- Census place
- Stansberry Lake, WA
- Population (ZIP)
- 11,379
Population outlook (Pierce County) Hauer SSP2
- Today (2025)
- 956,648 people
- By 2030
- 1,010,862 · +5.7%
- By 2040
- 1,113,170 · +16.4%
- By 2050
- 1,206,524 · +26.1%
- By 2075
- 1,436,425 · +50.2%
- By 2100
- 1,563,654 · +63.5%
Race, ethnicity, and origin ACS 2023
- Neighborhood character
- Predominantly White (85%)
- Race & ethnicity
- White 85% Two or more races 11% Hispanic / Latino 5% Asian 1%
- Hispanic origin (detail)
- Mexican 2%
- Common ancestry
- Portuguese 8% Italian 4% Slovak 3%
- Foreign-born
- 4% · China, Canada
- Languages at home
- 96% English-only · Russian/Polish/Slavic 2% French/Haitian/Cajun 1% Other Asian/Pacific 1%
Political lean MEDSL · Pierce
- 2024 margin
- D (+10.8) · D 53.9% · R 43.1% · Other 3.0%
- 2008→2024 swing
- -1.4pp toward R · 2008: 12.2pp · 2024: 10.8pp
- All cycles
- 2024: D+10.8 2020: D+11.2 2016: D+7.5 2012: D+11.0 2008: D+12.2
Not yet ingested
- Civics
- —
Market trends
- HPI YoY
- ▼ -203.87%
- Current HPI
- 377.3837
- Rent YoY
- —
- Metro
- —
- State GDP YoY
- ▲ 4.65%
- F500 in state
- 22
Industry mix (Fortune 500 HQ in WA)
| Industry | F500 HQs | Revenue |
|---|---|---|
| Retail | 2 | $269B |
|
||
| Technology / Retail | 1 | $638B |
|
||
| Technology | 1 | $245B |
|
||
| Telecommunications | 1 | $38B |
|
||
| Food / Beverage | 1 | $36B |
|
||
| Automotive / Trucks | 1 | $34B |
|
||
Price history
2 events — show timeline
- 2026-04-08 Pending — NWMLS as Distributed by MLS Grid
- 2026-03-04 Listed $140,000 NWMLS as Distributed by MLS Grid
Property tax history
+3.7%/yrLatest (2026): $108 · +15.5% YoY. Source: county tax records.
Cash-flow waterfall
monthlySold comps — $/sqft
last 12 mo · ≤1 miLoading sold comps…