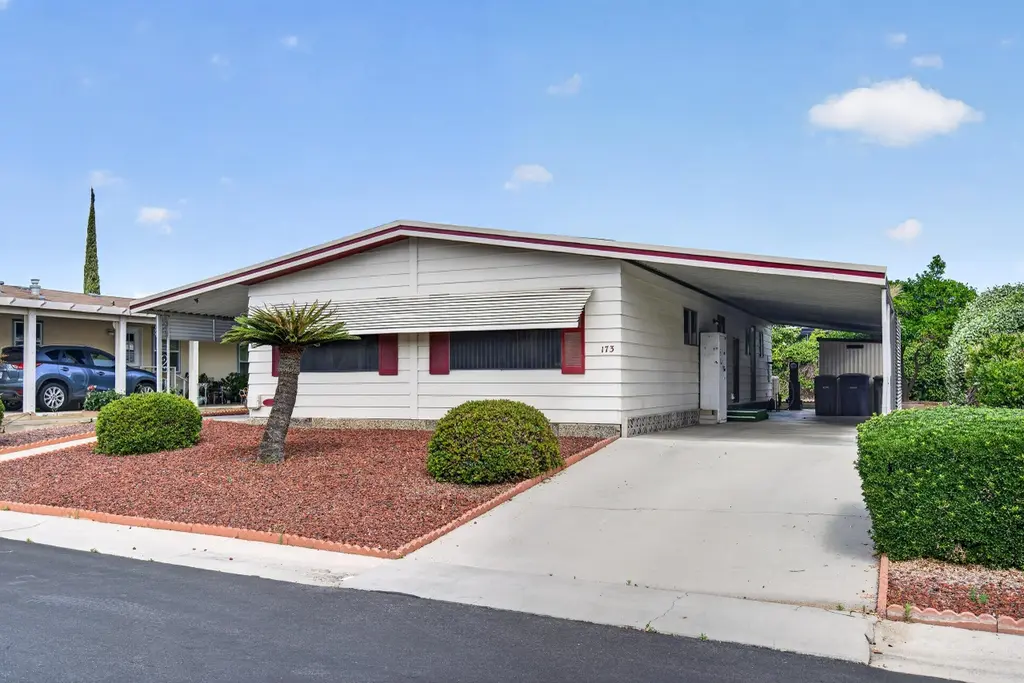
1300 W Olson Ave #173 · Reedley, CA
Flood risk 1/10 · Minimal
- FEMA flood zone
- X (unshaded)
- Chance of flooding over 30 yrs
- 0.0%
- Est. flood insurance / yr
- $507 – $1,088
Fire risk 8/10 · Major
- Est. fire insurance / yr
- $659 – $1,223
Heat risk 8/10 · Major
- Hot days now (above 106°F)
- 7 days/yr
- Hot days in 30 yrs
- 17 days/yr
Wind risk 1/10 · Minimal
- Chance of severe wind over 30 yrs
- —
Air-quality risk 10/10 · Severe
- Unhealthy air days now
- 48 days/yr
- Unhealthy air days in 30 yrs
- 53 days/yr
Risk factors via First Street. Map © Google.
Why this score? — see what drove the C+ grade
The composite is a weighted blend of 9 inputs, each scored 0–100. Each bar is that input's sub-score; the figure is the points it added to the 100-point composite (weight × sub-score).
- Cash flow +30.0/30.0
- 1% rule +10.0/10.0
- DSCR +10.0/10.0
- Livability +3.1/5.0
- Schools +2.9/10.0
- Rent growth +2.5/5.0
- Condition / age +2.5/5.0
- ARV discount +0.0/15.0
- Appreciation +0.0/10.0
$80,000
🖨 Deal sheet (PDF) 📄 Offer letter ✓ Due diligence
Listing remarks
Nice mobile home located in the Kings River Mobile Home Park. Exclusive 55+ Gated Community. 2 bedroom, 1.75 Bath mobile home, featuring a spacious living room and separate family room area. Kitchen opens up to dining area and also offers a breakfast bar, perfect for bar stools. This mobile home is suited in one of the biggest lots in the park. Huge yard offers lots of potential and it's perfect for planation of vegetables or a flower garden. Covered patio on north of the home, which provides shade all year long. Storage shed included. Home has been recently painted, both interior and exterior. This community offers a nice pool area, club house, and RV storage for boats and RV's. Walking di
Key facts
- Gated community
- Huge yard
- Pool area
Tags
Property features AI
Finance
- HOA & community: Homeowners association with monthly fee; Senior community; Gated community features
Exterior
- Parking: Carport; Guest parking
- Security: Security gate; Carbon monoxide detector; Smoke detectors
- Utilities: Public water; Public sewer; Electricity connected; Natural gas available and connected
- Home design: Manufactured home in a park (single wide); Single-story (mobile home 12' x 64')
- Construction: Composition roof; Aluminum skirting
- Exterior features: Porch; In-ground private pool; Asphalt road access; Gated community
Interior
- Bathrooms: 2 full bathrooms
- Heating & cooling: Central heating; Central air; Ceiling fans
- Interior features: Pantry
- Laundry & utility: Inside laundry
Neighborhood map
What this means for you Summary
Snapshot
- This is a 3-bed/1.0-bath manufactured listed at $80k.
Deal economics
- At list price, monthly cash flow is $1k ($13k/yr) — positive.
- The deal already cash-flows at list — no discount required.
- Meets the 1% rule at list price ($2k rent vs $80k).
- Recommended offer: $78k (3.0% below list) — sets the bar for market timing.
- Cap rate 22.5% vs local median 3.8% in Reedley — top-decile yield for the area; either an underpriced asset or a hidden risk that comps aren't pricing in. Stress-test before assuming the spread holds.
Location & tenants
- Location reads 62/100 on livability (#486 in CA) — a middle-class / working-renter tenant base. Strengths: housing A; Watch: schools C-, commute D+, crime D.
- Kings Canyon Joint Unified (town): math 26% / reading 43% proficiency, ranked #288 of 517 in CA (top 56%) — families likely to look elsewhere, expect single-tenant / working-renter base with shorter leases; 73% free/reduced lunch — lower-income household profile, screen leases tightly.
- Market conditions: 51 active listings in the ZIP; 4 comparable units currently listed for rent nearby; rentals leasing fast (median 3d on market — plan ~1-2 weeks tenant-placement turnaround); 2,426 units permitted in Fresno County in 2024 (296 in 5+ unit buildings).
Forward outlook
- Local home prices are declining (-3.0%/yr); year-one equity from $553 of loan paydown is wiped out by about $2k of value loss. Plan a longer hold.
- Fresno County population projected at +11% by 2050 — modest demand growth; plan on rents tracking national, not racing it.
- At projected returns (-3.0% appreciation + 3.0% rent growth), your $22k cash investment doubles in ~2 years — after that, you're playing with house money.
Negotiation context
- It's been on market 46 days — a 3% lower offer ($78k) is reasonable based on typical stale-listing flexibility.
- 7 sale attempts since 3y ago; this cycle's ask has dropped $5k (6%) from the opening price — seller is motivated, your offer sets the floor, not the list.
Risks & watch-outs
- Climate carrying-cost: severe wildfire risk; extreme-heat days projected 7→17/yr by 2055 (HVAC capex compounding) — expect insurance premiums to compound above CPI over the hold.
Questions for the listing agent
- It's been on market 46 days. Have you received any prior offers? Is the seller open to a 3% concession, seller financing, or rate buy-down credit?
- Is there a deadline driving the sale (1031 exchange, divorce, estate, relocation)? That informs how much negotiation room exists.
- Crime grade is D in this area — have there been break-ins, vandalism, or insurance claims at this property in the last 3 years? What carrier currently insures it and at what premium?
- What's the average days-on-market for RENTAL listings here right now (not sales)? A rising rental-DOM trend means longer vacancies and softer asking-rent achievability than the comps imply.
- What's the recent tenant-quality profile in this submarket — average credit score on applications, eviction rate, late-payment / NSF rate, and stable-employment percentage? A property-management company in the area should have these aggregated.
- How much new for-sale + rental construction is in the pipeline within 1–3 miles? Heavy new supply typically softens prices + rents 12–24 months out; constrained supply supports both.
Investment metrics
- 1% rule
- 2.58% ✓
- Cap rate
- 22.47%
- Cash-on-cash
- 57.77%
- DSCR
- 3.57
- GRM
- 3.2
CMA / ARV
- ARV (median comp)
- $66,000
- List price
- $80,000
- Delta
- 21.21%
- Verdict
- OVERPRICED
- Comps
- 11 within 1.0 mi
Show comp detail 3 sales within ~0.75 mi
| Address | Dist | Beds/Ba | Sqft | Sold | Price | $/sf | Match |
|---|---|---|---|---|---|---|---|
| 1300 W Olson Ave #131 | 0.00mi | 3/2.0 | 1,152 (0%) | 3mo | $60,000 | $52 | 93 |
| 1300 W Olson Ave #97 | 0.10mi | 2/2.0 (-1) | 1,152 (0%) | 4mo | $70,000 | $61 | 83 |
| 1300 W Olson Ave #113 | 0.10mi | 2/2.0 (-1) | 1,248 (+8%) | 17mo | $125,000 | $100 | 58 |
Match score weights: distance 35% · size 25% · config 20% · recency 20%. Top-matched comps best support the ARV.
Projected returns pro-forma
-3.0% appreciation · 3.0% rent growth · sell at horizon
- IRR
- 56.3%
- Equity multiple
- 3.49×
- Total profit
- $55,753
- Equity at exit
- $11,928
- IRR
- 61.3%
- Equity multiple
- 7.12×
- Total profit
- $137,118
- Equity at exit
- $6,917
Cash invested: $22,400 (down + closing). Projections, not guarantees.
Landlord ↔ Tenant lean methodology
- Overall (STATE)
- 18 Strongly Tenant-Friendly
- State California
- 18 Strongly Tenant-Friendly · D+13
- County
- — inherits STATE
- City
- — inherits STATE
ZIP-level market 93654
- Active inventory
- 51
- Price-to-rent
- 3.2×
Monthly cashflow live
- Estimated rent
- $2,065 medium interval (Pro) →
- Mortgage (P&I)
- −$420
- Tax est. 1.5%
- −$100 /mo · $1,200/yr
- Insurance
- −$33
- HOA
- −$0
- Vacancy / Maint / Mgmt
- −$434
- Net cashflow
- $1,078
Break-even live
Sensitivity live
| Price | -10% $1,134 | -5% $1,106 | +0% $1,078 | +5% $1,051 | +10% $1,023 |
|---|---|---|---|---|---|
| Rent | -10% $915 | -5% $997 | +0% $1,078 | +5% $1,160 | +10% $1,242 |
| Rate | -1.0pp $1,119 | -0.5pp $1,099 | base $1,078 | +0.5pp $1,058 | +1.0pp $1,037 |
UW: 25.0% down · 7.5% · 30yr · 1.5% tax · 5.0% vac · 8.0% maint · 8.0% mgmt
Financing live
Cash to close
- Down payment
- $20,000
- Closing costs
- $2,400
- Reserves months
- —
- Total cash needed
- —
Loan-product check · same deal, 3 products live
Conventional
25% down · 7.5% · 30yr
- Down + closing
- —
- Monthly P&I
- —
- Monthly cashflow
- —
- DSCR
- —
- Eligible?
- —
Personal DTI + credit; lowest rate.
DSCR
20% down · 8.5% · 30yr
- Down + closing
- —
- Monthly P&I
- —
- Monthly cashflow
- —
- DSCR
- —
- Eligible?
- —
No personal income docs; deal must DSCR.
Hard money
10% down · 12.0% · 12mo
- Down + closing
- —
- Monthly P&I
- —
- Monthly cashflow
- —
- DSCR
- —
- Eligible?
- —
Short-term bridge; refi at stabilization.
Rent comps 4 comps
| Address | Beds | Baths | Sqft | Rent | $/sqft | DOM | Units | Dist |
|---|---|---|---|---|---|---|---|---|
| 1275 W Kramer Ridge Rd Reedley, CA | 4.0 | 2.0 | 1410 | $2,350 | $1.67 | 2d | 1 | 0.20mi |
| 1260 S Klein Ave Reedley, CA | 3.0 | 1.5 | 1220 | $1,995 | $1.64 | 2d | 1 | 0.61mi |
| 2264 13th St Reedley, CA | 2.0 | 1.0 | 763 | $1,350 | $1.77 | 44d | 1 | 0.67mi |
| 1407 E St Reedley, CA | 2.0 | 1.0 | 912 | $1,550 | $1.70 | 2d | 1 | 1.26mi |
Listing history 19 events
-
2026-06-18days on market $80,000 Active 46 DOM
-
2026-06-17days on market $80,000 Active 45 DOM
-
2026-06-16days on market $80,000 Active 44 DOM
-
2026-06-16pricestatus $80,000 Active 43 DOM
-
2026-06-07statusdays on market $85,000 Pending 43 DOM
-
2026-06-03days on market $85,000 Active 41 DOM
-
2026-06-02days on market $85,000 Active 40 DOM
-
2026-06-01days on market $85,000 Active 39 DOM
-
2026-05-31days on market $85,000 Active 38 DOM
-
2026-04-23$85,000 Active 776-char remark
-
2023-11-02$72,000 Active
-
2023-11-01$72,000 Active
-
2023-09-23price $73,000
-
2023-09-19price $74,000
-
2023-09-18price $74,000
-
2023-08-22price $75,000
-
2023-08-16$75,000 Active
-
2023-08-16$79,900 Active
-
2023-07-21$80,000 Active
ⓘ Source: listings_history table (triggers on properties + properties_extension) + one-shot
backfill from property_details.listing_events for pre-trigger history.
Climate risk First Street
- Flood 1/10 Low FEMA zone X (unshaded) · 0% chance over 30 yrs
- Wildfire 8/10 Severe
- Heat 8/10 Severe 7 d/yr ≥106°F today · 17 d/yr by 30 yrs out
- Wind 1/10 Low
- Air quality 10/10 Extreme 48 unhealthy d/yr today · 53 by 30 yrs out
Nearby sold comps map
Loading sold comps map…
Walkable amenities ~0.75 mi
Loading nearby amenities…
Taxation est. · year 1
- Rental income
- $24,779
- − Mortgage interest
- −$4,481
- − Property taxes
- −$1,200
- − Insurance
- −$400
- − Repairs & maintenance
- −$1,982
- − Management
- −$1,982
- − Depreciation
- −$2,327
- Taxable income
- $12,406
- Est. tax owed @ 24.0%
- −$2,977
- After-tax cash flow
- $9,964/yr
For passive investors: Depreciation is non-cash, so a rental often shows a tax loss while cash-flowing — sheltering income. Rental losses are passive: they offset passive income freely, and up to $25,000/yr can offset ordinary (W-2) income if you actively participate and your MAGI is under $100k (phasing out to $0 by $150k); unused losses carry forward. On sale, claimed depreciation is recaptured at up to 25%, and gains may owe capital-gains tax (a 1031 exchange can defer both). Figures are a year-1 estimate at your 24.0% rate — not tax advice; consult a CPA.
Schools (NCES district)
- District
- Kings Canyon Joint Unified
- NCES district ID
- 0619700
- Math proficiency
- 26% ▼ -14.00%
- Reading proficiency
- 43% ▼ -9.00%
- Median HH income
- $42,406
- Composite
- 29.14/100
- National rank
- #6582
- State rank
- #288 of 517 in CA
Livability — Reedley
- Score
- 62/100
- State rank
- #486
- US rank
- #16474
Category grades
Schools grade is shown separately in the Schools card above.
Census & demographics
- Census place
- Reedley, CA
- Population (ZIP)
- 31,905
Population outlook (Fresno County) Hauer SSP2
- Today (2025)
- 1,042,971 people
- By 2030
- 1,072,198 · +2.8%
- By 2040
- 1,122,408 · +7.6%
- By 2050
- 1,157,251 · +11.0%
- By 2075
- 1,182,575 · +13.4%
- By 2100
- 1,105,899 · +6.0%
Race, ethnicity, and origin ACS 2023
- Neighborhood character
- Predominantly Hispanic (75%)
- Race & ethnicity
- Hispanic / Latino 75% White 19% Two or more races 18% Asian 2% Black 2%
- Hispanic origin (detail)
- Mexican 72%
- Common ancestry
- Iranian 1% Russian 1% Portuguese 1%
- Foreign-born
- 27% · Canada, China
- Languages at home
- 42% English-only · Spanish 55% Arabic 2% Tagalog/Filipino 1%
Political lean MEDSL · Fresno
- 2024 margin
- Toss-up / Even · D 46.5% · R 50.9% · Other 2.6%
- 2008→2024 swing
- -6.5pp toward R · 2008: 2.1pp · 2024: -4.4pp
- All cycles
- 2024: R+4.4 2020: D+7.8 2016: D+3.9 2012: R+2.9 2008: D+2.1
Not yet ingested
- Civics
- —
Market trends
- HPI YoY
- ▼ -343.56%
- Current HPI
- 322.9544
- Rent YoY
- —
- Metro
- —
- State GDP YoY
- ▲ 3.21%
- F500 in state
- 116
Industry mix (Fortune 500 HQ in CA)
| Industry | F500 HQs | Revenue |
|---|---|---|
| Technology | 27 | $1,492B |
|
||
| Financial Services | 3 | $174B |
|
||
| Retail | 3 | $44B |
|
||
| Insurance | 3 | $26B |
|
||
| Media / Entertainment | 2 | $115B |
|
||
| Pharmaceuticals / Biotech | 2 | $62B |
|
||
Price history
+0.0% since first listed13 events — show timeline
- 2026-06-16 Relisted — TCMLS
- 2026-06-16 Price Changed $80,000 TCMLS
- 2026-06-05 Pending — TCMLS
- 2026-04-23 Listed $85,000 TCMLS
- 2023-11-02 Listed $72,000 TCMLS
- 2023-11-01 Listed $72,000 FRESNOMLS
- 2023-09-23 Price Changed $73,000 FRESNOMLS
- 2023-09-19 Price Changed $74,000 TCMLS
- 2023-09-18 Price Changed $74,000 FRESNOMLS
- 2023-08-22 Price Changed $75,000 TCMLS
- 2023-08-16 Listed $79,900 TCMLS
- 2023-08-16 Listed $75,000 FRESNOMLS
- 2023-07-21 Listed $80,000 FRESNOMLS
Cash-flow waterfall
monthlySold comps — $/sqft
last 12 mo · ≤1 miLoading sold comps…