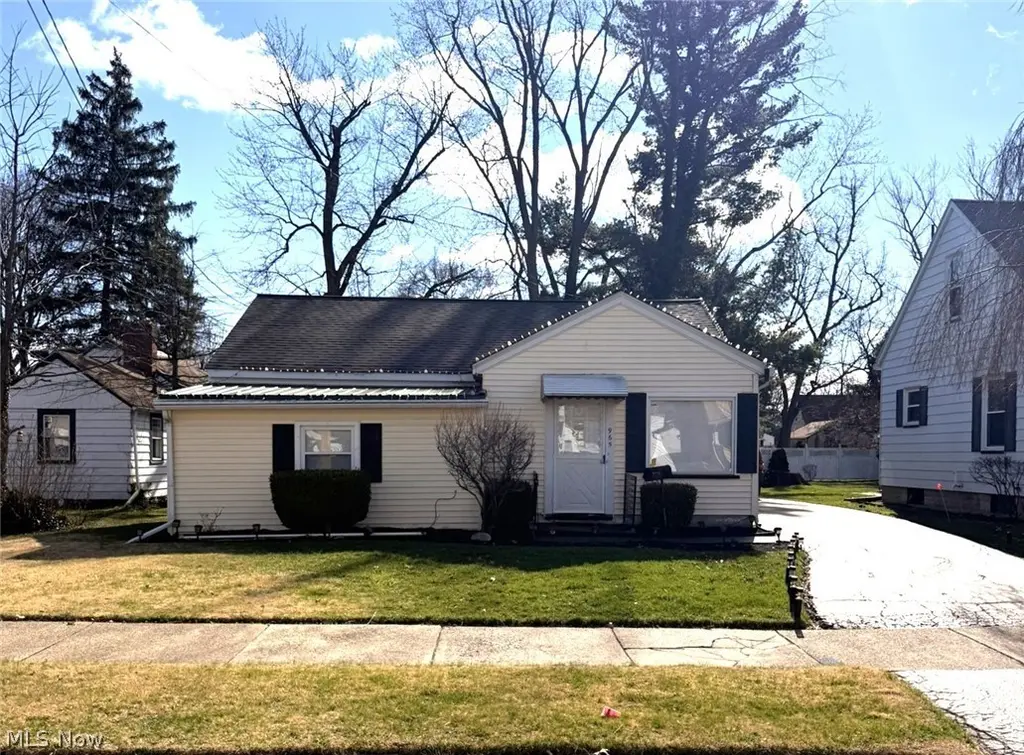
965 Adelaide Ave SE · Warren, OH
Flood risk 4/10 · Minor
- FEMA flood zone
- X (unshaded)
- Chance of flooding over 30 yrs
- 0.22%
- Est. flood insurance / yr
- $507 – $1,088
Fire risk 1/10 · Minimal
- Est. fire insurance / yr
- $713 – $1,323
Heat risk 3/10 · Minor
- Hot days now (above 98°F)
- 7 days/yr
- Hot days in 30 yrs
- 16 days/yr
Wind risk 1/10 · Minimal
- Chance of severe wind over 30 yrs
- —
Air-quality risk 3/10 · Minor
- Unhealthy air days now
- 1 days/yr
- Unhealthy air days in 30 yrs
- 4 days/yr
Risk factors via First Street. Map © Google.
Why this score? — see what drove the C grade
The composite is a weighted blend of 9 inputs, each scored 0–100. Each bar is that input's sub-score; the figure is the points it added to the 100-point composite (weight × sub-score).
- Cash flow +24.5/30.0
- DSCR +7.9/10.0
- 1% rule +6.1/10.0
- ARV discount +5.9/15.0
- Livability +3.7/5.0
- Rent growth +2.5/5.0
- Condition / age +2.5/5.0
- Schools +2.2/10.0
- Appreciation +0.0/10.0
$89,900
🖨 Deal sheet 📄 Offer letter ✓ Due diligence
Listing remarks MLS
Welcome to this 3-bedroom, 1-bathroom ranch in Warren, Ohio offering 1,299 sq ft of comfortable, single-level living. The home features updated electrical, along with a detached garage and two storage sheds providing plenty of space for storage and everyday needs. With a functional layout and room to make it your own, this property is a great opportunity.
Key facts
- Updated electrical
- Two storage sheds
- Detached garage
Tags
Neighborhood map
What this means for you Summary
Snapshot
- This is a 3-bed/1.0-bath single-family listed at $90k.
Deal economics
- At list price, monthly cash flow is $184 ($2k/yr) — positive.
- The deal already cash-flows at list — no discount required.
- Meets the 1% rule at list price ($995 rent vs $90k).
- Recommended offer: $82k (9.0% below list) — sets the bar for market timing.
- Cap rate 8.7% vs local median 6.0% in Warren — top-decile yield for the area; either an underpriced asset or a hidden risk that comps aren't pricing in. Stress-test before assuming the spread holds.
Location & tenants
- Location reads 73/100 on livability (#312 in OH) — a middle-class / working-renter tenant base. Strengths: cost of living A+, health & safety A+, housing A; Watch: crime D-, commute F, employment F.
- Warren City (urban): math 22% / reading 32% proficiency, ranked #599 of 656 in OH (top 91%) — low school quality limits family demand, transient renter base, plan for 1-2y turnover; 75% free/reduced lunch — lower-income household profile, screen leases tightly.
- Market conditions: 87 active listings in the ZIP; 6 comparable units currently listed for rent nearby; rentals leasing fast (median 13d on market — plan ~1-2 weeks tenant-placement turnaround); 129 units permitted in Trumbull County in 2024 (0 in 5+ unit buildings).
Forward outlook
- Local home prices are declining (-3.0%/yr); year-one equity from $622 of loan paydown is wiped out by about $3k of value loss. Plan a longer hold.
- Trumbull County population projected at -22% by 2050 — secular population decline; favor cash flow + early exit over multi-decade hold.
Negotiation context
- It's been on market 94 days — a 9% lower offer ($82k) is reasonable based on typical stale-listing flexibility.
- 2 sale attempts since 10y ago; this cycle's ask has dropped $15k (14%) from the opening price — seller is motivated, your offer sets the floor, not the list.
- Current owner paid $22k; list at $90k implies a 300% gain — meaningful room to come down on a strong offer.
Risks & watch-outs
- Watch-outs: built in 1950 — expect roof / HVAC / electrical / plumbing capex.
Questions for the listing agent
- It's been on market 94 days. Have you received any prior offers? Is the seller open to a 9% concession, seller financing, or rate buy-down credit?
- Built in 1950 — when were the roof, HVAC, electrical panel, plumbing, and water heater last replaced?
- Why hasn't it sold? Are there any deal-killer items the seller is aware of (foundation, flood, title, zoning, code violations)?
- Is there a deadline driving the sale (1031 exchange, divorce, estate, relocation)? That informs how much negotiation room exists.
- Crime grade is D in this area — have there been break-ins, vandalism, or insurance claims at this property in the last 3 years? What carrier currently insures it and at what premium?
- What's the average days-on-market for RENTAL listings here right now (not sales)? A rising rental-DOM trend means longer vacancies and softer asking-rent achievability than the comps imply.
- What's the recent tenant-quality profile in this submarket — average credit score on applications, eviction rate, late-payment / NSF rate, and stable-employment percentage? A property-management company in the area should have these aggregated.
- How much new for-sale + rental construction is in the pipeline within 1–3 miles? Heavy new supply typically softens prices + rents 12–24 months out; constrained supply supports both.
Investment metrics
- 1% rule
- 1.11% ✓
- Cap rate
- 8.75%
- Cash-on-cash
- 8.76%
- DSCR
- 1.39
- GRM
- 7.5
CMA / ARV
- ARV (median comp)
- $86,858
- List price
- $89,900
- Delta
- 3.50%
- Verdict
- FAIR
- Comps
- 20 within 1.0 mi
Show comp detail 12 sales within ~0.75 mi
| Address | Dist | Beds/Ba | Sqft | Sold | Price | $/sf | Match |
|---|---|---|---|---|---|---|---|
| 1116 Adelaide Ave SE | 0.06mi | 4/1.0 (+1) | 1,254 (-4%) | 0mo | $106,250 | $85 | 86 |
| 1100 Woodbine Ave SE | 0.29mi | 3/1.0 | 1,178 (-9%) | 5mo | $42,500 | $36 | 67 |
| 327 Adelaide | 0.34mi | 3/1.0 | 1,144 (-12%) | 6mo | $127,900 | $112 | 59 |
| 464 Meadowbrook Ave SE | 0.67mi | 3/1.0 | 1,235 (-5%) | 4mo | $143,000 | $116 | 57 |
| 336 Willard Ave SE | 0.43mi | 3/1.5 | 1,136 (-12%) | 2mo | $130,000 | $114 | 55 |
| 1153 Meadowbrook Ave SE | 0.71mi | 4/1.0 (+1) | 1,248 (-4%) | 1mo | $165,000 | $132 | 54 |
| 880 Meadowbrook Ave SE | 0.65mi | 3/2.5 | 1,392 (+7%) | 2mo | $154,500 | $111 | 50 |
| 1087 Perkinswood Blvd SE | 0.45mi | 3/2.0 | 1,488 (+14%) | 1mo | $150,000 | $101 | 50 |
| 156 Bonnie Brae Ave NE | 0.66mi | 3/1.0 | 1,440 (+11%) | 3mo | $145,500 | $101 | 48 |
| 696 Meadowbrook Ave SE | 0.65mi | 3/1.5 | 1,140 (-12%) | 2mo | $150,000 | $132 | 46 |
| 1178 Meadowbrook Ave SE | 0.69mi | 2/1.0 (-1) | 1,184 (-9%) | 3mo | $95,000 | $80 | 46 |
| 213 Kenmore Ave NE | 0.66mi | 3/1.0 | 1,142 (-12%) | 6mo | $116,000 | $102 | 44 |
Match score weights: distance 35% · size 25% · config 20% · recency 20%. Top-matched comps best support the ARV.
Projected returns pro-forma
-3.0% appreciation · 3.0% rent growth · sell at horizon
- IRR
- -3.0%
- Equity multiple
- 0.89×
- Total profit
- $-2,856
- Equity at exit
- $13,404
- IRR
- 6.7%
- Equity multiple
- 1.50×
- Total profit
- $12,603
- Equity at exit
- $7,773
Cash invested: $25,172 (down + closing). Projections, not guarantees.
Landlord ↔ Tenant lean methodology
- Overall (STATE)
- 73 Landlord-Friendly
- State Ohio
- 73 Landlord-Friendly · R+6
- County
- — inherits STATE
- City
- — inherits STATE
ZIP-level market 44484
- Home prices YoY
- -17.5%
- Active inventory
- 87
- Price-to-rent
- 7.5×
Monthly cashflow live
- Estimated rent
- $995 high interval (Pro) →
- Mortgage (P&I)
- −$471
- Tax from tax record
- −$94 /mo · $1,124/yr
- Insurance
- −$37
- HOA
- −$0
- Vacancy / Maint / Mgmt
- −$209
- Net cashflow
- $184
Break-even live
UW: 25.0% down · 7.5% · 30yr · 1.5% tax · 5.0% vac · 8.0% maint · 8.0% mgmt
Financing live
Cash to close
- Down payment
- $22,475
- Closing costs
- $2,697
- Reserves months
- —
- Total cash needed
- —
Loan-product check · same deal, 3 products live
Conventional
25% down · 7.5% · 30yr
- Down + closing
- —
- Monthly P&I
- —
- Monthly cashflow
- —
- DSCR
- —
- Eligible?
- —
Personal DTI + credit; lowest rate.
DSCR
20% down · 8.5% · 30yr
- Down + closing
- —
- Monthly P&I
- —
- Monthly cashflow
- —
- DSCR
- —
- Eligible?
- —
No personal income docs; deal must DSCR.
Hard money
10% down · 12.0% · 12mo
- Down + closing
- —
- Monthly P&I
- —
- Monthly cashflow
- —
- DSCR
- —
- Eligible?
- —
Short-term bridge; refi at stabilization.
Rent comps 6 comps
| Address | Beds | Baths | Sqft | Rent | $/sqft | DOM | Units | Dist |
|---|---|---|---|---|---|---|---|---|
| 840 Woodbine Ave SE Unit 838 Warren, OH | 2.0 | 1.0 | 1009 | $1,000 | $0.99 | 13d | 1 | 0.23mi |
| 1151 Kenilworth Ave SE Warren, OH | 2.0 | 1.0 | 1207 | $900 | $0.75 | 13d | 1 | 0.36mi |
| 341 Charles AVE Warren, OH | 3.0 | 1.0 | 1232 | $1,100 | $0.89 | 43d | 1 | 0.69mi |
| 259 Perkinswood Blvd NE Warren, OH | 1.0–2.0 | 1.0 | 743 | $845 | $1.14 | 13d | 3 | 0.76mi |
| 1216 Hollywood St NE Warren, OH | 3.0 | 1.0 | 1158 | $1,050 | $0.91 | 21d | 1 | 1.35mi |
| 407 Washington St NE Niles, OH | 3.0 | 1.5 | 1388 | $1,250 | $0.90 | 13d | 1 | 1.45mi |
Listing history 22 events
-
2026-06-19days on market $89,900 Active 94 DOM
-
2026-06-18days on market $89,900 Active 93 DOM
-
2026-06-17days on market $89,900 Active 92 DOM
-
2026-06-16days on market $89,900 Active 91 DOM
-
2026-06-15days on market $89,900 Active 90 DOM
-
2026-06-14days on market $89,900 Active 88 DOM
-
2026-06-13days on market $89,900 Active 87 DOM
-
2026-06-10days on market $89,900 Active 85 DOM
-
2026-06-09days on market $89,900 Active 84 DOM
-
2026-06-08days on market $89,900 Active 83 DOM
-
2026-06-07days on market $89,900 Active 82 DOM
-
2026-06-05days on market $89,900 Active 79 DOM
-
2026-06-02days on market $89,900 Active 77 DOM
-
2026-06-01days on market $89,900 Active 76 DOM
-
2026-05-31days on market $89,900 Active 75 DOM
-
2026-05-30days on market $89,900 Active 74 DOM
-
2026-05-18price $89,900 357-char remark
Show marketing remark (357 chars)
Welcome to this 3-bedroom, 1-bathroom ranch in Warren, Ohio offering 1,299 sq ft of comfortable, single-level living. The home features updated electrical, along with a detached garage and two storage sheds providing plenty of space for storage and everyday needs. With a functional layout and room to make it your own, this property is a great opportunity.
-
2026-04-07price $97,000 357-char remark
Show marketing remark (357 chars)
Welcome to this 3-bedroom, 1-bathroom ranch in Warren, Ohio offering 1,299 sq ft of comfortable, single-level living. The home features updated electrical, along with a detached garage and two storage sheds providing plenty of space for storage and everyday needs. With a functional layout and room to make it your own, this property is a great opportunity.
-
2026-03-16$104,900 Active 357-char remark
Show marketing remark (357 chars)
Welcome to this 3-bedroom, 1-bathroom ranch in Warren, Ohio offering 1,299 sq ft of comfortable, single-level living. The home features updated electrical, along with a detached garage and two storage sheds providing plenty of space for storage and everyday needs. With a functional layout and room to make it your own, this property is a great opportunity.
-
2016-12-13soldstatus $22,500 Sold 248-char remark
Show marketing remark (248 chars)
Well maintained 3 bedroom ranch. Tons of storage. Large family room addition. 1st floor laundry. Eat-in kitchen. Nice covered back porch. 1.5 car garage 14x20 plus 3 nice size sheds! Newer replacement windows. HWT 2015. 2-10 home warranty included.
-
2016-11-30status Pending 248-char remark
Show marketing remark (248 chars)
Well maintained 3 bedroom ranch. Tons of storage. Large family room addition. 1st floor laundry. Eat-in kitchen. Nice covered back porch. 1.5 car garage 14x20 plus 3 nice size sheds! Newer replacement windows. HWT 2015. 2-10 home warranty included.
-
2016-11-10$29,900 Active 248-char remark
Show marketing remark (248 chars)
Well maintained 3 bedroom ranch. Tons of storage. Large family room addition. 1st floor laundry. Eat-in kitchen. Nice covered back porch. 1.5 car garage 14x20 plus 3 nice size sheds! Newer replacement windows. HWT 2015. 2-10 home warranty included.
ⓘ Source: listings_history table (triggers on properties + properties_extension) + one-shot
backfill from property_details.listing_events for pre-trigger history.
Tax reassessment forecast OH · Partial reset (capped growth)
- Current annual tax
- $1,124 · $94/mo
- Projected year-2 tax
- $1,263 · $105/mo
- Expected delta
- +$139/yr (+$12/mo · 12.4%)
ⓘ Screening estimate from a state-policy table — verify with the county assessor before closing.
Climate risk First Street
- Flood 4/10 Moderate FEMA zone X (unshaded) · 22% chance over 30 yrs
- Wildfire 1/10 Low
- Heat 3/10 Moderate 7 d/yr ≥98°F today · 16 d/yr by 30 yrs out
- Wind 1/10 Low
- Air quality 3/10 Moderate 1 unhealthy d/yr today · 4 by 30 yrs out
Nearby sold comps map
Loading sold comps map…
Walkable amenities ~0.75 mi
Loading nearby amenities…
Taxation est. · year 1
- Rental income
- $11,945
- − Mortgage interest
- −$5,036
- − Property taxes
- −$1,124
- − Insurance
- −$450
- − Repairs & maintenance
- −$956
- − Management
- −$956
- − Depreciation
- −$2,615
- Taxable income
- $809
- Est. tax owed @ 24.0%
- −$194
- After-tax cash flow
- $2,012/yr
For passive investors: Depreciation is non-cash, so a rental often shows a tax loss while cash-flowing — sheltering income. Rental losses are passive: they offset passive income freely, and up to $25,000/yr can offset ordinary (W-2) income if you actively participate and your MAGI is under $100k (phasing out to $0 by $150k); unused losses carry forward. On sale, claimed depreciation is recaptured at up to 25%, and gains may owe capital-gains tax (a 1031 exchange can defer both). Figures are a year-1 estimate at your 24.0% rate — not tax advice; consult a CPA.
Schools (NCES district)
- District
- Warren City
- NCES district ID
- 3904499
- Math proficiency
- 22% ▼ -16.00%
- Reading proficiency
- 32% ▼ -9.00%
- Median HH income
- $28,222
- Composite
- 21.6/100
- National rank
- #8299
- State rank
- #599 of 656 in OH
Livability — Warren
- Score
- 73/100
- State rank
- #312
- US rank
- #5068
Category grades
Schools grade is shown separately in the Schools card above.
Census & demographics
- Census place
- Warren, OH
- County
- Trumbull · 193,293 people
- City population
- 25,805
- Metro
- Youngstown-Warren, OH
- Population (ZIP)
- 21,634
- Household income
- $65,435
- Rent vs Own
- Severe rent burden
- 6.7
Population outlook (Trumbull County) Hauer SSP2
- Today (2025)
- 191,696 people
- By 2030
- 184,015 · -4.0%
- By 2040
- 166,810 · -13.0%
- By 2050
- 149,857 · -21.8%
- By 2075
- 115,769 · -39.6%
- By 2100
- 83,617 · -56.4%
Race, ethnicity, and origin ACS 2023
- Neighborhood character
- Predominantly White (84%)
- Race & ethnicity
- White 84% Black 8% Two or more races 5% Hispanic / Latino 3% Asian 2%
- Common ancestry
- Romanian 3% Lithuanian 2% Serbian 1%
- Foreign-born
- 3% · China, Canada
- Languages at home
- 96% English-only · Other Indo-European 2% Other Asian/Pacific 1% Spanish 1%
Political lean MEDSL · Trumbull
- 2024 margin
- R (+16.8) · D 41.2% · R 58.0%
- 2008→2024 swing
- -39.2pp toward R · 2008: 22.4pp · 2024: -16.8pp
- All cycles
- 2024: R+16.8 2020: R+10.6 2016: R+6.4 2012: D+22.2 2008: D+22.4
Not yet ingested
- Civics
- —
Market trends
- HPI YoY
- ▼ -46.24%
- Current HPI
- 217.6603
- Rent YoY
- —
- Metro
- —
- State GDP YoY
- ▲ 1.98%
- F500 in state
- 48
Industry mix (Fortune 500 HQ in OH)
| Industry | F500 HQs | Revenue |
|---|---|---|
| Insurance | 3 | $145B |
|
||
| Industrial Machinery | 3 | $49B |
|
||
| Financial Services | 3 | $24B |
|
||
| Consumer Goods | 2 | $93B |
|
||
| Aerospace / Defense | 2 | $47B |
|
||
| Utilities | 2 | $33B |
|
||
Price history
+200.7% since first listed6 events — show timeline
- 2026-05-18 Price Changed $89,900 MLSNOW
- 2026-04-07 Price Changed $97,000 MLSNOW
- 2026-03-16 Listed $104,900 MLSNOW
- 2016-12-13 Sold (MLS) $22,500 MLSNOW
- 2016-11-30 Pending — MLSNOW
- 2016-11-10 Listed $29,900 MLSNOW
Property tax history
+9.0%/yrLatest (2025): $1,124 · +1.9% YoY. Source: county tax records.
Cash-flow waterfall
monthlySold comps — $/sqft
last 12 mo · ≤1 miLoading sold comps…