 Triplex
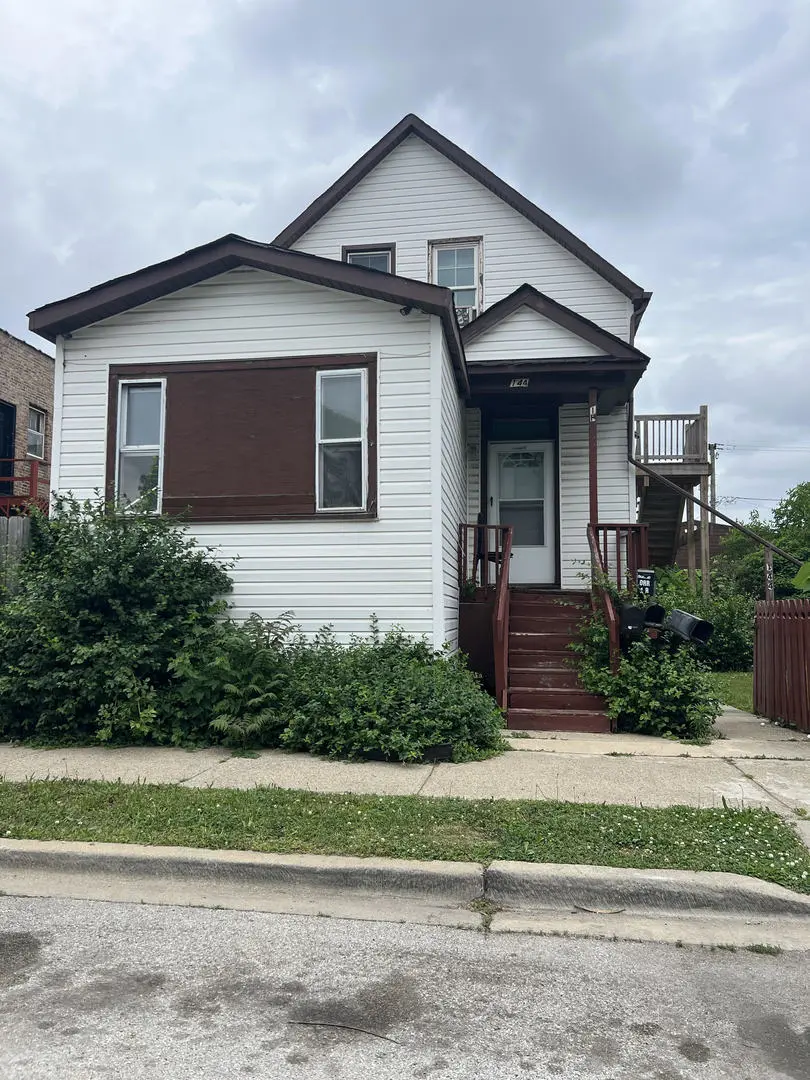
144 154th Pl · Calumet City, IL
Flood risk 1/10 · Minimal
- FEMA flood zone
- X (unshaded)
- Chance of flooding over 30 yrs
- 0.0%
- Est. flood insurance / yr
- $507 – $1,088
Fire risk 1/10 · Minimal
- Est. fire insurance / yr
- $804 – $1,492
Heat risk 3/10 · Minor
- Hot days now (above 102°F)
- 7 days/yr
- Hot days in 30 yrs
- 15 days/yr
Wind risk 2/10 · Minimal
- Chance of severe wind over 30 yrs
- 0.0%
Air-quality risk 4/10 · Minor
- Unhealthy air days now
- 5 days/yr
- Unhealthy air days in 30 yrs
- 6 days/yr
Risk factors via First Street. Map © Google.
Why this score? — see what drove the B- grade
The composite is a weighted blend of 9 inputs, each scored 0–100. Each bar is that input's sub-score; the figure is the points it added to the 100-point composite (weight × sub-score).
- Cash flow +30.0/30.0
- DSCR +10.0/10.0
- 1% rule +9.2/10.0
- ARV discount +7.5/15.0
- Rent growth +4.0/5.0
- Livability +3.6/5.0
- Condition / age +2.5/5.0
- Schools +1.0/10.0
- Appreciation +0.0/10.0
$285,000
🖨 Deal sheet 📄 Offer letter ✓ Due diligence
Multi-family units
County records classify this as Multi-Family (2-4 Unit). Listing-text estimate: 3 units. confirmed
Listing remarks MLS
3-unit being sold as-is, with additional lot included in price. Situated on a cul-de-sac with very light traffic. 2 units with 2 bedrooms and 1 with 1 bedroom. 2 car detached garage, with tools and maintenance supplies in basement and garage (all stay, including snow blower, lawn mower, ladder, et.al.) 3 newer furnaces, 3 hot water heaters. Great investment property. Tenants each pay for their own electric and heat. Property to be sold in AS IS condition, no exceptions, including if any, all City of Calumet City requirements.
Key facts
- Multiple furnaces
- Fenced in yard
- Detached garage
Tags
Property features AI
Finance
- Financial info: Three-unit building; Unit 1 (first floor): 4 rooms, 2 bedrooms, 1 full bath — rent listed as $16,500 with $1,650 security deposit; tenant pays electric, gas, and heat; lease through June 1, 2026; Unit 2 (first floor): 3 rooms, 1 bedroom, 1 full bath — rent $1,250 with $1,250 security deposit; tenant pays electric, gas, and heat; lease through November 1, 2026; Unit 3 (second floor): 4 rooms, 2 bedrooms, 1 full bath — rent $1,475 with $1,475 security deposit; tenant pays electric, gas, and heat; lease through February 1, 2027; Special service area: No
- HOA & community: Neighborhood features include sidewalks, street lights, and paved streets
Exterior
- Utilities: Public water; Public sewer
- Home design: Two-to-four unit multi-family property; Fee simple ownership; Rehab completed in 2025; Building is over 100 years old; Vinyl siding construction
- Construction: Vinyl siding; Building age: 100+ years; Rehabilitated in 2025; Built before 1978
- Exterior features: Front porch; Fenced lot; Property sits on a cul-de-sac; Lot dimensions approximately 50 x 125
Interior
- Kitchen: Stove and refrigerator included in each unit
- Bedrooms: 5 bedrooms total; Each unit contains bedrooms (units list: two 2-bed units and one 1-bed unit)
- Bathrooms: 3 full bathrooms total; Each unit includes one full bathroom
- Heating & cooling: Natural gas heating
- Interior features: 11 total rooms; Unfinished full basement
Neighborhood map
What this means for you Summary
Snapshot
- This is a 2×2bd/1.0ba + 1×1bd/1.0ba units multifamily listed at $285k.
Deal economics
- At list price, monthly cash flow is $1k ($14k/yr) — positive. Per door: $377/mo.
- The deal already cash-flows at list — no discount required.
- Meets the 1% rule at list price ($4k rent vs $285k).
- Cap rate 11.1% vs local median 8.2% in Calumet City — top-decile yield for the area; either an underpriced asset or a hidden risk that comps aren't pricing in. Stress-test before assuming the spread holds.
Location & tenants
- Location reads 71/100 on livability (#330 in IL) — a middle-class / working-renter tenant base. Strengths: commute A+, cost of living A+, housing A+; Watch: employment C-, schools F, crime D-.
- Thornton Fractional Twp Hsd 215 (suburban): math 9% / reading 13% proficiency, ranked #563 of 620 in IL (top 91%) — low school quality limits family demand, transient renter base, plan for 1-2y turnover.
- Market conditions: Rents rising fast (+6.2%/yr); 198 active listings in the ZIP; 6,272 units permitted in Cook County in 2024 (4,658 in 5+ unit buildings).
- At $4,058/mo this rent would consume 88% of the median local household income ($55k/yr) (locally 2415% of renters already pay >50% of income on rent) — very limited rent-growth headroom before tenants either downsize or default.
Forward outlook
- Local home prices are declining (-3.0%/yr); year-one equity from $2k of loan paydown is wiped out by about $9k of value loss. Plan a longer hold.
- At projected returns (-3.0% appreciation + 6.2% rent growth), your $80k cash investment doubles in ~6 years — after that, you're playing with house money.
Negotiation context
- Only 10 days on market — expect competitive offers; lowballing is unlikely to land.
- 6 sale attempts since 5y ago with the ask held roughly flat each time — persistent listings suggest the price (not the market) is what's stuck; bring a comps-based counter.
- Current owner paid $90k; list at $285k implies a 217% gain — meaningful room to come down on a strong offer.
Risks & watch-outs
- Watch-outs: built in 1895 — expect roof / HVAC / electrical / plumbing capex.
Questions for the listing agent
- Can we see the unit-by-unit rent roll, current vacancy, and any below-market leases? What's the average tenancy length?
- What capital expenditures (roof, boiler, parking lot, exteriors) have been made in the last 5 years, and what's planned in the next 2?
- Built in 1895 — when were the roof, HVAC, electrical panel, plumbing, and water heater last replaced?
- Is there a deadline driving the sale (1031 exchange, divorce, estate, relocation)? That informs how much negotiation room exists.
- Schools are F-rated, which usually means shorter tenancies and higher turnover. Who's the typical renter profile here, and what's been the actual vacancy rate?
- Crime grade is D in this area — have there been break-ins, vandalism, or insurance claims at this property in the last 3 years? What carrier currently insures it and at what premium?
- What's the average days-on-market for RENTAL listings here right now (not sales)? A rising rental-DOM trend means longer vacancies and softer asking-rent achievability than the comps imply.
- What's the recent tenant-quality profile in this submarket — average credit score on applications, eviction rate, late-payment / NSF rate, and stable-employment percentage? A property-management company in the area should have these aggregated.
- How much new apartment / multifamily construction is in the pipeline within 1–3 miles? Heavy new supply (>2% of stock underway) typically softens rents 12–24 months out; light construction supports rent growth.
Investment metrics
- 1% rule
- 1.42% ✓
- Cap rate
- 11.06%
- Cash-on-cash
- 17.02%
- DSCR
- 1.76
- GRM
- 5.9
CMA / ARV
No comps found within radius.
Projected returns pro-forma
-3.0% appreciation · 6.17% rent growth · sell at horizon
- IRR
- 12.0%
- Equity multiple
- 1.49×
- Total profit
- $39,370
- Equity at exit
- $42,494
- IRR
- 23.4%
- Equity multiple
- 3.33×
- Total profit
- $186,085
- Equity at exit
- $24,642
Cash invested: $79,800 (down + closing). Projections, not guarantees.
Landlord ↔ Tenant lean methodology
- Overall (STATE)
- 43 Moderately Tenant-Leaning
- State Illinois
- 43 Moderately Tenant-Leaning · D+7
- County
- — inherits STATE
- City
- — inherits STATE
ZIP-level market 60409
- Home prices YoY
- -27.6%
- Rents YoY
- 6.2%
- Active inventory
- 198
- Price-to-rent
- 17.2×
Monthly cashflow live
- Estimated rent
- $4,058 high interval (Pro) →
- Mortgage (P&I)
- −$1,495
- Tax from tax record
- −$461 /mo · $5,531/yr
- Insurance
- −$119
- HOA
- −$0
- Vacancy / Maint / Mgmt
- −$852
- Net cashflow
- $1,132
Break-even live
3-unit breakdown (identical units grouped — click to expand)
| Units | Beds | Baths | Est. rent |
|---|---|---|---|
| 2× units | 2 | 1 | $2,766 |
| #1 | 2 | 1 | $1,383 |
| #2 | 2 | 1 | $1,383 |
| 1× unit | 1 | 1 | $1,292 |
| Total (3 units) | $4,058 | ||
UW: 25.0% down · 7.5% · 30yr · 1.5% tax · 5.0% vac · 8.0% maint · 8.0% mgmt
Financing live
Cash to close
- Down payment
- $71,250
- Closing costs
- $8,550
- Reserves months
- —
- Total cash needed
- —
Loan-product check · same deal, 3 products live
Conventional
25% down · 7.5% · 30yr
- Down + closing
- —
- Monthly P&I
- —
- Monthly cashflow
- —
- DSCR
- —
- Eligible?
- —
Personal DTI + credit; lowest rate.
DSCR
20% down · 8.5% · 30yr
- Down + closing
- —
- Monthly P&I
- —
- Monthly cashflow
- —
- DSCR
- —
- Eligible?
- —
No personal income docs; deal must DSCR.
Hard money
10% down · 12.0% · 12mo
- Down + closing
- —
- Monthly P&I
- —
- Monthly cashflow
- —
- DSCR
- —
- Eligible?
- —
Short-term bridge; refi at stabilization.
Listing history 7 events
-
2026-06-18days on market $285,000 Active 10 DOM
-
2026-06-17days on market $285,000 Active 9 DOM
-
2026-06-16days on market $285,000 Active 8 DOM
-
2026-06-15days on market $285,000 Active 7 DOM
-
2026-06-13days on market $285,000 Active 5 DOM
-
2026-06-08remarks 235-char remark
-
2026-06-08$285,000 Active 1 DOM
ⓘ Source: listings_history table (triggers on properties + properties_extension) + one-shot
backfill from property_details.listing_events for pre-trigger history.
Tax reassessment forecast IL · Partial reset (capped growth)
- Current annual tax
- $5,531 · $461/mo
- Projected year-2 tax
- $6,000 · $500/mo
- Expected delta
- +$469/yr (+$39/mo · 8.5%)
ⓘ Screening estimate from a state-policy table — verify with the county assessor before closing.
Climate risk First Street
- Flood 1/10 Low FEMA zone X (unshaded) · 0% chance over 30 yrs
- Wildfire 1/10 Low
- Heat 3/10 Moderate 7 d/yr ≥102°F today · 15 d/yr by 30 yrs out
- Wind 2/10 Low 0% chance of damaging wind over 30 yrs
- Air quality 4/10 Moderate 5 unhealthy d/yr today · 6 by 30 yrs out
Nearby sold comps map
Loading sold comps map…
Walkable amenities ~0.75 mi
Loading nearby amenities…
Taxation est. · year 1
- Rental income
- $48,696
- − Mortgage interest
- −$15,964
- − Property taxes
- −$5,531
- − Insurance
- −$1,425
- − Repairs & maintenance
- −$3,896
- − Management
- −$3,896
- − Depreciation
- −$8,291
- Taxable income
- $9,694
- Est. tax owed @ 24.0%
- −$2,326
- After-tax cash flow
- $11,253/yr
For passive investors: Depreciation is non-cash, so a rental often shows a tax loss while cash-flowing — sheltering income. Rental losses are passive: they offset passive income freely, and up to $25,000/yr can offset ordinary (W-2) income if you actively participate and your MAGI is under $100k (phasing out to $0 by $150k); unused losses carry forward. On sale, claimed depreciation is recaptured at up to 25%, and gains may owe capital-gains tax (a 1031 exchange can defer both). Figures are a year-1 estimate at your 24.0% rate — not tax advice; consult a CPA.
Schools (NCES district)
- District
- Thornton Fractional Twp Hsd 215
- NCES district ID
- 1738940
- Math proficiency
- 9% ▼ -3.00%
- Reading proficiency
- 13% ▼ -3.00%
- Median HH income
- $48,207
- Composite
- 10.27/100
- National rank
- #9793
- State rank
- #563 of 620 in IL
Livability — Calumet City
- Score
- 71/100
- State rank
- #330
- US rank
- #6552
Category grades
Schools grade is shown separately in the Schools card above.
Census & demographics
- Census place
- Calumet City, IL
- County
- Cook County · 4,486,803 people
- City population
- 35,100
- Metro
- Chicago-Naperville-Elgin, IL-IN-WI
- Population (ZIP)
- 35,100
- Household income
- $55,369
- Rent vs Own
- Severe rent burden
- 2415.0
Population outlook (Cook County) Hauer SSP2
- Today (2025)
- 5,347,519 people
- By 2030
- 5,357,703 · +0.2%
- By 2040
- 5,324,924 · -0.4%
- By 2050
- 5,230,762 · -2.2%
- By 2075
- 4,785,735 · -10.5%
- By 2100
- 4,188,836 · -21.7%
Race, ethnicity, and origin ACS 2023
- Neighborhood character
- Predominantly Black (74%)
- Race & ethnicity
- Black 74% Hispanic / Latino 15% White 7% Two or more races 4%
- Hispanic origin (detail)
- Mexican 14%
- Common ancestry
- Romanian 2%
- Foreign-born
- 9% · Canada
- Languages at home
- 83% English-only · Spanish 14%
Political lean MEDSL · Cook
- 2024 margin
- Solid D (+42.0) · D 70.4% · R 28.4% · Other 1.2%
- 2008→2024 swing
- -11.4pp toward R · 2008: 53.4pp · 2024: 42.0pp
- All cycles
- 2024: D+42.0 2020: D+50.3 2016: D+53.0 2012: D+49.4 2008: D+53.4
Not yet ingested
- Civics
- —
Market trends
- HPI YoY
- ▼ -75.01%
- Current HPI
- 197.2137
- Rent YoY
- ▲ 6.17%
- Metro
- Chicago-Naperville-Elgin, IL-IN-WI
- State GDP YoY
- ▲ 1.59%
- F500 in state
- 60
Industry mix (Fortune 500 HQ in IL)
| Industry | F500 HQs | Revenue |
|---|---|---|
| Insurance | 4 | $201B |
|
||
| Consumer Goods | 4 | $87B |
|
||
| Industrial Machinery | 3 | $64B |
|
||
| Healthcare | 2 | $55B |
|
||
| Retail / Pharmacy | 1 | $148B |
|
||
| Agriculture / Food | 1 | $86B |
|
||
Price history
+2275.0% since first listed15 events — show timeline
- 2026-06-08 Listed $285,000 MRED as Distributed by MLS Grid
- 2023-02-09 Sold (Public Records) $90,000 Public Records
- 2023-02-01 Sold (MLS) $90,000 MRED as Distributed by MLS Grid
- 2022-10-14 Pending — MRED as Distributed by MLS Grid
- 2022-10-11 Relisted — MRED as Distributed by MLS Grid
- 2022-10-05 Pending — MRED as Distributed by MLS Grid
- 2022-09-26 Relisted — MRED as Distributed by MLS Grid
- 2022-05-28 Contingent — MRED as Distributed by MLS Grid
- 2022-05-11 Relisted — MRED as Distributed by MLS Grid
- 2022-02-21 Contingent — MRED as Distributed by MLS Grid
- 2022-02-11 Relisted — MRED as Distributed by MLS Grid
- 2021-12-26 Pending — MRED as Distributed by MLS Grid
- 2021-12-06 Listed $99,000 MRED as Distributed by MLS Grid
- 1992-03-04 Sold (Public Records) $73,500 Public Records
- 1983-03-04 Sold (Public Records) $12,000 Public Records
Property tax history
-3.1%/yrLatest (2023): $5,531 · -14.5% YoY. Source: county tax records.
Cash-flow waterfall
monthlySold comps — $/sqft
last 12 mo · ≤1 miLoading sold comps…