101 N US Hwy 60 · Waverly, KY
Flood risk No data
- FEMA flood zone
- —
- Chance of flooding over 30 yrs
- —
- Est. flood insurance / yr
- —
Fire risk No data
- Est. fire insurance / yr
- —
Heat risk No data
- Hot days now (above threshold)
- —
- Hot days in 30 yrs
- —
Wind risk No data
- Chance of severe wind over 30 yrs
- —
Air-quality risk No data
- Unhealthy air days now
- —
- Unhealthy air days in 30 yrs
- —
Risk factors via First Street. Map © Google.
Why this score? — see what drove the D+ grade
The composite is a weighted blend of 9 inputs, each scored 0–100. Each bar is that input's sub-score; the figure is the points it added to the 100-point composite (weight × sub-score).
- Cash flow +20.5/30.0
- DSCR +6.5/10.0
- 1% rule +5.4/10.0
- Appreciation +4.5/10.0
- Condition / age +3.8/5.0
- Livability +3.1/5.0
- Rent growth +2.5/5.0
- Schools +2.2/10.0
- ARV discount +0.0/15.0
$75,000
🖨 Deal sheet 📄 Offer letter ✓ Due diligence
Listing remarks
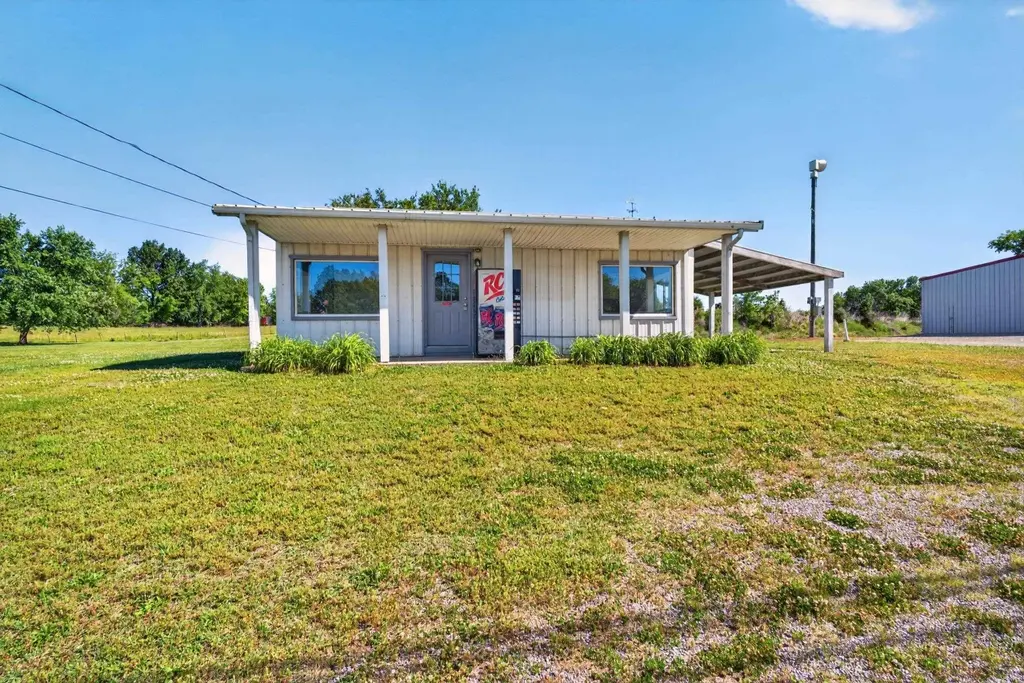
Positioned just off US Hwy 60 in Waverly, KY, this versatile commercial property offers excellent visibility and convenient access. Situated on approximately 0.19 acres, the property has served a variety of uses over the years and features a flexible layout suitable for multiple business opportunities. Interior features include a separate room and a full bathroom for added functionality. Sliding service windows on both sides of the building provide an ideal setup for a potential drive-thru operation. With steady daily traffic exposure and a prime highway location, this property presents a unique opportunity for a variety of commercial uses.
Key facts
- Excellent visibility
- Full bathroom
- Convenient access
Tags
Property features AI
Exterior
- Utilities: Public water; Public sewer
- Home design: Single-family residence; One story; Residential property
- Construction: Aluminum siding; Slab foundation
- Exterior features: Front porch; Metal roof
Interior
- Bedrooms: One main-level bedroom
- Flooring: Vinyl
- Bathrooms: One full bathroom on the main level
- Heating & cooling: Central Air; Forced Air heating
- Interior features: Vinyl flooring; Central air conditioning; Forced air heating
Neighborhood map
What this means for you Summary
Snapshot
- This is a 1-bed/1.0-bath single-family listed at $75k. Condition is rated good.
Deal economics
- At list price, monthly cash flow is $99 ($1k/yr) — positive.
- The deal already cash-flows at list — no discount required.
- Meets the 1% rule at list price ($781 rent vs $75k).
Location & tenants
- Location reads 62/100 on livability (#341 in KY) — a middle-class / working-renter tenant base. Strengths: cost of living A+, housing A+, employment B+; Watch: schools F, amenities F, commute F.
- Union County (rural): math 20% / reading 33% proficiency, ranked #134 of 165 in KY (top 81%) — low school quality limits family demand, transient renter base, plan for 1-2y turnover.
- Market conditions: 4 active listings in the ZIP.
Forward outlook
- Local home prices are declining (-1.0%/yr); year-one equity from $519 of loan paydown is wiped out by about $750 of value loss. Plan a longer hold.
- Union County population projected at -18% by 2050 — secular population decline; favor cash flow + early exit over multi-decade hold.
- At projected returns (-1.0% appreciation + 3.0% rent growth), your $21k cash investment doubles in ~10 years — after that, you're playing with house money.
Negotiation context
- Only 5 days on market — expect competitive offers; lowballing is unlikely to land.
Questions for the listing agent
- Is there a deadline driving the sale (1031 exchange, divorce, estate, relocation)? That informs how much negotiation room exists.
- Schools are F-rated, which usually means shorter tenancies and higher turnover. Who's the typical renter profile here, and what's been the actual vacancy rate?
- The area grade is low — what's the realistic commute time and amenity access for the typical tenant pool here? Any planned neighborhood developments (good or bad) we should know about?
- What's the average days-on-market for RENTAL listings here right now (not sales)? A rising rental-DOM trend means longer vacancies and softer asking-rent achievability than the comps imply.
- What's the recent tenant-quality profile in this submarket — average credit score on applications, eviction rate, late-payment / NSF rate, and stable-employment percentage? A property-management company in the area should have these aggregated.
- How much new for-sale + rental construction is in the pipeline within 1–3 miles? Heavy new supply typically softens prices + rents 12–24 months out; constrained supply supports both.
Investment metrics
- 1% rule
- 1.04% ✓
- Cap rate
- 7.87%
- Cash-on-cash
- 5.63%
- DSCR
- 1.25
- GRM
- 8.0
CMA / ARV
- ARV (on-the-fly)
- $62,640
- Comps found
- 1
Show comp detail 1 sale within ~0.75 mi
| Address | Dist | Beds/Ba | Sqft | Sold | Price | $/sf | Match |
|---|---|---|---|---|---|---|---|
| 101 N US Hwy 60 | 0.00mi | 1/1.0 | 540 (0%) | 0mo | $62,500 | $116 | 100 |
Match score weights: distance 35% · size 25% · config 20% · recency 20%. Top-matched comps best support the ARV.
Projected returns pro-forma
-1.0% appreciation · 3.0% rent growth · sell at horizon
- IRR
- 0.7%
- Equity multiple
- 1.03×
- Total profit
- $642
- Equity at exit
- $18,103
- IRR
- 7.3%
- Equity multiple
- 1.70×
- Total profit
- $14,799
- Equity at exit
- $19,008
Cash invested: $21,000 (down + closing). Projections, not guarantees.
Landlord ↔ Tenant lean methodology
- Overall (STATE)
- 83 Strongly Landlord-Friendly
- State Kentucky
- 83 Strongly Landlord-Friendly · R+16
- County
- — inherits STATE
- City
- — inherits STATE
ZIP-level market 42462
- Home prices YoY
- -0.6%
- Active inventory
- 4
- Price-to-rent
- 8.0×
Monthly cashflow live
- Estimated rent
- $781 medium interval (Pro) →
- Mortgage (P&I)
- −$393
- Tax est. 1.5%
- −$94 /mo · $1,125/yr
- Insurance
- −$31
- HOA
- −$0
- Vacancy / Maint / Mgmt
- −$164
- Net cashflow
- $99
Break-even live
UW: 25.0% down · 7.5% · 30yr · 1.5% tax · 5.0% vac · 8.0% maint · 8.0% mgmt
Financing live
Cash to close
- Down payment
- $18,750
- Closing costs
- $2,250
- Reserves months
- —
- Total cash needed
- —
Loan-product check · same deal, 3 products live
Conventional
25% down · 7.5% · 30yr
- Down + closing
- —
- Monthly P&I
- —
- Monthly cashflow
- —
- DSCR
- —
- Eligible?
- —
Personal DTI + credit; lowest rate.
DSCR
20% down · 8.5% · 30yr
- Down + closing
- —
- Monthly P&I
- —
- Monthly cashflow
- —
- DSCR
- —
- Eligible?
- —
No personal income docs; deal must DSCR.
Hard money
10% down · 12.0% · 12mo
- Down + closing
- —
- Monthly P&I
- —
- Monthly cashflow
- —
- DSCR
- —
- Eligible?
- —
Short-term bridge; refi at stabilization.
Listing history 1 events
-
2026-05-16$75,000 Active
ⓘ Source: listings_history table (triggers on properties + properties_extension) + one-shot
backfill from property_details.listing_events for pre-trigger history.
Nearby sold comps map
Loading sold comps map…
Walkable amenities ~0.75 mi
Loading nearby amenities…
Taxation est. · year 1
- Rental income
- $9,370
- − Mortgage interest
- −$4,201
- − Property taxes
- −$1,125
- − Insurance
- −$375
- − Repairs & maintenance
- −$750
- − Management
- −$750
- − Depreciation
- −$2,182
- Taxable loss
- −$12
- Est. tax savings @ 24.0%
- +$3
- After-tax cash flow
- $1,186/yr
For passive investors: Depreciation is non-cash, so a rental often shows a tax loss while cash-flowing — sheltering income. Rental losses are passive: they offset passive income freely, and up to $25,000/yr can offset ordinary (W-2) income if you actively participate and your MAGI is under $100k (phasing out to $0 by $150k); unused losses carry forward. On sale, claimed depreciation is recaptured at up to 25%, and gains may owe capital-gains tax (a 1031 exchange can defer both). Figures are a year-1 estimate at your 24.0% rate — not tax advice; consult a CPA.
Condition & rehab AI · 13 photos
This commercial property is in good condition with minimal repairs needed. It offers a good opportunity for various business uses due to its prime location and flexible layout.
Value-add opportunities
- Both Painting exterior — Enhances curb appeal and value
- Both Landscaping improvements — Enhances curb appeal and value
- Both HVAC maintenance — Ensures comfort and energy efficiency
Renovation cost estimate screening
Value-add ROI direction
- Both Painting exterior — Enhances curb appeal and value ↑
- Both Landscaping improvements — Enhances curb appeal and value ↑
- Both HVAC maintenance — Ensures comfort and energy efficiency ↑
ⓘ Cost ranges are severity-bucket heuristics (US national rule-of-thumb). Get contractor quotes + a written scope before underwriting a rehab budget.
Schools (NCES district)
- District
- Union County
- NCES district ID
- 2105640
- Math proficiency
- 20% ▼ -20.00%
- Reading proficiency
- 33% ▼ -20.00%
- Median HH income
- $39,776
- Composite
- 22.27/100
- National rank
- #8139
- State rank
- #134 of 165 in KY
Livability — Waverly
- Score
- 62/100
- State rank
- #341
- US rank
- #16187
Category grades
Schools grade is shown separately in the Schools card above.
Census & demographics
- Census place
- Waverly, KY
- Population (ZIP)
- 1,627
Population outlook (Union County) Hauer SSP2
- Today (2025)
- 15,038 people
- By 2030
- 14,681 · -2.4%
- By 2040
- 13,607 · -9.5%
- By 2050
- 12,406 · -17.5%
- By 2075
- 9,720 · -35.4%
- By 2100
- 7,841 · -47.9%
Race, ethnicity, and origin ACS 2023
- Neighborhood character
- Predominantly White (76%)
- Race & ethnicity
- White 76% Black 15% Two or more races 9% Hispanic / Latino 1%
- Common ancestry
- Italian 9% Serbian 2% Iranian 1%
Political lean MEDSL · Union
- 2024 margin
- Solid R (+58.3) · D 20.2% · R 78.5% · Other 1.2%
- 2008→2024 swing
- -53.1pp toward R · 2008: -5.2pp · 2024: -58.3pp
- All cycles
- 2024: R+58.3 2020: R+52.2 2016: R+54.3 2012: R+33.6 2008: R+5.2
Not yet ingested
- Civics
- —
Market trends
- HPI YoY
- ▼ -1.00%
- Current HPI
- 175.166
- Rent YoY
- —
- Metro
- —
- State GDP YoY
- ▲ 1.81%
- F500 in state
- 4
Industry mix (Fortune 500 HQ in KY)
| Industry | F500 HQs | Revenue |
|---|---|---|
| Healthcare | 1 | $118B |
|
||
| Food / Beverage | 1 | $7B |
|
||
Price history
1 event — show timeline
- 2026-05-16 Listed $75,000 HABOR
Cash-flow waterfall
monthlySold comps — $/sqft
last 12 mo · ≤1 miLoading sold comps…