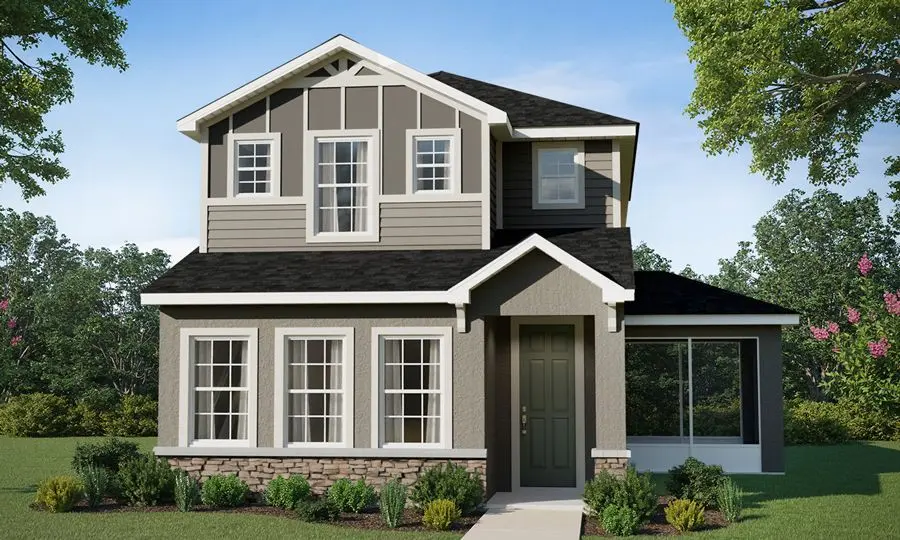
4042 Waving Hickory Blvd · St. Cloud, FL
Flood risk 1/10 · Minimal
- FEMA flood zone
- X (unshaded)
- Chance of flooding over 30 yrs
- 0.0%
- Est. flood insurance / yr
- $507 – $1,088
Fire risk 6/10 · Moderate
- Est. fire insurance / yr
- $947 – $1,759
Heat risk 9/10 · Severe
- Hot days now (above 108°F)
- 7 days/yr
- Hot days in 30 yrs
- 24 days/yr
Wind risk 10/10 · Severe
- Chance of severe wind over 30 yrs
- 99.0%
Air-quality risk 2/10 · Minimal
- Unhealthy air days now
- 1 days/yr
- Unhealthy air days in 30 yrs
- 1 days/yr
Risk factors via First Street. Map © Google.
Why this score? — see what drove the D grade
The composite is a weighted blend of 9 inputs, each scored 0–100. Each bar is that input's sub-score; the figure is the points it added to the 100-point composite (weight × sub-score).
- Cash flow +15.0/30.0
- ARV discount +7.5/15.0
- 1% rule +5.0/10.0
- DSCR +5.0/10.0
- Schools +3.6/10.0
- Rent growth +3.1/5.0
- Livability +2.5/5.0
- Condition / age +2.5/5.0
- Appreciation +0.0/10.0
$37,428
🖨 Deal sheet 📄 Offer letter ✓ Due diligence
Listing remarks
Under Construction. 2-story new construction Bungalow with 1946 square feet, 3 bedrooms with loft, 2.5 baths, a 2-car garage, and a covered lanai. Downstairs, enjoy an open layout and a gourmet kitchen with Silestone countertops, shaker-style wood cabinets, Samsung stainless steel appliances, and a pantry. The entire lower level and upstairs baths are finished with luxury vinyl plank flooring, with stain-resistant carpet in the bedrooms. Upstairs, you'll find 3 spacious bedrooms including your owner's suite complete with a walk-in wardrobe, linen closet, and a private en-suite bath with dual vanities and a tiled shower. Additional features for your convenience include a half bath downstairs
Key facts
- 5,227 sq ft lot
- 2 garage spots
- Community pool
Property features AI
Finance
- Other: Address: 4042 Waving Hickory Blvd, Saint Cloud, FL 34772; List price available (listing provided by Zillow)
Exterior
- Parking: 2 total parking spaces; 2-car garage
- Home design: Single-family home; Aria plan
- Exterior features: Living area approximately 1946
Interior
- Bedrooms: 3 bedrooms
- Bathrooms: 2 full bathrooms and 1 half bathroom (2.5 total)
- Interior features: Spec home — Aria plan; Active listing (modified May 21, 2026)
Neighborhood map
What this means for you Summary
Snapshot
- This is a 3-bed/2.5-bath single-family listed at $37k.
Deal economics
- At list price, monthly cash flow is $2k ($21k/yr) — positive.
- The deal already cash-flows at list — no discount required.
- Meets the 1% rule at list price ($3k rent vs $37k).
- Cap rate 62.1% vs local median 4.0% in St. Cloud — top-decile yield for the area; either an underpriced asset or a hidden risk that comps aren't pricing in. Stress-test before assuming the spread holds.
Location & tenants
- Location reads: area grade D — affects rentability + tenant quality, not the cash-flow math above.
- Osceola (suburban): math 39% / reading 45% proficiency, ranked #60 of 73 in FL (top 82%) — families likely to look elsewhere, expect single-tenant / working-renter base with shorter leases; 60% free/reduced lunch — lower-income household profile, screen leases tightly.
- Market conditions: Rents rising (+2.3%/yr); 868 active listings in the ZIP; 6 comparable units currently listed for rent nearby; rentals at typical pace (median 24d on market — plan ~3-4 weeks tenant-placement turnaround); solid renter incomes; 8,813 units permitted in Osceola County in 2024 (3,072 in 5+ unit buildings).
- This rent runs 31% of the median local income ($98k/yr) — at the standard rent-burdened threshold; future hikes will face affordability resistance.
Forward outlook
- Local home prices are declining (-3.0%/yr); year-one equity from $259 of loan paydown is wiped out by about $1k of value loss. Plan a longer hold.
- Osceola County population projected at +73% by 2050 — long-run rental-demand tailwind backs the buy-and-hold thesis.
- At projected returns (-3.0% appreciation + 2.3% rent growth), your $10k cash investment doubles in ~1 year — after that, you're playing with house money.
Negotiation context
- Only 0 days on market — expect competitive offers; lowballing is unlikely to land.
Risks & watch-outs
- Climate carrying-cost: severe wind risk, 99% chance of damaging wind over 30y; major wildfire risk; extreme-heat days projected 7→24/yr by 2055 (HVAC capex compounding) — expect insurance premiums to compound above CPI over the hold.
Questions for the listing agent
- What does the HOA fee cover, when was the last increase, and are there any pending special assessments or reserve-fund shortfalls?
- Is there a deadline driving the sale (1031 exchange, divorce, estate, relocation)? That informs how much negotiation room exists.
- The area grade is low — what's the realistic commute time and amenity access for the typical tenant pool here? Any planned neighborhood developments (good or bad) we should know about?
- What's the average days-on-market for RENTAL listings here right now (not sales)? A rising rental-DOM trend means longer vacancies and softer asking-rent achievability than the comps imply.
- What's the recent tenant-quality profile in this submarket — average credit score on applications, eviction rate, late-payment / NSF rate, and stable-employment percentage? A property-management company in the area should have these aggregated.
- How much new for-sale + rental construction is in the pipeline within 1–3 miles? Heavy new supply typically softens prices + rents 12–24 months out; constrained supply supports both.
Investment metrics
- 1% rule
- 6.79% ✓
- Cap rate
- 62.09%
- Cash-on-cash
- 199.28%
- DSCR
- 9.87
- GRM
- 1.2
CMA / ARV
- ARV (on-the-fly)
- $383,362
- Comps found
- 12
Show comp detail 12 sales within ~0.75 mi
| Address | Dist | Beds/Ba | Sqft | Sold | Price | $/sf | Match |
|---|---|---|---|---|---|---|---|
| 4030 Waving Hickory Blvd | 0.02mi | 3/2.5 | 1,946 (0%) | 1mo | $355,900 | $183 | 98 |
| 4017 Kindling Wood Way | 0.04mi | 3/2.5 | 1,946 (0%) | 1mo | $352,900 | $181 | 97 |
| 5556 Buckeye Bend Dr | 0.15mi | 3/2.0 | 2,005 (+3%) | 1mo | $380,900 | $190 | 85 |
| 5545 Buckeye Bend Dr | 0.15mi | 3/2.0 | 2,005 (+3%) | 2mo | $395,900 | $197 | 84 |
| 4065 Kindling Wood Way | 0.04mi | 3/2.5 | 2,100 (+8%) | 1mo | $367,900 | $175 | 84 |
| 4023 Kindling Wood Way | 0.04mi | 4/2.5 (+1) | 2,066 (+6%) | 1mo | $357,900 | $173 | 82 |
| 4011 Kindling Wood Way | 0.05mi | 4/2.5 (+1) | 2,066 (+6%) | 1mo | $357,900 | $173 | 82 |
| 5550 Buckeye Bend Dr | 0.14mi | 4/2.0 (+1) | 1,819 (-6%) | 1mo | $386,095 | $212 | 75 |
| 5527 Buckeye Bend Dr | 0.12mi | 4/2.0 (+1) | 1,715 (-12%) | 2mo | $368,900 | $215 | 66 |
| 5557 Buckeye Bend Dr | 0.16mi | 4/2.0 (+1) | 1,715 (-12%) | 1mo | $373,900 | $218 | 65 |
| 5581 Buckeye Bend Dr | 0.20mi | 4/2.0 (+1) | 1,715 (-12%) | 2mo | $377,900 | $220 | 62 |
| 5599 Buckeye Bend Dr | 0.22mi | 4/2.0 (+1) | 1,715 (-12%) | 1mo | $372,620 | $217 | 62 |
Match score weights: distance 35% · size 25% · config 20% · recency 20%. Top-matched comps best support the ARV.
Projected returns pro-forma
-3.0% appreciation · 2.3% rent growth · sell at horizon
- IRR
- —
- Equity multiple
- 10.83×
- Total profit
- $103,044
- Equity at exit
- $5,581
- IRR
- —
- Equity multiple
- 22.51×
- Total profit
- $225,442
- Equity at exit
- $3,236
Cash invested: $10,480 (down + closing). Projections, not guarantees.
Landlord ↔ Tenant lean methodology
- Overall (STATE)
- 87 Strongly Landlord-Friendly
- State Florida
- 87 Strongly Landlord-Friendly · R+3
- County
- — inherits STATE
- City
- — inherits STATE
ZIP-level market 34772
- Home prices YoY
- -32.5%
- Rents YoY
- 2.3%
- Active inventory
- 868
- Price-to-rent
- 1.2×
Monthly cashflow live
- Estimated rent
- $2,540 high interval (Pro) →
- Mortgage (P&I)
- −$196
- Tax est. 1.5%
- −$47 /mo · $561/yr
- Insurance
- −$16
- HOA
- −$8
- Vacancy / Maint / Mgmt
- −$534
- Net cashflow
- $1,740
Break-even live
UW: 25.0% down · 7.5% · 30yr · 1.5% tax · 5.0% vac · 8.0% maint · 8.0% mgmt
Financing live
Cash to close
- Down payment
- $9,357
- Closing costs
- $1,123
- Reserves months
- —
- Total cash needed
- —
Loan-product check · same deal, 3 products live
Conventional
25% down · 7.5% · 30yr
- Down + closing
- —
- Monthly P&I
- —
- Monthly cashflow
- —
- DSCR
- —
- Eligible?
- —
Personal DTI + credit; lowest rate.
DSCR
20% down · 8.5% · 30yr
- Down + closing
- —
- Monthly P&I
- —
- Monthly cashflow
- —
- DSCR
- —
- Eligible?
- —
No personal income docs; deal must DSCR.
Hard money
10% down · 12.0% · 12mo
- Down + closing
- —
- Monthly P&I
- —
- Monthly cashflow
- —
- DSCR
- —
- Eligible?
- —
Short-term bridge; refi at stabilization.
Rent comps 6 comps
| Address | Beds | Baths | Sqft | Rent | $/sqft | DOM | Units | Dist |
|---|---|---|---|---|---|---|---|---|
| 3923 Malawi Trl Saint Cloud, FL | 4.0 | 2.0 | 1846 | $2,350 | $1.27 | 24d | 1 | 1.04mi |
| 3928 Malawi Trl Saint Cloud, FL | 4.0 | 2.0 | 1828 | $2,924 | $1.60 | 15d | 1 | 1.07mi |
| 4095 Malawi Trl Saint Cloud, FL | 3.0 | 2.5 | 1463 | $2,000 | $1.37 | 24d | 1 | 1.28mi |
| 5116 Tana Ter Saint Cloud, FL | 4.0 | 2.0 | 1828 | $2,395 | $1.31 | 20d | 1 | 1.30mi |
| 4113 Malawi Trl Saint Cloud, FL | 3.0 | 2.5 | 1452 | $1,900 | $1.31 | 22d | 1 | 1.32mi |
| 3997 Magenta Pl Saint Cloud, FL | 3.0 | 2.0 | 1676 | $2,350 | $1.40 | 24d | 1 | 1.40mi |
HOA detail
- Monthly dues
- $8 · $96/yr
Listing history 3 events
-
2026-06-02pricestatusdays on market $37,428 Pending
-
2026-06-02days on market $374,285 Active 23 DOM
-
2026-05-31days on market $374,285 Active 22 DOM
ⓘ Source: listings_history table (triggers on properties + properties_extension) + one-shot
backfill from property_details.listing_events for pre-trigger history.
Climate risk First Street
- Flood 1/10 Low FEMA zone X (unshaded) · 0% chance over 30 yrs
- Wildfire 6/10 Major
- Heat 9/10 Extreme 7 d/yr ≥108°F today · 24 d/yr by 30 yrs out
- Wind 10/10 Extreme 99% chance of damaging wind over 30 yrs
- Air quality 2/10 Low 1 unhealthy d/yr today · 1 by 30 yrs out
Nearby sold comps map
Loading sold comps map…
Walkable amenities ~0.75 mi
Loading nearby amenities…
Taxation est. · year 1
- Rental income
- $30,486
- − Mortgage interest
- −$2,097
- − Property taxes
- −$561
- − Insurance
- −$187
- − Repairs & maintenance
- −$2,439
- − Management
- −$2,439
- − HOA
- −$96
- − Depreciation
- −$1,089
- Taxable income
- $21,578
- Est. tax owed @ 24.0%
- −$5,179
- After-tax cash flow
- $15,705/yr
For passive investors: Depreciation is non-cash, so a rental often shows a tax loss while cash-flowing — sheltering income. Rental losses are passive: they offset passive income freely, and up to $25,000/yr can offset ordinary (W-2) income if you actively participate and your MAGI is under $100k (phasing out to $0 by $150k); unused losses carry forward. On sale, claimed depreciation is recaptured at up to 25%, and gains may owe capital-gains tax (a 1031 exchange can defer both). Figures are a year-1 estimate at your 24.0% rate — not tax advice; consult a CPA.
Schools (NCES district)
- District
- Osceola
- NCES district ID
- 1201470
- Math proficiency
- 39% ▼ -9.00%
- Reading proficiency
- 45% ▼ -4.00%
- Median HH income
- $45,528
- Composite
- 35.7/100
- National rank
- #4865
- State rank
- #60 of 73 in FL
Livability — St. Cloud
No livability data for this city. (Only ~50 U.S. cities are tracked.)
Census & demographics
- County
- Osceola County · 410,217 people
- City population
- 29,247
- Metro
- Orlando-Kissimmee-Sanford, FL
- Population (ZIP)
- 35,390
- Household income
- $97,868
- Rent vs Own
- Severe rent burden
- 443.0
Population outlook (Osceola County) Hauer SSP2
- Today (2025)
- 447,624 people
- By 2030
- 511,823 · +14.3%
- By 2040
- 642,986 · +43.6%
- By 2050
- 774,552 · +73.0%
- By 2075
- 1,078,144 · +140.9%
- By 2100
- 1,269,660 · +183.6%
Race, ethnicity, and origin ACS 2023
- Neighborhood character
- Diverse neighborhood (Simpson 0.62)
- Race & ethnicity
- White 44% Hispanic / Latino 44% Two or more races 19% Black 4% Asian 2%
- Hispanic origin (detail)
- Puerto Rican 20% Cuban 2% Dominican 6%
- Common ancestry
- Lithuanian 2% Slovak 1% Iranian 1%
- Foreign-born
- 18% · Canada, Jamaica
- Languages at home
- 60% English-only · Spanish 36% German/W. Germanic 1% Other Indo-European 1%
Political lean MEDSL · Osceola
- 2024 margin
- Toss-up / Even · D 48.7% · R 50.2% · Other 1.1%
- 2008→2024 swing
- -21.2pp toward R · 2008: 19.7pp · 2024: -1.4pp
- All cycles
- 2024: R+1.4 2020: D+13.8 2016: D+25.0 2012: D+24.5 2008: D+19.7
Not yet ingested
- Civics
- —
Market trends
- HPI YoY
- ▼ -132.55%
- Current HPI
- 274.6517
- Rent YoY
- ▲ 2.30%
- Metro
- Orlando-Kissimmee-Sanford, FL
- State GDP YoY
- ▲ 3.28%
- F500 in state
- 36
Industry mix (Fortune 500 HQ in FL)
| Industry | F500 HQs | Revenue |
|---|---|---|
| Industrial Technology | 2 | $29B |
|
||
| Insurance | 2 | $17B |
|
||
| Retail | 1 | $60B |
|
||
| Technology Distribution | 1 | $58B |
|
||
| Homebuilding | 1 | $35B |
|
||
| Technology Manufacturing | 1 | $35B |
|
||
Cash-flow waterfall
monthlySold comps — $/sqft
last 12 mo · ≤1 miLoading sold comps…