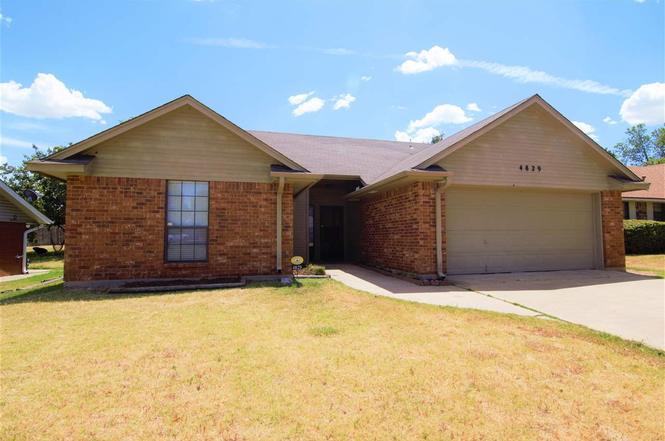
4829 SE Tattershall Way · Lawton, OK
Flood risk 1/10 · Minimal
- FEMA flood zone
- X (unshaded)
- Chance of flooding over 30 yrs
- 0.0%
- Est. flood insurance / yr
- $507 – $1,088
Fire risk 7/10 · Major
- Est. fire insurance / yr
- $2,463 – $4,575
Heat risk 7/10 · Major
- Hot days now (above 109°F)
- 7 days/yr
- Hot days in 30 yrs
- 20 days/yr
Wind risk 3/10 · Minor
- Chance of severe wind over 30 yrs
- 6.0%
Air-quality risk 1/10 · Minimal
- Unhealthy air days now
- 0 days/yr
- Unhealthy air days in 30 yrs
- 0 days/yr
Risk factors via First Street. Map © Google.
Why this score? — see what drove the D- grade
The composite is a weighted blend of 9 inputs, each scored 0–100. Each bar is that input's sub-score; the figure is the points it added to the 100-point composite (weight × sub-score).
- Cash flow +12.9/30.0
- Appreciation +4.6/10.0
- DSCR +3.9/10.0
- 1% rule +3.2/10.0
- Livability +3.2/5.0
- Rent growth +2.9/5.0
- Condition / age +2.5/5.0
- Schools +2.0/10.0
- ARV discount +1.3/15.0
$165,000
🖨 Deal sheet 📄 Offer letter ✓ Due diligence
Listing remarks MLS
Come see this recently remodeled 3 bed, 2 bath, 2 car garage home located in the highly desirable Macarthur School District. The remodel includes new flooring throughout, new paint, new granite countertops, new cabinets, new fixtures, new stainless steel appliances, and the list goes on and on. The soaring ceilings give this home a much bigger feel. Come see today!
Key facts
- Granite counter top
- Updated home
- Bay windows
Tags
Property features AI
Exterior
- Parking: 2 total parking spaces; 2 covered spaces; 2-car garage with garage door opener
- Utilities: Public water; Public sewer
- Home design: Single-family residence; One story; Updated/remodeled
- Construction: Brick veneer construction; Composition roof; Slab foundation; Built as residential single-family
- Exterior features: Patio; Wood fencing; Public maintained road access; City street frontage
Interior
- Kitchen: Cooktop; Microwave; Dishwasher; Disposal; Range hood; Electric water heater
- Flooring: Carpet; Vinyl
- Bathrooms: 2 full bathrooms
- Heating & cooling: Central heating; Electric heating; Fireplace heating; Central air; Ceiling fans; Electric cooling
- Interior features: Walk-in closets; Granite countertops; Double-pane windows; Wood-burning fireplace
- Laundry & utility: Washer hookup
Neighborhood map
What this means for you Summary
Snapshot
- This is a 3-bed/2.0-bath single-family listed at $165k.
Deal economics
- At list price, monthly cash flow is $-13 ($-152/yr) — negative.
- To cash-flow at today's rent, offer at most $163k (1.4% below list).
- To meet the 1% rule (rent ≥ 1% of price), the offer needs to be $136k (17.7% below list).
- Recommended offer: $136k (17.7% below list) — sets the bar for 1% rule.
Location & tenants
- Location reads 63/100 on livability (#206 in OK) — a middle-class / working-renter tenant base. Strengths: cost of living A+, housing A+; Watch: employment D, crime F, commute F.
- Lawton (urban): math 20% / reading 26% proficiency, ranked #137 of 270 in OK (top 51%) — low school quality limits family demand, transient renter base, plan for 1-2y turnover.
- Zoned schools: Sullivan Village Es (math 22% / reading 27%, grade F, #354 of 845 statewide, top 47%, 433 students, 0% FRL); Macarthur Ms (math 16% / reading 31%, grade F, #113 of 345 statewide, top 34%, 865 students, 0% FRL); Macarthur Hs (math 19% / reading 34%, grade F, #139 of 447 statewide, top 31%, 1,163 students, 0% FRL) — zoned schools average 0% FRL vs 54% district-wide (54 pts lower); this property's tenant base skews higher-income than the district average.
- Market conditions: Rents rising (+1.7%/yr); 117 active listings in the ZIP; 133 units permitted in Comanche County in 2024 (0 in 5+ unit buildings).
- This rent runs 33% of the median local income ($50k/yr) — at the standard rent-burdened threshold; future hikes will face affordability resistance.
Forward outlook
- Local home prices are declining (-0.7%/yr); year-one equity from $1k of loan paydown is wiped out by about $1k of value loss. Plan a longer hold.
- Comanche County population projected to shrink 3% by 2050 — rents likely to lag national; underwrite the cash flow, not the appreciation.
Negotiation context
- Only 3 days on market — expect competitive offers; lowballing is unlikely to land.
- 3 sale attempts since 11y ago with the ask held roughly flat each time — persistent listings suggest the price (not the market) is what's stuck; bring a comps-based counter.
- Current owner paid $142k; 16% above their basis — modest negotiation headroom, anchor on the comps not their cost.
Risks & watch-outs
- Climate carrying-cost: major wildfire risk; extreme-heat days projected 7→20/yr by 2055 (HVAC capex compounding) — expect insurance premiums to compound above CPI over the hold.
Questions for the listing agent
- What do current leases actually rent for vs. the listed asking? Can we see a recent rent roll and the last 12 months of T-12 income?
- Is there a deadline driving the sale (1031 exchange, divorce, estate, relocation)? That informs how much negotiation room exists.
- Schools are D-rated, which usually means shorter tenancies and higher turnover. Who's the typical renter profile here, and what's been the actual vacancy rate?
- Crime grade is F in this area — have there been break-ins, vandalism, or insurance claims at this property in the last 3 years? What carrier currently insures it and at what premium?
- The area grade is low — what's the realistic commute time and amenity access for the typical tenant pool here? Any planned neighborhood developments (good or bad) we should know about?
- What's the average days-on-market for RENTAL listings here right now (not sales)? A rising rental-DOM trend means longer vacancies and softer asking-rent achievability than the comps imply.
- What's the recent tenant-quality profile in this submarket — average credit score on applications, eviction rate, late-payment / NSF rate, and stable-employment percentage? A property-management company in the area should have these aggregated.
- How much new for-sale + rental construction is in the pipeline within 1–3 miles? Heavy new supply typically softens prices + rents 12–24 months out; constrained supply supports both.
Investment metrics
- 1% rule
- 0.82% ✗
- Cap rate
- 6.20%
- Cash-on-cash
- -0.33%
- DSCR
- 0.99
- GRM
- 10.1
CMA / ARV
- ARV (on-the-fly)
- $145,061
- Comps found
- 12
Show comp detail 12 sales within ~0.75 mi
| Address | Dist | Beds/Ba | Sqft | Sold | Price | $/sf | Match |
|---|---|---|---|---|---|---|---|
| 103 SE Churchill Way | 0.13mi | 3/2.0 | 1,300 (+7%) | 4mo | $165,000 | $127 | 79 |
| 118 SE Sungate Blvd | 0.10mi | 3/2.0 | 1,100 (-10%) | 1mo | $107,000 | $97 | 78 |
| 412 SE Sungate Blvd | 0.19mi | 3/2.0 | 1,300 (+7%) | 4mo | $167,500 | $129 | 77 |
| 404 SE Sungate Blvd | 0.19mi | 3/2.0 | 1,300 (+7%) | 5mo | $158,000 | $122 | 76 |
| 202 NE 48th St | 0.27mi | 3/2.0 | 1,300 (+7%) | 2mo | $199,500 | $153 | 74 |
| 4637 SE Aberdeen Ave | 0.52mi | 3/2.0 | 1,200 (-2%) | 2mo | $125,000 | $104 | 72 |
| 4915 SE Randolph Rd | 0.08mi | 3/2.0 | 1,400 (+15%) | 4mo | $167,000 | $119 | 68 |
| 205 SE Heather Ln | 0.14mi | 3/2.0 | 1,400 (+15%) | 3mo | $180,000 | $129 | 66 |
| 4220 SE Ford Rd | 0.61mi | 3/1.5 | 1,200 (-2%) | 4mo | $127,000 | $106 | 63 |
| 4502 NE Arlington Ave | 0.39mi | 2/2.5 (-1) | 1,300 (+7%) | 2mo | $62,000 | $48 | 62 |
| 4629 SE Brighton Pl | 0.44mi | 3/2.0 | 1,100 (-10%) | 4mo | $81,999 | $75 | 59 |
| 4630 SE Brighton Dr | 0.37mi | 3/1.5 | 1,400 (+15%) | 2mo | $135,000 | $96 | 54 |
Match score weights: distance 35% · size 25% · config 20% · recency 20%. Top-matched comps best support the ARV.
Projected returns pro-forma
-0.71% appreciation · 1.7% rent growth · sell at horizon
- IRR
- -6.3%
- Equity multiple
- 0.72×
- Total profit
- $-12,823
- Equity at exit
- $42,144
- IRR
- -0.8%
- Equity multiple
- 0.92×
- Total profit
- $-3,557
- Equity at exit
- $46,259
Cash invested: $46,200 (down + closing). Projections, not guarantees.
Landlord ↔ Tenant lean methodology
- Overall (STATE)
- 83 Strongly Landlord-Friendly
- State Oklahoma
- 83 Strongly Landlord-Friendly · R+20
- County
- — inherits STATE
- City
- — inherits STATE
ZIP-level market 73501
- Home prices YoY
- -0.4%
- Rents YoY
- 1.7%
- Active inventory
- 117
- Price-to-rent
- 10.1×
Monthly cashflow live
- Estimated rent
- $1,358 medium interval (Pro) →
- Mortgage (P&I)
- −$865
- Tax from tax record
- −$152 /mo · $1,822/yr
- Insurance
- −$69
- HOA
- −$0
- Vacancy / Maint / Mgmt
- −$285
- Net cashflow
- $-13
Break-even live
UW: 25.0% down · 7.5% · 30yr · 1.5% tax · 5.0% vac · 8.0% maint · 8.0% mgmt
Financing live
Cash to close
- Down payment
- $41,250
- Closing costs
- $4,950
- Reserves months
- —
- Total cash needed
- —
Loan-product check · same deal, 3 products live
Conventional
25% down · 7.5% · 30yr
- Down + closing
- —
- Monthly P&I
- —
- Monthly cashflow
- —
- DSCR
- —
- Eligible?
- —
Personal DTI + credit; lowest rate.
DSCR
20% down · 8.5% · 30yr
- Down + closing
- —
- Monthly P&I
- —
- Monthly cashflow
- —
- DSCR
- —
- Eligible?
- —
No personal income docs; deal must DSCR.
Hard money
10% down · 12.0% · 12mo
- Down + closing
- —
- Monthly P&I
- —
- Monthly cashflow
- —
- DSCR
- —
- Eligible?
- —
Short-term bridge; refi at stabilization.
Listing history 4 events
-
2026-06-19days on market $165,000 Active 3 DOM
-
2026-06-18days on market $165,000 Active 2 DOM
-
2026-06-17remarks 684-char remark
-
2026-06-17$165,000 Active 1 DOM
ⓘ Source: listings_history table (triggers on properties + properties_extension) + one-shot
backfill from property_details.listing_events for pre-trigger history.
Tax reassessment forecast OK · Resets to sale price
- Current annual tax
- $1,822 · $152/mo
- Projected year-2 tax
- $1,822 · $152/mo
- Expected delta
- $0/yr ($0/mo · 0.0%)
ⓘ Screening estimate from a state-policy table — verify with the county assessor before closing.
Climate risk First Street
- Flood 1/10 Low FEMA zone X (unshaded) · 0% chance over 30 yrs
- Wildfire 7/10 Severe
- Heat 7/10 Severe 7 d/yr ≥109°F today · 20 d/yr by 30 yrs out
- Wind 3/10 Moderate 6% chance of damaging wind over 30 yrs
- Air quality 1/10 Low 0 unhealthy d/yr today · 0 by 30 yrs out
Nearby sold comps map
Loading sold comps map…
Walkable amenities ~0.75 mi
Loading nearby amenities…
Taxation est. · year 1
- Rental income
- $16,301
- − Mortgage interest
- −$9,243
- − Property taxes
- −$1,822
- − Insurance
- −$825
- − Repairs & maintenance
- −$1,304
- − Management
- −$1,304
- − Depreciation
- −$4,800
- Taxable loss
- −$2,996
- Est. tax savings @ 24.0%
- +$719
- After-tax cash flow
- $567/yr
For passive investors: Depreciation is non-cash, so a rental often shows a tax loss while cash-flowing — sheltering income. Rental losses are passive: they offset passive income freely, and up to $25,000/yr can offset ordinary (W-2) income if you actively participate and your MAGI is under $100k (phasing out to $0 by $150k); unused losses carry forward. On sale, claimed depreciation is recaptured at up to 25%, and gains may owe capital-gains tax (a 1031 exchange can defer both). Figures are a year-1 estimate at your 24.0% rate — not tax advice; consult a CPA.
Schools (NCES district)
- District
- Lawton
- NCES district ID
- 4017250
- Math proficiency
- 20% ▼ -12.00%
- Reading proficiency
- 26% ▼ -9.00%
- Median HH income
- $42,618
- Composite
- 19.68/100
- National rank
- #8732
- State rank
- #137 of 270 in OK
Livability — Lawton
- Score
- 63/100
- State rank
- #206
- US rank
- #15131
Category grades
Schools grade is shown separately in the Schools card above.
Census & demographics
- Census place
- Lawton, OK
- County
- Comanche County · 96,361 people
- City population
- 89,233
- Metro
- Lawton, OK
- Population (ZIP)
- 20,397
- Household income
- $49,741
- Rent vs Own
- Severe rent burden
- 742.0
Population outlook (Comanche County) Hauer SSP2
- Today (2025)
- 124,518 people
- By 2030
- 124,231 · -0.2%
- By 2040
- 122,193 · -1.9%
- By 2050
- 120,368 · -3.3%
- By 2075
- 120,492 · -3.2%
- By 2100
- 123,113 · -1.1%
Race, ethnicity, and origin ACS 2023
- Neighborhood character
- Highly diverse neighborhood (Simpson 0.73)
- Race & ethnicity
- White 45% Black 20% Two or more races 18% Hispanic / Latino 14% Native American 7% Asian 3%
- Hispanic origin (detail)
- Mexican 7% Puerto Rican 4%
- Common ancestry
- Lithuanian 2% Italian 2% Slovak 1%
- Foreign-born
- 6% · Canada, Vietnam, South Korea
- Languages at home
- 88% English-only · Spanish 8% Tagalog/Filipino 1% German/W. Germanic 1%
Political lean MEDSL · Comanche
- 2024 margin
- Strong R (+23.3) · D 37.4% · R 60.7% · Other 1.9%
- 2008→2024 swing
- -5.8pp toward R · 2008: -17.5pp · 2024: -23.3pp
- All cycles
- 2024: R+23.3 2020: R+20.1 2016: R+23.7 2012: R+17.0 2008: R+17.5
Not yet ingested
- Civics
- —
Market trends
- HPI YoY
- ▼ -0.71%
- Current HPI
- 172.4877
- Rent YoY
- ▲ 1.70%
- Metro
- Lawton, OK
- State GDP YoY
- ▲ 1.55%
- F500 in state
- 6
Industry mix (Fortune 500 HQ in OK)
| Industry | F500 HQs | Revenue |
|---|---|---|
| Energy | 3 | $48B |
|
||
Price history
+1275.0% since first listed13 events — show timeline
- 2026-06-16 Listed $165,000 LBRMLS
- 2022-09-21 Sold (Public Records) $142,500 Public Records
- 2022-09-19 Sold (MLS) $142,500 LBRMLS
- 2022-07-28 Listed $142,500 LBRMLS
- 2016-06-02 Sold (Public Records) $91,000 Public Records
- 2016-05-21 Sold (MLS) $91,000 LBRMLS
- 2015-09-16 Listed $99,700 LBRMLS
- 2007-06-26 Sold (Public Records) $118,500 Public Records
- 2005-04-21 Sold (Public Records) $102,000 Public Records
- 2002-07-28 Sold (Public Records) $89,000 Public Records
- 1998-12-02 Sold (Public Records) $79,500 Public Records
- 1997-08-04 Sold (Public Records) $83,500 Public Records
- 1993-03-16 Sold (Public Records) $12,000 Public Records
Property tax history
+4.2%/yrLatest (2025): $1,822 · +4.7% YoY. Source: county tax records.
Cash-flow waterfall
monthlySold comps — $/sqft
last 12 mo · ≤1 miLoading sold comps…