 🏷️ Likely Rental
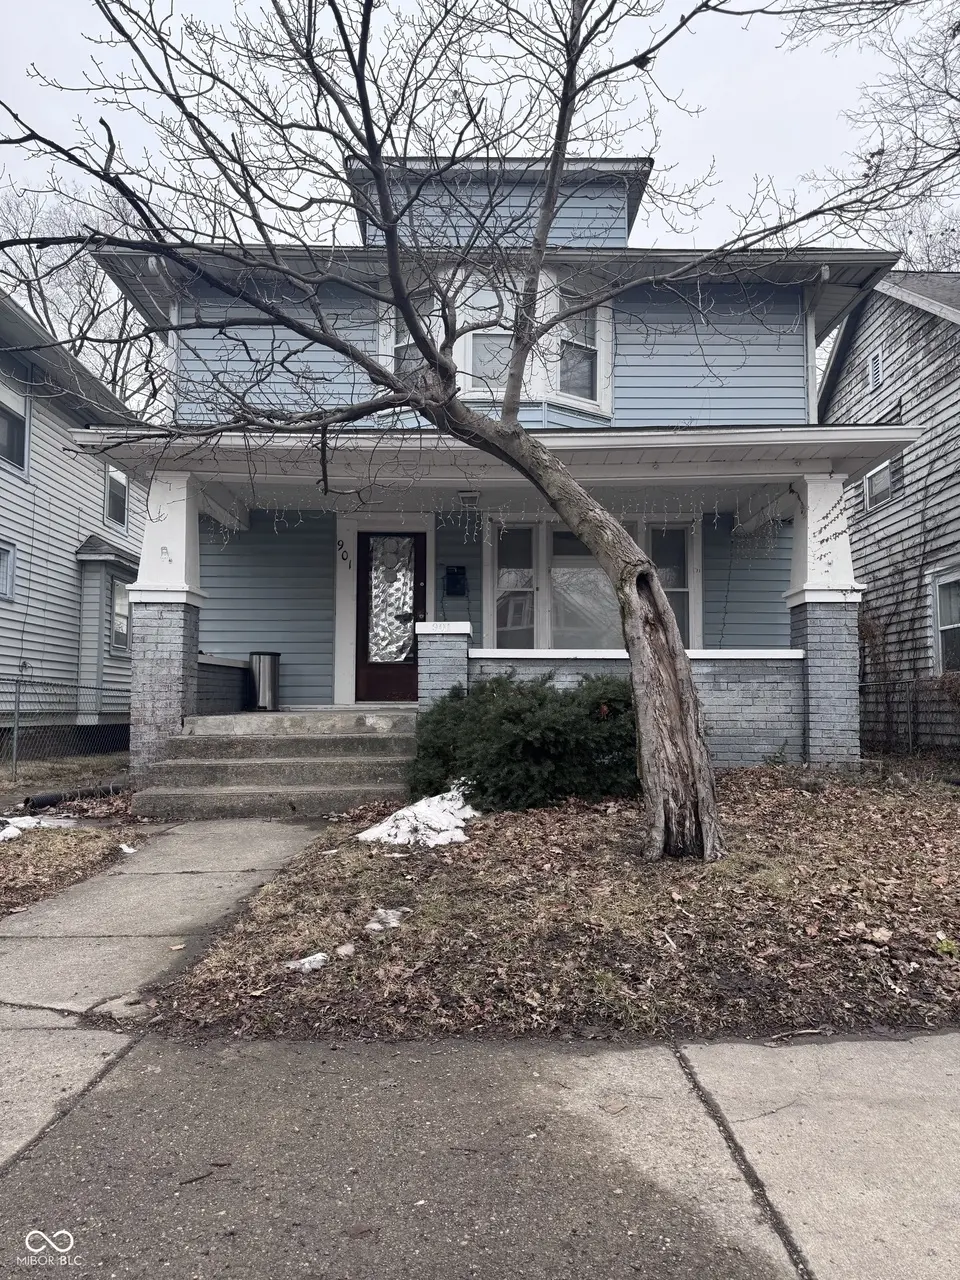
901 N Parker Ave · Indianapolis city (balance), IN
Flood risk 1/10 · Minimal
- FEMA flood zone
- X (unshaded)
- Chance of flooding over 30 yrs
- 0.0%
- Est. flood insurance / yr
- $473 – $860
Fire risk 1/10 · Minimal
- Est. fire insurance / yr
- $717 – $1,331
Heat risk 3/10 · Minor
- Hot days now (above 102°F)
- 7 days/yr
- Hot days in 30 yrs
- 19 days/yr
Wind risk 2/10 · Minimal
- Chance of severe wind over 30 yrs
- 1.0%
Air-quality risk 4/10 · Minor
- Unhealthy air days now
- 5 days/yr
- Unhealthy air days in 30 yrs
- 7 days/yr
Risk factors via First Street. Map © Google.
Why this score? — see what drove the B grade
The composite is a weighted blend of 9 inputs, each scored 0–100. Each bar is that input's sub-score; the figure is the points it added to the 100-point composite (weight × sub-score).
- Cash flow +27.2/30.0
- ARV discount +15.0/15.0
- DSCR +9.5/10.0
- 1% rule +8.1/10.0
- Rent growth +4.3/5.0
- Livability +2.5/5.0
- Condition / age +2.5/5.0
- Schools +1.4/10.0
- Appreciation +0.0/10.0
$150,000
🖨 Deal sheet (PDF) 📄 Offer letter ✓ Due diligence
Listing remarks MLS
RENTED FOR $1,600/MONTH, this Near Eastside single-family is generating income on day one with a lease in place through June 2026. A well-maintained 3-bed home just minutes from downtown Indianapolis - a straightforward, no-hassle addition to any rental portfolio.
Key facts
- 4,617 sq ft lot
- 2 garage spots
- Built 1910
Neighborhood map
What this means for you Summary
Snapshot
- This is a 5-bed/1.0-bath single-family listed at $150k.
Deal economics
- At list price, monthly cash flow is $431 ($5k/yr) — positive.
- The deal already cash-flows at list — no discount required.
- Meets the 1% rule at list price ($2k rent vs $150k).
- Recommended offer: $141k (6.0% below list) — sets the bar for market timing.
- Cap rate 9.7% vs local median 4.4% in Indianapolis city (balance) — top-decile yield for the area; either an underpriced asset or a hidden risk that comps aren't pricing in. Stress-test before assuming the spread holds.
Location & tenants
- Location reads: area grade B — affects rentability + tenant quality, not the cash-flow math above.
- Indianapolis Public Schools (urban): math 14% / reading 20% proficiency, ranked #286 of 301 in IN (top 95%) — low school quality limits family demand, transient renter base, plan for 1-2y turnover; 77% free/reduced lunch — lower-income household profile, screen leases tightly.
- Market conditions: Rents rising fast (+7.3%/yr); 483 active listings in the ZIP; 8 comparable units currently listed for rent nearby; rentals at typical pace (median 16d on market — plan ~3-4 weeks tenant-placement turnaround); 1,906 units permitted in Marion County in 2024 (621 in 5+ unit buildings).
- At $1,958/mo this rent would consume 48% of the median local household income ($49k/yr) (locally 1906% of renters already pay >50% of income on rent) — very limited rent-growth headroom before tenants either downsize or default.
Forward outlook
- Local home prices are declining (-3.0%/yr); year-one equity from $1k of loan paydown is wiped out by about $4k of value loss. Plan a longer hold.
- Marion County population projected at +18% by 2050 — long-run rental-demand tailwind backs the buy-and-hold thesis.
- At projected returns (-3.0% appreciation + 7.3% rent growth), your $42k cash investment doubles in ~7 years — after that, you're playing with house money.
Negotiation context
- It's been on market 68 days — a 6% lower offer ($141k) is reasonable based on typical stale-listing flexibility.
- 3 sale attempts since 4y ago; this cycle's ask has dropped $10k (6%) from the opening price — seller is motivated, your offer sets the floor, not the list.
Risks & watch-outs
- Watch-outs: built in 1910 — expect roof / HVAC / electrical / plumbing capex.
Questions for the listing agent
- It's been on market 68 days. Have you received any prior offers? Is the seller open to a 6% concession, seller financing, or rate buy-down credit?
- Built in 1910 — when were the roof, HVAC, electrical panel, plumbing, and water heater last replaced?
- Why hasn't it sold? Are there any deal-killer items the seller is aware of (foundation, flood, title, zoning, code violations)?
- Is there a deadline driving the sale (1031 exchange, divorce, estate, relocation)? That informs how much negotiation room exists.
- What's the average days-on-market for RENTAL listings here right now (not sales)? A rising rental-DOM trend means longer vacancies and softer asking-rent achievability than the comps imply.
- What's the recent tenant-quality profile in this submarket — average credit score on applications, eviction rate, late-payment / NSF rate, and stable-employment percentage? A property-management company in the area should have these aggregated.
- How much new for-sale + rental construction is in the pipeline within 1–3 miles? Heavy new supply typically softens prices + rents 12–24 months out; constrained supply supports both.
Investment metrics
- 1% rule
- 1.31% ✓
- Cap rate
- 9.74%
- Cash-on-cash
- 12.31%
- DSCR
- 1.55
- GRM
- 6.4
CMA / ARV
- ARV (median comp)
- $194,170
- List price
- $150,000
- Delta
- -22.75%
- Verdict
- UNDERPRICED
- Comps
- 20 within 1.0 mi
Show comp detail 6 sales within ~0.75 mi
| Address | Dist | Beds/Ba | Sqft | Sold | Price | $/sf | Match |
|---|---|---|---|---|---|---|---|
| 844 N Parker Ave | 0.04mi | 4/2.5 (-1) | 1,552 (-2%) | 14mo | $264,000 | $170 | 73 |
| 624 N Rural St | 0.24mi | 5/2.5 | 1,779 (+13%) | 17mo | $149,900 | $84 | 47 |
| 2919 E New York St | 0.55mi | 4/1.0 (-1) | 1,444 (-8%) | 16mo | $95,000 | $66 | 42 |
| 1215 N Ewing St | 0.59mi | 4/2.5 (-1) | 1,642 (+4%) | 16mo | $260,000 | $158 | 41 |
| 416 Eastern Ave | 0.48mi | 4/2.5 (-1) | 1,720 (+9%) | 16mo | $270,000 | $157 | 38 |
| 325 N Tacoma Ave | 0.57mi | 4/2.5 (-1) | 1,720 (+9%) | 21mo | $290,000 | $169 | 30 |
Match score weights: distance 35% · size 25% · config 20% · recency 20%. Top-matched comps best support the ARV.
Projected returns pro-forma
-3.0% appreciation · 7.31% rent growth · sell at horizon
- IRR
- 7.0%
- Equity multiple
- 1.29×
- Total profit
- $12,061
- Equity at exit
- $22,365
- IRR
- 20.0%
- Equity multiple
- 3.04×
- Total profit
- $85,877
- Equity at exit
- $12,969
Cash invested: $42,000 (down + closing). Projections, not guarantees.
Landlord ↔ Tenant lean methodology
- Overall (STATE)
- 90 Strongly Landlord-Friendly
- State Indiana
- 90 Strongly Landlord-Friendly · R+11
- County
- — inherits STATE
- City
- — inherits STATE
ZIP-level market 46201
- Home prices YoY
- -33.9%
- Rents YoY
- 7.3%
- Active inventory
- 483
- Price-to-rent
- 6.4×
Monthly cashflow live
- Estimated rent
- $1,958 high interval (Pro) →
- Mortgage (P&I)
- −$787
- Tax from tax record
- −$267 /mo · $3,201/yr
- Insurance
- −$62
- HOA
- −$0
- Vacancy / Maint / Mgmt
- −$411
- Net cashflow
- $431
Break-even live
Sensitivity live
| Price | -10% $516 | -5% $473 | +0% $431 | +5% $388 | +10% $346 |
|---|---|---|---|---|---|
| Rent | -10% $276 | -5% $353 | +0% $431 | +5% $508 | +10% $585 |
| Rate | -1.0pp $506 | -0.5pp $469 | base $431 | +0.5pp $392 | +1.0pp $352 |
UW: 25.0% down · 7.5% · 30yr · 1.5% tax · 5.0% vac · 8.0% maint · 8.0% mgmt
Financing live
Cash to close
- Down payment
- $37,500
- Closing costs
- $4,500
- Reserves months
- —
- Total cash needed
- —
Loan-product check · same deal, 3 products live
Conventional
25% down · 7.5% · 30yr
- Down + closing
- —
- Monthly P&I
- —
- Monthly cashflow
- —
- DSCR
- —
- Eligible?
- —
Personal DTI + credit; lowest rate.
DSCR
20% down · 8.5% · 30yr
- Down + closing
- —
- Monthly P&I
- —
- Monthly cashflow
- —
- DSCR
- —
- Eligible?
- —
No personal income docs; deal must DSCR.
Hard money
10% down · 12.0% · 12mo
- Down + closing
- —
- Monthly P&I
- —
- Monthly cashflow
- —
- DSCR
- —
- Eligible?
- —
Short-term bridge; refi at stabilization.
Rent comps 8 comps
| Address | Beds | Baths | Sqft | Rent | $/sqft | DOM | Units | Dist |
|---|---|---|---|---|---|---|---|---|
| 849 N Oakland Ave Indianapolis, IN | 4.0 | 3.0 | 1638 | $2,350 | $1.43 | 13d | 1 | 0.09mi |
| 1036 N Parker Ave Indianapolis, IN | 4.0 | 2.0 | 1342 | $1,745 | $1.30 | 5d | 1 | 0.16mi |
| 1038 N Parker Ave Indianapolis, IN | 4.0 | 2.0 | 1342 | $1,745 | $1.30 | 5d | 1 | 0.17mi |
| 645 N Oxford St Indianapolis, IN | 4.0 | 1.5 | 1344 | $1,500 | $1.12 | 24d | 1 | 0.18mi |
| 210 N Keystone Ave Indianapolis, IN | 4.0 | 2.0 | 2024 | $2,200 | $1.09 | 8d | 1 | 0.81mi |
| 3710 E Market St Indianapolis, IN | 6.0 | 1.0 | 1232 | $1,450 | $1.18 | 15d | 1 | 0.83mi |
| 2224 Langley Ave Indianapolis, IN | 4.0 | 2.0 | 1513 | $1,595 | $1.05 | 44d | 1 | 1.00mi |
| 29 N Walcott St Indianapolis, IN | 4.0 | 3.0 | 2200 | $2,400 | $1.09 | 44d | 1 | 1.19mi |
Listing history 20 events
-
2026-06-21days on market $150,000 Active 68 DOM
-
2026-06-18days on market $150,000 Active 65 DOM
-
2026-06-17days on market $150,000 Active 64 DOM
-
2026-06-16days on market $150,000 Active 63 DOM
-
2026-06-15days on market $150,000 Active 62 DOM
-
2026-06-13days on market $150,000 Active 60 DOM
-
2026-06-13days on market $150,000 Active 59 DOM
-
2026-06-09days on market $150,000 Active 56 DOM
-
2026-06-08days on market $150,000 Active 55 DOM
-
2026-06-07days on market $150,000 Active 54 DOM
-
2026-06-03days on market $150,000 Active 50 DOM
-
2026-06-02days on market $150,000 Active 49 DOM
-
2026-06-01days on market $150,000 Active 48 DOM
-
2026-05-31days on market $150,000 Active 47 DOM
-
2026-05-14status Active 264-char remark
Show marketing remark (264 chars)
RENTED FOR $1,600/MONTH, this Near Eastside single-family is generating income on day one with a lease in place through June 2026. A well-maintained 3-bed home just minutes from downtown Indianapolis - a straightforward, no-hassle addition to any rental portfolio.
-
2026-05-01status Pending 264-char remark
Show marketing remark (264 chars)
RENTED FOR $1,600/MONTH, this Near Eastside single-family is generating income on day one with a lease in place through June 2026. A well-maintained 3-bed home just minutes from downtown Indianapolis - a straightforward, no-hassle addition to any rental portfolio.
-
2026-04-01$160,000 Active 264-char remark
Show marketing remark (264 chars)
RENTED FOR $1,600/MONTH, this Near Eastside single-family is generating income on day one with a lease in place through June 2026. A well-maintained 3-bed home just minutes from downtown Indianapolis - a straightforward, no-hassle addition to any rental portfolio.
-
2023-06-11historical
-
2022-12-10historical
-
2022-10-13$190,000 Active
ⓘ Source: listings_history table (triggers on properties + properties_extension) + one-shot
backfill from property_details.listing_events for pre-trigger history.
Tax reassessment forecast IN · Partial reset (capped growth)
- Current annual tax
- $3,201 · $267/mo
- Projected year-2 tax
- $3,201 · $267/mo
- Expected delta
- $0/yr ($0/mo · 0.0%)
ⓘ Screening estimate from a state-policy table — verify with the county assessor before closing.
Climate risk First Street
- Flood 1/10 Low FEMA zone X (unshaded) · 0% chance over 30 yrs
- Wildfire 1/10 Low
- Heat 3/10 Moderate 7 d/yr ≥102°F today · 19 d/yr by 30 yrs out
- Wind 2/10 Low 100% chance of damaging wind over 30 yrs
- Air quality 4/10 Moderate 5 unhealthy d/yr today · 7 by 30 yrs out
Nearby sold comps map
Loading sold comps map…
Walkable amenities ~0.75 mi
Loading nearby amenities…
Taxation est. · year 1
- Rental income
- $23,493
- − Mortgage interest
- −$8,402
- − Property taxes
- −$3,201
- − Insurance
- −$750
- − Repairs & maintenance
- −$1,879
- − Management
- −$1,879
- − Depreciation
- −$4,364
- Taxable income
- $3,016
- Est. tax owed @ 24.0%
- −$724
- After-tax cash flow
- $4,444/yr
For passive investors: Depreciation is non-cash, so a rental often shows a tax loss while cash-flowing — sheltering income. Rental losses are passive: they offset passive income freely, and up to $25,000/yr can offset ordinary (W-2) income if you actively participate and your MAGI is under $100k (phasing out to $0 by $150k); unused losses carry forward. On sale, claimed depreciation is recaptured at up to 25%, and gains may owe capital-gains tax (a 1031 exchange can defer both). Figures are a year-1 estimate at your 24.0% rate — not tax advice; consult a CPA.
Schools (NCES district)
- District
- Indianapolis Public Schools
- NCES district ID
- 1804770
- Math proficiency
- 14% ▼ -7.00%
- Reading proficiency
- 20% ▼ -3.00%
- Median HH income
- $32,034
- Composite
- 13.69/100
- National rank
- #9499
- State rank
- #286 of 301 in IN
Livability — Indianapolis city (balance)
No livability data for this city. (Only ~50 U.S. cities are tracked.)
Census & demographics
- Census place
- Indianapolis city (balance), IN
- County
- Marion County · 998,460 people
- City population
- 881,119
- Metro
- Indianapolis-Carmel-Anderson, IN
- Population (ZIP)
- 30,335
- Household income
- $49,195
- Rent vs Own
- Severe rent burden
- 1906.0
Population outlook (Marion County) Hauer SSP2
- Today (2025)
- 1,025,572 people
- By 2030
- 1,065,727 · +3.9%
- By 2040
- 1,141,577 · +11.3%
- By 2050
- 1,208,920 · +17.9%
- By 2075
- 1,367,288 · +33.3%
- By 2100
- 1,438,201 · +40.2%
Race, ethnicity, and origin ACS 2023
- Neighborhood character
- Diverse neighborhood (Simpson 0.63)
- Race & ethnicity
- White 53% Hispanic / Latino 23% Black 18% Two or more races 9%
- Hispanic origin (detail)
- Mexican 14% Puerto Rican 2%
- Common ancestry
- Slovak 2% Lithuanian 2% Italian 1%
- Foreign-born
- 9% · Canada
- Languages at home
- 81% English-only · Spanish 17%
Political lean MEDSL · Marion
- 2024 margin
- Strong D (+27.7) · D 63.0% · R 35.3% · Other 1.7%
- 2008→2024 swing
- -0.7pp no change · 2008: 28.4pp · 2024: 27.7pp
- All cycles
- 2024: D+27.7 2020: D+29.1 2016: D+22.8 2012: D+22.2 2008: D+28.4
Not yet ingested
- Civics
- —
Market trends
- HPI YoY
- ▼ -192.51%
- Current HPI
- 375.0969
- Rent YoY
- ▲ 7.31%
- Metro
- Indianapolis-Carmel-Anderson, IN
- State GDP YoY
- ▲ 2.90%
- F500 in state
- 18
Industry mix (Fortune 500 HQ in IN)
| Industry | F500 HQs | Revenue |
|---|---|---|
| Industrial Machinery | 2 | $37B |
|
||
| Healthcare | 1 | $177B |
|
||
| Pharmaceuticals | 1 | $45B |
|
||
| Metals / Steel | 1 | $18B |
|
||
| Agriculture | 1 | $17B |
|
||
| Packaging | 1 | $12B |
|
||
Price history
-15.8% since first listed6 events — show timeline
- 2026-05-14 Relisted — MIBOR as Distributed by MLS Grid
- 2026-05-01 Pending — MIBOR as Distributed by MLS Grid
- 2026-04-01 Listed $160,000 MIBOR as Distributed by MLS Grid
- 2023-06-11 Rental Removed — RENT.
- 2022-12-10 Listing Removed — MIBOR as Distributed by MLS Grid
- 2022-10-13 Listed $190,000 MIBOR as Distributed by MLS Grid
Property tax history
+11.2%/yrLatest (2025): $3,201 · +40.7% YoY. Source: county tax records.
Cash-flow waterfall
monthlySold comps — $/sqft
last 12 mo · ≤1 miLoading sold comps…