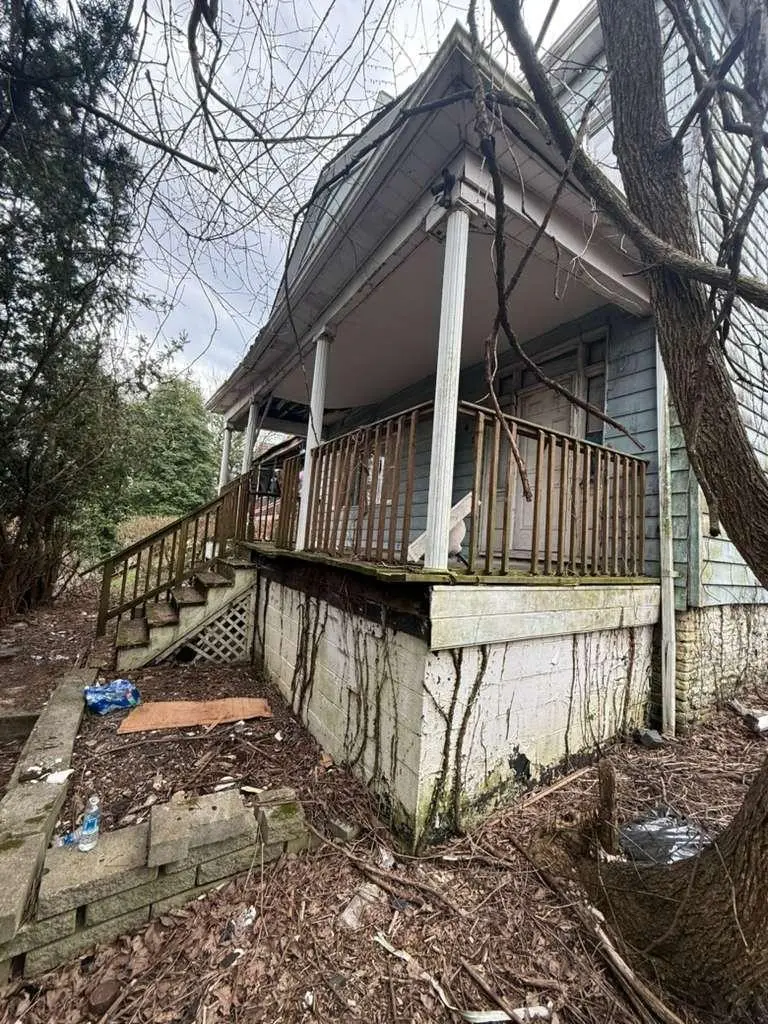
419 Prospect Ave · Donora, PA
Flood risk 1/10 · Minimal
- FEMA flood zone
- X (unshaded)
- Chance of flooding over 30 yrs
- 0.0%
- Est. flood insurance / yr
- $473 – $860
Fire risk 1/10 · Minimal
- Est. fire insurance / yr
- $511 – $949
Heat risk 4/10 · Minor
- Hot days now (above 98°F)
- 7 days/yr
- Hot days in 30 yrs
- 19 days/yr
Wind risk 2/10 · Minimal
- Chance of severe wind over 30 yrs
- —
Air-quality risk 2/10 · Minimal
- Unhealthy air days now
- 1 days/yr
- Unhealthy air days in 30 yrs
- 2 days/yr
Risk factors via First Street. Map © Google.
Why this score? — see what drove the C- grade
The composite is a weighted blend of 9 inputs, each scored 0–100. Each bar is that input's sub-score; the figure is the points it added to the 100-point composite (weight × sub-score).
- Cash flow +15.0/30.0
- ARV discount +7.5/15.0
- Appreciation +7.5/10.0
- 1% rule +5.0/10.0
- DSCR +5.0/10.0
- Livability +3.2/5.0
- Rent growth +2.5/5.0
- Condition / age +2.5/5.0
- Schools +2.4/10.0
$15,400
🖨 Deal sheet 📄 Offer letter ✓ Due diligence
Listing remarks MLS
Buyer responsible for all insp/permits, subject to corp approval, free appraisal & credit report if financed thru Countrywide, prequal from Countrywide w/ all offers
Key facts
- 3,815 sq ft lot
- Built 1910
- Listed 49 days
Property features AI
Finance
- Financial info: Assessed value $13,400; Annual tax amount $387
Exterior
- Parking: On-street parking
- Home design: 3-story building; Resale property
- Exterior features: On-street parking
Interior
- Bathrooms: 3 full bathrooms
- Interior features: Unfinished basement
Neighborhood map
What this means for you Summary
Snapshot
- This is a 4-bed/1.0-bath single-family listed at $15k.
Deal economics
- At list price, monthly cash flow is $919 ($11k/yr) — positive.
- The deal already cash-flows at list — no discount required.
- Meets the 1% rule at list price ($1k rent vs $15k).
- Recommended offer: $15k (3.0% below list) — sets the bar for market timing.
Location & tenants
- Location reads 64/100 on livability (#1,198 in PA) — a middle-class / working-renter tenant base. Strengths: cost of living A+, housing A+, crime A-; Watch: health & safety D, schools F, amenities F.
- Ringgold SD (suburban): math 19% / reading 36% proficiency, ranked #452 of 539 in PA (top 84%) — low school quality limits family demand, transient renter base, plan for 1-2y turnover.
- Market conditions: 21 active listings in the ZIP; lower-income renter base — watch delinquency; 489 units permitted in Washington County in 2024 (30 in 5+ unit buildings).
- This rent runs 40% of the median local income ($40k/yr) — at the standard rent-burdened threshold; future hikes will face affordability resistance.
Forward outlook
- In year one you build about $881 of equity ($106 loan paydown + $775 appreciation (5.0% local appreciation)).
- Washington County population projected to shrink 6% by 2050 — rents likely to lag national; underwrite the cash flow, not the appreciation.
- At projected returns (5.0% appreciation + 3.0% rent growth), your $4k cash investment doubles in ~1 year — after that, you're playing with house money.
Negotiation context
- It's been on market 49 days — a 3% lower offer ($15k) is reasonable based on typical stale-listing flexibility.
- 2 sale attempts since 21y ago; this cycle's ask has dropped $9k (38%) from the opening price — seller is motivated, your offer sets the floor, not the list.
- Current owner paid $1k; list at $15k implies a 1440% gain — meaningful room to come down on a strong offer.
Risks & watch-outs
- Watch-outs: property tax is 2.5% of price; built in 1910 — expect roof / HVAC / electrical / plumbing capex.
Questions for the listing agent
- It's been on market 49 days. Have you received any prior offers? Is the seller open to a 3% concession, seller financing, or rate buy-down credit?
- Built in 1910 — when were the roof, HVAC, electrical panel, plumbing, and water heater last replaced?
- Property tax is high relative to price — has the assessment been appealed recently, and will the sale trigger a re-assessment?
- Is there a deadline driving the sale (1031 exchange, divorce, estate, relocation)? That informs how much negotiation room exists.
- Schools are F-rated, which usually means shorter tenancies and higher turnover. Who's the typical renter profile here, and what's been the actual vacancy rate?
- What's the average days-on-market for RENTAL listings here right now (not sales)? A rising rental-DOM trend means longer vacancies and softer asking-rent achievability than the comps imply.
- What's the recent tenant-quality profile in this submarket — average credit score on applications, eviction rate, late-payment / NSF rate, and stable-employment percentage? A property-management company in the area should have these aggregated.
- How much new for-sale + rental construction is in the pipeline within 1–3 miles? Heavy new supply typically softens prices + rents 12–24 months out; constrained supply supports both.
Investment metrics
- 1% rule
- 8.54% ✓
- Cap rate
- 77.91%
- Cash-on-cash
- 255.79%
- DSCR
- 12.38
- GRM
- 1.0
CMA / ARV
- ARV (on-the-fly)
- $58,624
- Comps found
- 12
Show comp detail 12 sales within ~0.75 mi
| Address | Dist | Beds/Ba | Sqft | Sold | Price | $/sf | Match |
|---|---|---|---|---|---|---|---|
| 106 Castner Ave | 0.30mi | 3/2.0 (-1) | 1,775 (-3%) | 0mo | $92,000 | $52 | 72 |
| 832 Thompson | 0.37mi | 3/1.0 (-1) | 1,925 (+5%) | 3mo | $55,000 | $29 | 67 |
| 438 8th St | 0.30mi | 4/1.5 | 1,712 (-7%) | 7mo | $35,000 | $20 | 67 |
| 74 Castner Ave | 0.36mi | 3/2.0 (-1) | 1,882 (+3%) | 4mo | $20,000 | $11 | 66 |
| 950-952 Heslep Ave | 0.46mi | 4/1.0 | 1,826 (-0%) | 18mo | $5,000 | $3 | 63 |
| 409 Prospect Ave | 0.02mi | 3/2.0 (-1) | 1,678 (-8%) | 16mo | $15,000 | $9 | 62 |
| 107 Mckean Ave | 0.24mi | 3/1.5 (-1) | 1,781 (-3%) | 22mo | $80,000 | $45 | 59 |
| 432 Fourth St | 0.11mi | 5/2.0 (+1) | 2,100 (+15%) | 13mo | $67,900 | $32 | 51 |
| 519 Mccrea Ave | 0.41mi | 3/1.0 (-1) | 1,720 (-6%) | 20mo | $136,000 | $79 | 48 |
| 215 S Allen Ave | 0.60mi | 4/2.0 | 1,924 (+5%) | 14mo | $134,900 | $70 | 48 |
| 83 Castner Ave | 0.36mi | 3/1.5 (-1) | 2,006 (+10%) | 15mo | $130,000 | $65 | 48 |
| 218 10th St | 0.53mi | 4/2.5 | 2,004 (+9%) | 22mo | $55,000 | $27 | 36 |
Match score weights: distance 35% · size 25% · config 20% · recency 20%. Top-matched comps best support the ARV.
Projected returns pro-forma
5.03% appreciation · 3.0% rent growth · sell at horizon
- IRR
- —
- Equity multiple
- 15.41×
- Total profit
- $62,143
- Equity at exit
- $8,754
- IRR
- —
- Equity multiple
- 32.84×
- Total profit
- $137,291
- Equity at exit
- $15,131
Cash invested: $4,312 (down + closing). Projections, not guarantees.
Landlord ↔ Tenant lean methodology
- Overall (STATE)
- 62 Landlord-Friendly
- State Pennsylvania
- 62 Landlord-Friendly · EVEN
- County
- — inherits STATE
- City
- — inherits STATE
ZIP-level market 15033
- Home prices YoY
- 4.8%
- Active inventory
- 21
- Price-to-rent
- 1.0×
Monthly cashflow live
- Estimated rent
- $1,315 medium interval (Pro) →
- Mortgage (P&I)
- −$81
- Tax from tax record
- −$32 /mo · $387/yr
- Insurance
- −$6
- HOA
- −$0
- Vacancy / Maint / Mgmt
- −$276
- Net cashflow
- $919
Break-even live
UW: 25.0% down · 7.5% · 30yr · 1.5% tax · 5.0% vac · 8.0% maint · 8.0% mgmt
Financing live
Cash to close
- Down payment
- $3,850
- Closing costs
- $462
- Reserves months
- —
- Total cash needed
- —
Loan-product check · same deal, 3 products live
Conventional
25% down · 7.5% · 30yr
- Down + closing
- —
- Monthly P&I
- —
- Monthly cashflow
- —
- DSCR
- —
- Eligible?
- —
Personal DTI + credit; lowest rate.
DSCR
20% down · 8.5% · 30yr
- Down + closing
- —
- Monthly P&I
- —
- Monthly cashflow
- —
- DSCR
- —
- Eligible?
- —
No personal income docs; deal must DSCR.
Hard money
10% down · 12.0% · 12mo
- Down + closing
- —
- Monthly P&I
- —
- Monthly cashflow
- —
- DSCR
- —
- Eligible?
- —
Short-term bridge; refi at stabilization.
Listing history 23 events
-
2026-06-18days on market $15,400 Active 49 DOM
-
2026-06-17days on market $15,400 Active 48 DOM
-
2026-06-16days on market $15,400 Active 47 DOM
-
2026-06-15days on market $15,400 Active 46 DOM
-
2026-06-13days on market $15,400 Active 44 DOM
-
2026-06-13pricedays on market $15,400 Active 43 DOM
-
2026-06-09days on market $19,400 Active 40 DOM
-
2026-06-08days on market $19,400 Active 39 DOM
-
2026-06-07days on market $19,400 Active 38 DOM
-
2026-06-05days on market $19,400 Active 35 DOM
-
2026-06-03days on market $19,400 Active 34 DOM
-
2026-06-02days on market $19,400 Active 33 DOM
-
2026-06-01days on market $19,400 Active 32 DOM
-
2026-05-31days on market $19,400 Active 31 DOM
-
2026-05-15price $19,400 499-char remark
-
2026-04-29$24,700 Active 499-char remark
-
2012-09-13soldstatus $1,000
-
2006-04-05soldstatus $24,900
-
2006-01-23soldstatus $14,400
-
2005-11-10soldstatus $7,050
-
2005-10-12soldstatus $7,050 171-char remark
Show marketing remark (171 chars)
Buyer responsible for all insp/permits, subject to corp approval, free appraisal & credit report if financed thru Countrywide, prequal from Countrywide w/ all offers
-
2005-07-26$9,900 171-char remark
Show marketing remark (171 chars)
Buyer responsible for all insp/permits, subject to corp approval, free appraisal & credit report if financed thru Countrywide, prequal from Countrywide w/ all offers
-
1994-07-26soldstatus $34,000
ⓘ Source: listings_history table (triggers on properties + properties_extension) + one-shot
backfill from property_details.listing_events for pre-trigger history.
Tax reassessment forecast PA · Partial reset (capped growth)
- Current annual tax
- $387 · $32/mo
- Projected year-2 tax
- $387 · $32/mo
- Expected delta
- $0/yr ($0/mo · 0.0%)
ⓘ Screening estimate from a state-policy table — verify with the county assessor before closing.
Climate risk First Street
- Flood 1/10 Low FEMA zone X (unshaded) · 0% chance over 30 yrs
- Wildfire 1/10 Low
- Heat 4/10 Moderate 7 d/yr ≥98°F today · 19 d/yr by 30 yrs out
- Wind 2/10 Low
- Air quality 2/10 Low 1 unhealthy d/yr today · 2 by 30 yrs out
Nearby sold comps map
Loading sold comps map…
Walkable amenities ~0.75 mi
Loading nearby amenities…
Taxation est. · year 1
- Rental income
- $15,776
- − Mortgage interest
- −$863
- − Property taxes
- −$387
- − Insurance
- −$77
- − Repairs & maintenance
- −$1,262
- − Management
- −$1,262
- − Depreciation
- −$448
- Taxable income
- $11,477
- Est. tax owed @ 24.0%
- −$2,754
- After-tax cash flow
- $8,275/yr
For passive investors: Depreciation is non-cash, so a rental often shows a tax loss while cash-flowing — sheltering income. Rental losses are passive: they offset passive income freely, and up to $25,000/yr can offset ordinary (W-2) income if you actively participate and your MAGI is under $100k (phasing out to $0 by $150k); unused losses carry forward. On sale, claimed depreciation is recaptured at up to 25%, and gains may owe capital-gains tax (a 1031 exchange can defer both). Figures are a year-1 estimate at your 24.0% rate — not tax advice; consult a CPA.
Schools (NCES district)
- District
- Ringgold SD
- NCES district ID
- 4220400
- Math proficiency
- 19% ▼ -20.00%
- Reading proficiency
- 36% ▼ -18.00%
- Median HH income
- $46,754
- Composite
- 23.75/100
- National rank
- #7819
- State rank
- #452 of 539 in PA
Livability — Donora
- Score
- 64/100
- State rank
- #1198
- US rank
- #14079
Category grades
Schools grade is shown separately in the Schools card above.
Census & demographics
- Census place
- Donora, PA
- County
- Washington County · 106,469 people
- City population
- 4,572
- Metro
- Pittsburgh, PA
- Population (ZIP)
- 4,572
- Household income
- $39,921
- Rent vs Own
- Severe rent burden
- 363.0
Population outlook (Washington County) Hauer SSP2
- Today (2025)
- 208,060 people
- By 2030
- 207,168 · -0.4%
- By 2040
- 202,738 · -2.6%
- By 2050
- 195,269 · -6.1%
- By 2075
- 175,588 · -15.6%
- By 2100
- 145,827 · -29.9%
Race, ethnicity, and origin ACS 2023
- Neighborhood character
- Predominantly White (73%)
- Race & ethnicity
- White 73% Black 16% Two or more races 9% Hispanic / Latino 3%
- Common ancestry
- Scotch-Irish 5% Romanian 5% Subsaharan African 1%
- Foreign-born
- 1%
Political lean MEDSL · Washington
- 2024 margin
- Strong R (+25.5) · D 36.9% · R 62.4%
- 2008→2024 swing
- -20.8pp toward R · 2008: -4.7pp · 2024: -25.5pp
- All cycles
- 2024: R+25.5 2020: R+22.8 2016: R+25.3 2012: R+13.3 2008: R+4.7
Not yet ingested
- Civics
- —
Market trends
- HPI YoY
- ▲ 5.03%
- Current HPI
- 110.5976
- Rent YoY
- —
- Metro
- Pittsburgh, PA
- State GDP YoY
- ▲ 1.68%
- F500 in state
- 34
Industry mix (Fortune 500 HQ in PA)
| Industry | F500 HQs | Revenue |
|---|---|---|
| Healthcare | 2 | $309B |
|
||
| Insurance | 2 | $27B |
|
||
| Telecommunications / Media | 1 | $124B |
|
||
| Industrial Distribution | 1 | $22B |
|
||
| Financial Services | 1 | $20B |
|
||
| Chemicals / Materials | 1 | $18B |
|
||
Price history
-54.7% since first listed10 events — show timeline
- 2026-06-11 Price Changed $15,400 West Penn MLS
- 2026-05-15 Price Changed $19,400 West Penn MLS
- 2026-04-29 Listed $24,700 West Penn MLS
- 2012-09-13 Sold (Public Records) $1,000 Public Records
- 2006-04-05 Sold (Public Records) $24,900 Public Records
- 2006-01-23 Sold (Public Records) $14,400 Public Records
- 2005-11-10 Sold (Public Records) $7,050 Public Records
- 2005-10-12 Sold (MLS) $7,050 West Penn MLS
- 2005-07-26 Listed $9,900 West Penn MLS
- 1994-07-26 Sold (Public Records) $34,000 Public Records
Property tax history
-8.6%/yrLatest (2026): $387 · +2.8% YoY. Source: county tax records.
Cash-flow waterfall
monthlySold comps — $/sqft
last 12 mo · ≤1 miLoading sold comps…