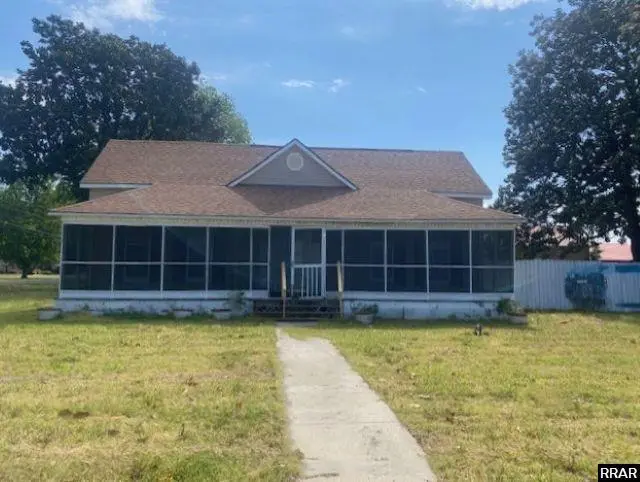
15 Sunkist Beach Rd Rd · Tiptonville, TN
Flood risk 1/10 · Minimal
- FEMA flood zone
- X (unshaded)
- Chance of flooding over 30 yrs
- 0.0%
- Est. flood insurance / yr
- $507 – $1,088
Fire risk 1/10 · Minimal
- Est. fire insurance / yr
- $949 – $1,763
Heat risk 6/10 · Moderate
- Hot days now (above 108°F)
- 7 days/yr
- Hot days in 30 yrs
- 21 days/yr
Wind risk 4/10 · Minor
- Chance of severe wind over 30 yrs
- 9.0%
Air-quality risk 2/10 · Minimal
- Unhealthy air days now
- 0 days/yr
- Unhealthy air days in 30 yrs
- 1 days/yr
Risk factors via First Street. Map © Google.
Why this score? — see what drove the D grade
The composite is a weighted blend of 9 inputs, each scored 0–100. Each bar is that input's sub-score; the figure is the points it added to the 100-point composite (weight × sub-score).
- Cash flow +13.8/30.0
- ARV discount +7.5/15.0
- Appreciation +6.0/10.0
- DSCR +4.2/10.0
- 1% rule +3.2/10.0
- Livability +2.9/5.0
- Rent growth +2.5/5.0
- Condition / age +2.5/5.0
- Schools +1.0/10.0
$146,300
🖨 Deal sheet (PDF) 📄 Offer letter ✓ Due diligence
Listing remarks
Just Listed!! This Home Is Very Appealing In Many Ways!! Home Has 2-3 Bedrooms, 2 Baths, Kitchen Has Plenty Of Counter/Cabinet Space, Enclosed Front Porch. There Is A Bunk House With 2 Baths, & Kitchen Area. All Of This Sits On A Large Corner Lot Size & Priced To Sell! Located Not Far From The Lake. Everyday At This Home Could Be Your Vacation. All offers must be submitted at www. vrmproperties.com. Agents must register as a User, enter the property address, and click on "Start Offer".
Key facts
- Large corner lot
- Bunk house
- Enclosed front porch
Tags
Property features AI
Finance
- Other: Listing broker: THE GINA MILLER REALTY COMPANY
Exterior
- Parking: 1-car garage
- Utilities: Public water; Public sewer
- Home design: Single-family residence; Residential property
- Exterior features: Paved road access; Lot of approximately 1.32 acres
Interior
- Flooring: Carpet; Vinyl
- Bathrooms: 2 full bathrooms
- Heating & cooling: Natural gas heating; Central air conditioning
- Interior features: Carpet and vinyl flooring; Crawl space basement
Neighborhood map
What this means for you Summary
Snapshot
- This is a 3-bed/1.0-bath single-family listed at $146k.
Deal economics
- At list price, monthly cash flow is $14 ($173/yr) — positive.
- The deal already cash-flows at list — no discount required.
- To meet the 1% rule (rent ≥ 1% of price), the offer needs to be $120k (18.2% below list).
- Recommended offer: $120k (18.2% below list) — sets the bar for 1% rule.
Location & tenants
- Location reads 58/100 on livability (#302 in TN) — a working-class tenant base; expect higher turnover. Strengths: cost of living A+, crime A, housing A; Watch: health & safety C-, amenities F, commute F.
- Lake County (rural): math 11% / reading 14% proficiency, ranked #135 of 139 in TN (top 97%) — low school quality limits family demand, transient renter base, plan for 1-2y turnover; 71% free/reduced lunch — lower-income household profile, screen leases tightly.
- Zoned schools: Margaret Newton Elementary (210 students, 0% FRL); Lara Kendall Elementary (math 12% / reading 12%, grade F, #242 of 333 statewide, top 74%, 340 students, 0% FRL); Lake Co High School (math 5% / reading 24%, grade F, #237 of 332 statewide, top 75%, 199 students, 0% FRL) — zoned schools average 0% FRL vs 71% district-wide (71 pts lower); this property's tenant base skews higher-income than the district average.
- Market conditions: 32 active listings in the ZIP; 3 units permitted in Lake County in 2024 (0 in 5+ unit buildings).
Forward outlook
- In year one you build about $4k of equity ($1k loan paydown + $3k appreciation (2.0% local appreciation)).
- Lake County population projected to shrink 8% by 2050 — rents likely to lag national; underwrite the cash flow, not the appreciation.
- At projected returns (2.0% appreciation + 3.0% rent growth), your $41k cash investment doubles in ~8 years — after that, you're playing with house money.
- By year 9, paydown + projected appreciation supports a ~$34k cash-out refi (75% LTV) — recoverable capital for the next deal without selling this one.
Negotiation context
- It's been on market 21 days — a 2% lower offer ($144k) is reasonable based on typical stale-listing flexibility.
- 2 sale attempts since 3y ago with the ask held roughly flat each time — persistent listings suggest the price (not the market) is what's stuck; bring a comps-based counter.
- Current owner paid $66k; list at $146k implies a 122% gain — meaningful room to come down on a strong offer.
Risks & watch-outs
- Climate carrying-cost: extreme-heat days projected 7→21/yr by 2055 (HVAC capex compounding) — expect insurance premiums to compound above CPI over the hold.
Questions for the listing agent
- Built in 1972 — when were the roof, HVAC, electrical panel, plumbing, and water heater last replaced?
- Is there a deadline driving the sale (1031 exchange, divorce, estate, relocation)? That informs how much negotiation room exists.
- Schools are F-rated, which usually means shorter tenancies and higher turnover. Who's the typical renter profile here, and what's been the actual vacancy rate?
- The area grade is low — what's the realistic commute time and amenity access for the typical tenant pool here? Any planned neighborhood developments (good or bad) we should know about?
- What's the average days-on-market for RENTAL listings here right now (not sales)? A rising rental-DOM trend means longer vacancies and softer asking-rent achievability than the comps imply.
- What's the recent tenant-quality profile in this submarket — average credit score on applications, eviction rate, late-payment / NSF rate, and stable-employment percentage? A property-management company in the area should have these aggregated.
- How much new for-sale + rental construction is in the pipeline within 1–3 miles? Heavy new supply typically softens prices + rents 12–24 months out; constrained supply supports both.
Investment metrics
- 1% rule
- 0.82% ✗
- Cap rate
- 6.41%
- Cash-on-cash
- 0.42%
- DSCR
- 1.02
- GRM
- 10.2
CMA / ARV
No comps found within radius.
Projected returns pro-forma
2.02% appreciation · 3.0% rent growth · sell at horizon
- IRR
- 5.0%
- Equity multiple
- 1.27×
- Total profit
- $11,083
- Equity at exit
- $57,878
- IRR
- 8.6%
- Equity multiple
- 2.17×
- Total profit
- $47,770
- Equity at exit
- $83,478
Cash invested: $40,964 (down + closing). Projections, not guarantees.
Landlord ↔ Tenant lean methodology
- Overall (STATE)
- 87 Strongly Landlord-Friendly
- State Tennessee
- 87 Strongly Landlord-Friendly · R+13
- County
- — inherits STATE
- City
- — inherits STATE
ZIP-level market 38079
- Home prices YoY
- 1.1%
- Active inventory
- 32
- Price-to-rent
- 10.2×
Monthly cashflow live
- Estimated rent
- $1,197 medium interval (Pro) →
- Mortgage (P&I)
- −$767
- Tax from tax record
- −$103 /mo · $1,240/yr
- Insurance
- −$61
- HOA
- −$0
- Vacancy / Maint / Mgmt
- −$251
- Net cashflow
- $14
Break-even live
Sensitivity live
| Price | -10% $97 | -5% $56 | +0% $14 | +5% $-27 | +10% $-68 |
|---|---|---|---|---|---|
| Rent | -10% $-80 | -5% $-33 | +0% $14 | +5% $62 | +10% $109 |
| Rate | -1.0pp $88 | -0.5pp $52 | base $14 | +0.5pp $-23 | +1.0pp $-62 |
UW: 25.0% down · 7.5% · 30yr · 1.5% tax · 5.0% vac · 8.0% maint · 8.0% mgmt
Financing live
Cash to close
- Down payment
- $36,575
- Closing costs
- $4,389
- Reserves months
- —
- Total cash needed
- —
Loan-product check · same deal, 3 products live
Conventional
25% down · 7.5% · 30yr
- Down + closing
- —
- Monthly P&I
- —
- Monthly cashflow
- —
- DSCR
- —
- Eligible?
- —
Personal DTI + credit; lowest rate.
DSCR
20% down · 8.5% · 30yr
- Down + closing
- —
- Monthly P&I
- —
- Monthly cashflow
- —
- DSCR
- —
- Eligible?
- —
No personal income docs; deal must DSCR.
Hard money
10% down · 12.0% · 12mo
- Down + closing
- —
- Monthly P&I
- —
- Monthly cashflow
- —
- DSCR
- —
- Eligible?
- —
Short-term bridge; refi at stabilization.
Listing history 16 events
-
2026-06-22days on market $146,300 Active 21 DOM
-
2026-06-21days on market $146,300 Active 20 DOM
-
2026-06-21days on market $146,300 Active 19 DOM
-
2026-06-18days on market $146,300 Active 17 DOM
-
2026-06-17days on market $146,300 Active 16 DOM
-
2026-06-16days on market $146,300 Active 15 DOM
-
2026-06-15days on market $146,300 Active 14 DOM
-
2026-06-13days on market $146,300 Active 12 DOM
-
2026-06-12days on market $146,300 Active 11 DOM
-
2026-06-09days on market $146,300 Active 8 DOM
-
2026-06-08days on market $146,300 Active 7 DOM
-
2026-06-08days on market $146,300 Active 6 DOM
-
2026-06-05days on market $146,300 Active 4 DOM
-
2026-06-03days on market $146,300 Active 2 DOM
-
2026-06-02remarks 494-char remark
-
2026-06-02$146,300 Active 1 DOM
ⓘ Source: listings_history table (triggers on properties + properties_extension) + one-shot
backfill from property_details.listing_events for pre-trigger history.
Tax reassessment forecast TN · Resets to sale price
- Current annual tax
- $1,240 · $103/mo
- Projected year-2 tax
- $1,240 · $103/mo
- Expected delta
- $0/yr ($0/mo · 0.0%)
ⓘ Screening estimate from a state-policy table — verify with the county assessor before closing.
Climate risk First Street
- Flood 1/10 Low FEMA zone X (unshaded) · 0% chance over 30 yrs
- Wildfire 1/10 Low
- Heat 6/10 Major 7 d/yr ≥108°F today · 21 d/yr by 30 yrs out
- Wind 4/10 Moderate 9% chance of damaging wind over 30 yrs
- Air quality 2/10 Low 0 unhealthy d/yr today · 1 by 30 yrs out
Nearby sold comps map
Loading sold comps map…
Walkable amenities ~0.75 mi
Loading nearby amenities…
Taxation est. · year 1
- Rental income
- $14,369
- − Mortgage interest
- −$8,195
- − Property taxes
- −$1,240
- − Insurance
- −$732
- − Repairs & maintenance
- −$1,150
- − Management
- −$1,150
- − Depreciation
- −$4,256
- Taxable loss
- −$2,353
- Est. tax savings @ 24.0%
- +$565
- After-tax cash flow
- $738/yr
For passive investors: Depreciation is non-cash, so a rental often shows a tax loss while cash-flowing — sheltering income. Rental losses are passive: they offset passive income freely, and up to $25,000/yr can offset ordinary (W-2) income if you actively participate and your MAGI is under $100k (phasing out to $0 by $150k); unused losses carry forward. On sale, claimed depreciation is recaptured at up to 25%, and gains may owe capital-gains tax (a 1031 exchange can defer both). Figures are a year-1 estimate at your 24.0% rate — not tax advice; consult a CPA.
Schools (NCES district)
- District
- Lake County
- NCES district ID
- 4702280
- Math proficiency
- 11% ▼ -9.00%
- Reading proficiency
- 14% ▼ -9.00%
- Median HH income
- $29,058
- Composite
- 9.69/100
- National rank
- #9833
- State rank
- #135 of 139 in TN
Livability — Tiptonville
- Score
- 58/100
- State rank
- #302
- US rank
- #20747
Category grades
Schools grade is shown separately in the Schools card above.
Census & demographics
- Population (ZIP)
- 4,450
Population outlook (Lake County) Hauer SSP2
- Today (2025)
- 7,234 people
- By 2030
- 7,045 · -2.6%
- By 2040
- 6,848 · -5.3%
- By 2050
- 6,681 · -7.6%
- By 2075
- 5,629 · -22.2%
- By 2100
- 4,211 · -41.8%
Race, ethnicity, and origin ACS 2023
- Neighborhood character
- Majority White (64%)
- Race & ethnicity
- White 64% Black 24% Two or more races 7% Hispanic / Latino 4% Native American 2%
- Common ancestry
- Iranian 2% Serbian 2% Romanian 1%
- Foreign-born
- 2% · Canada
- Languages at home
- 96% English-only · Spanish 3%
Political lean MEDSL · Lake
- 2024 margin
- Solid R (+54.9) · D 22.1% · R 77.0%
- 2008→2024 swing
- -48.1pp toward R · 2008: -6.7pp · 2024: -54.9pp
- All cycles
- 2024: R+54.9 2020: R+47.5 2016: R+39.6 2012: R+13.4 2008: R+6.7
Not yet ingested
- Civics
- —
Market trends
- HPI YoY
- ▲ 2.02%
- Current HPI
- 189.4148
- Rent YoY
- —
- Metro
- —
- State GDP YoY
- ▲ 2.78%
- F500 in state
- 22
Industry mix (Fortune 500 HQ in TN)
| Industry | F500 HQs | Revenue |
|---|---|---|
| Healthcare | 3 | $91B |
|
||
| Retail | 3 | $72B |
|
||
| Transportation / Logistics | 1 | $88B |
|
||
| Paper / Packaging | 1 | $19B |
|
||
| Insurance | 1 | $13B |
|
||
| Energy | 1 | $12B |
|
||
Price history
+121.7% since first listed10 events — show timeline
- 2026-06-01 Listed $146,300 RRAR as distributed by MLS GRID
- 2025-06-13 Price Changed $260,000 CWTAR
- 2024-10-24 Price Changed $259,000 CWTAR
- 2024-09-16 Price Changed $269,900 CWTAR
- 2024-06-26 Price Changed $285,000 CWTAR
- 2024-06-12 Price Changed $299,900 CWTAR
- 2024-05-06 Delisted — CWTAR
- 2024-01-26 Price Changed $229,900 CWTAR
- 2023-10-30 Listed $259,900 CWTAR
- 1998-03-20 Sold (Public Records) $66,000 Public Records
Property tax history
+9.1%/yrLatest (2025): $1,240 · +0.0% YoY. Source: county tax records.
Cash-flow waterfall
monthlySold comps — $/sqft
last 12 mo · ≤1 miLoading sold comps…