 🏗️ New Construction
Denton V G Plan · Carencro, LA
Flood risk No data
- FEMA flood zone
- —
- Chance of flooding over 30 yrs
- —
- Est. flood insurance / yr
- —
Fire risk No data
- Est. fire insurance / yr
- —
Heat risk No data
- Hot days now (above threshold)
- —
- Hot days in 30 yrs
- —
Wind risk No data
- Chance of severe wind over 30 yrs
- —
Air-quality risk No data
- Unhealthy air days now
- —
- Unhealthy air days in 30 yrs
- —
Risk factors via First Street. Map © Google.
Why this score? — see what drove the F grade
The composite is a weighted blend of 9 inputs, each scored 0–100. Each bar is that input's sub-score; the figure is the points it added to the 100-point composite (weight × sub-score).
- ARV discount +7.5/15.0
- Cash flow +7.0/30.0
- Schools +3.6/10.0
- Livability +3.5/5.0
- Rent growth +2.5/5.0
- 1% rule +1.9/10.0
- DSCR +1.2/10.0
- Condition / age +1.0/5.0
- Appreciation +0.0/10.0
$214,990
🖨 Deal sheet (PDF) 📄 Offer letter ✓ Due diligence
Listing remarks MLS
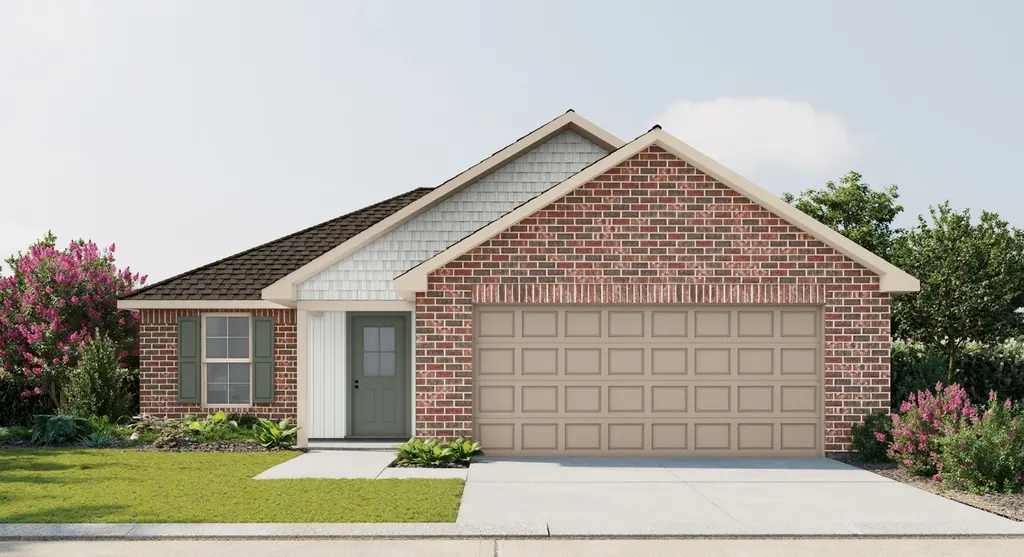
The Denton V G by DSLD Homes offers a perfect combination of energy efficiency and modern living with 1,394 square feet of comfortable living space and a total area of 1,896 square feet. This thoughtfully designed floor plan features three bedrooms and two bathrooms, ideal for families or individuals seeking a functional and stylish home. The home boasts a brick and siding exterior, delivering a classic and low-maintenance look. Step outside and enjoy the covered rear patio, providing a serene space for outdoor relaxation. The two-car garage offers convenience and ample storage space, making it perfect for families on the go. Inside, the open floor plan creates a welcoming atmosphere, connecting the living, dining, and kitchen areas. The kitchen is well-equipped with recessed can lighting, offering bright and efficient illumination. The master suite is a standout feature, featuring a spacious walk-in closet that enhances the home's overall appeal. With its energy-saving features, convenient layout, and stylish finishes, the Denton V G is the perfect home for those looking to enjoy both modern living and long-term efficiency.
Key facts
- 2 garage spots
- Listed 858 days
Neighborhood map
What this means for you Summary
Snapshot
- This is a 3-bed/2.0-bath single-family listed at $215k. Condition is rated poor.
Deal economics
- At list price, monthly cash flow is $-366 ($-4k/yr) — negative.
- To cash-flow at today's rent, offer at most $199k (7.3% below list).
- To meet the 1% rule (rent ≥ 1% of price), the offer needs to be $174k (18.9% below list).
- Recommended offer: $174k (18.9% below list) — sets the bar for 1% rule.
Location & tenants
- Location reads 69/100 on livability (#65 in LA) — a middle-class / working-renter tenant base. Strengths: cost of living A+, housing A+, health & safety A+; Watch: employment C-, crime D, amenities F.
- Lafayette Parish (urban): math 38% / reading 46% proficiency, ranked #19 of 98 in LA (top 19%) — families likely to look elsewhere, expect single-tenant / working-renter base with shorter leases.
- Zoned schools: J. Wallace James Elementary School (math 46% / reading 49%, grade D, #147 of 646 statewide, top 23%, 939 students, 64% FRL); Carencro Middle School (math 18% / reading 28%, grade F, #145 of 218 statewide, top 69%, 665 students, 75% FRL); Carencro High School (math 30% / reading 29%, grade F, #127 of 265 statewide, top 49%, 1,096 students, 69% FRL).
- Market conditions: 281 active listings in the ZIP; 4 comparable units currently listed for rent nearby; rentals lingering (median 46d on market — plan ~5-8 weeks vacancy on turnover, expect pricing pressure); 75% of comp listings sitting > 30 days — soft ceiling on asking rent; 1,585 units permitted in Lafayette Parish in 2024 (10 in 5+ unit buildings).
Forward outlook
- Local home prices are declining (-3.0%/yr); year-one equity from $2k of loan paydown is wiped out by about $8k of value loss. Plan a longer hold.
- Lafayette County population projected at +34% by 2050 — long-run rental-demand tailwind backs the buy-and-hold thesis.
Negotiation context
- It's been on market 858 days — a 12% lower offer ($189k) is reasonable based on typical stale-listing flexibility.
Questions for the listing agent
- What do current leases actually rent for vs. the listed asking? Can we see a recent rent roll and the last 12 months of T-12 income?
- It's been on market 858 days. Have you received any prior offers? Is the seller open to a 19% concession, seller financing, or rate buy-down credit?
- Have any recent inspections been done? Can we get a copy of the seller's disclosures and any deferred-maintenance estimates?
- Why hasn't it sold? Are there any deal-killer items the seller is aware of (foundation, flood, title, zoning, code violations)?
- Is there a deadline driving the sale (1031 exchange, divorce, estate, relocation)? That informs how much negotiation room exists.
- Crime grade is D in this area — have there been break-ins, vandalism, or insurance claims at this property in the last 3 years? What carrier currently insures it and at what premium?
- The area grade is low — what's the realistic commute time and amenity access for the typical tenant pool here? Any planned neighborhood developments (good or bad) we should know about?
- What's the average days-on-market for RENTAL listings here right now (not sales)? A rising rental-DOM trend means longer vacancies and softer asking-rent achievability than the comps imply.
- What's the recent tenant-quality profile in this submarket — average credit score on applications, eviction rate, late-payment / NSF rate, and stable-employment percentage? A property-management company in the area should have these aggregated.
- How much new for-sale + rental construction is in the pipeline within 1–3 miles? Heavy new supply typically softens prices + rents 12–24 months out; constrained supply supports both.
Investment metrics
- 1% rule
- 0.69% ✗
- Cap rate
- 4.55%
- Cash-on-cash
- -6.22%
- DSCR
- 0.72
- GRM
- 12.1
CMA / ARV
- ARV (median comp)
- $252,279
- List price
- $214,990
- Delta
- -14.78%
- Verdict
- UNDERPRICED
- Comps
- 20 within 1.0 mi
Show comp detail 12 sales within ~0.75 mi
| Address | Dist | Beds/Ba | Sqft | Sold | Price | $/sf | Match |
|---|---|---|---|---|---|---|---|
| 211 Cainwood Ct | 0.26mi | 3/2.0 | 1,422 (+2%) | 2mo | $220,177 | $155 | 82 |
| 405 Auburn Dr | 0.24mi | 3/2.0 | 1,345 (-4%) | 2mo | $135,000 | $100 | 81 |
| 214 Hester Way | 0.08mi | 3/2.0 | 1,283 (-8%) | 3mo | $210,700 | $164 | 81 |
| 102 Linares St | 0.30mi | 3/2.0 | 1,427 (+2%) | 2mo | $162,000 | $114 | 80 |
| 209 Cainwood Ct | 0.25mi | 3/2.0 | 1,321 (-5%) | 3mo | $210,787 | $160 | 77 |
| 902 Pelican Ridge Cv | 0.48mi | 3/2.0 | 1,410 (+1%) | 1mo | $200,000 | $142 | 75 |
| 215 Hester Way | 0.05mi | 3/2.0 | 1,225 (-12%) | 3mo | $207,775 | $170 | 75 |
| 103 Island Nest Cv | 0.25mi | 3/2.0 | 1,495 (+7%) | 4mo | $219,900 | $147 | 73 |
| 129 Bradford Dr | 0.45mi | 3/1.5 | 1,362 (-2%) | 3mo | $72,800 | $53 | 71 |
| 104 White Stripe Cv | 0.40mi | 3/2.0 | 1,478 (+6%) | 2mo | $217,500 | $147 | 70 |
| 103 Linares St | 0.33mi | 3/1.0 | 1,500 (+8%) | 2mo | $95,000 | $63 | 66 |
| 104 Meadowvale Dr | 0.67mi | 3/2.0 | 1,526 (+10%) | 5mo | $205,000 | $134 | 49 |
Match score weights: distance 35% · size 25% · config 20% · recency 20%. Top-matched comps best support the ARV.
Projected returns pro-forma
-3.0% appreciation · 3.0% rent growth · sell at horizon
- IRR
- -27.0%
- Equity multiple
- 0.09×
- Total profit
- $-64,155
- Equity at exit
- $37,616
- IRR
- -24.6%
- Equity multiple
- -0.21×
- Total profit
- $-85,763
- Equity at exit
- $21,812
Cash invested: $70,638 (down + closing). Projections, not guarantees.
Landlord ↔ Tenant lean methodology
- Overall (STATE)
- 90 Strongly Landlord-Friendly
- State Louisiana
- 90 Strongly Landlord-Friendly · R+12
- County
- — inherits STATE
- City
- — inherits STATE
ZIP-level market 70520
- Home prices YoY
- -17.6%
- Active inventory
- 281
- Price-to-rent
- 10.3×
Monthly cashflow live
- Estimated rent
- $1,744 medium interval (Pro) →
- Mortgage (P&I)
- −$1,323
- Tax est. 1.5%
- −$315 /mo · $3,784/yr
- Insurance
- −$105
- HOA
- −$0
- Vacancy / Maint / Mgmt
- −$366
- Net cashflow
- $-366
Break-even live
Sensitivity live
| Price | -10% $-192 | -5% $-279 | +0% $-366 | +5% $-453 | +10% $-540 |
|---|---|---|---|---|---|
| Rent | -10% $-504 | -5% $-435 | +0% $-366 | +5% $-297 | +10% $-228 |
| Rate | -1.0pp $-239 | -0.5pp $-302 | base $-366 | +0.5pp $-431 | +1.0pp $-498 |
UW: 25.0% down · 7.5% · 30yr · 1.5% tax · 5.0% vac · 8.0% maint · 8.0% mgmt
Financing live
Cash to close
- Down payment
- $63,070
- Closing costs
- $7,568
- Reserves months
- —
- Total cash needed
- —
Loan-product check · same deal, 3 products live
Conventional
25% down · 7.5% · 30yr
- Down + closing
- —
- Monthly P&I
- —
- Monthly cashflow
- —
- DSCR
- —
- Eligible?
- —
Personal DTI + credit; lowest rate.
DSCR
20% down · 8.5% · 30yr
- Down + closing
- —
- Monthly P&I
- —
- Monthly cashflow
- —
- DSCR
- —
- Eligible?
- —
No personal income docs; deal must DSCR.
Hard money
10% down · 12.0% · 12mo
- Down + closing
- —
- Monthly P&I
- —
- Monthly cashflow
- —
- DSCR
- —
- Eligible?
- —
Short-term bridge; refi at stabilization.
Rent comps 4 comps
| Address | Beds | Baths | Sqft | Rent | $/sqft | DOM | Units | Dist |
|---|---|---|---|---|---|---|---|---|
| 219 Oak Path Dr Carencro, LA | 3.0 | 2.0 | 1615 | $1,900 | $1.18 | 45d | 1 | 0.75mi |
| 124 Saint Fabian Dr Carencro, LA | 3.0 | 2.0 | 1450 | $1,700 | $1.17 | 45d | 1 | 1.11mi |
| 124 Saint Fabian Dr Carencro, LA | 3.0 | 2.0 | 1441 | $1,650 | $1.15 | 23d | 1 | 1.11mi |
| 115 Northpointe Dr Carencro, LA | 3.0 | 2.0 | 1696 | $1,650 | $0.97 | 45d | 1 | 1.30mi |
Listing history 18 events
-
2026-06-21days on market $214,990 Active 858 DOM
-
2026-06-18days on market $214,990 Active 855 DOM
-
2026-06-17days on market $214,990 Active 854 DOM
-
2026-06-16days on market $214,990 Active 853 DOM
-
2026-06-15days on market $214,990 Active 852 DOM
-
2026-06-14days on market $214,990 Active 850 DOM
-
2026-06-13days on market $214,990 Active 849 DOM
-
2026-06-10days on market $214,990 Active 847 DOM
-
2026-06-09days on market $214,990 Active 846 DOM
-
2026-06-08days on market $214,990 Active 845 DOM
-
2026-06-07days on market $214,990 Active 844 DOM
-
2026-06-05days on market $214,990 Active 841 DOM
-
2026-06-03days on market $214,990 Active 840 DOM
-
2026-06-02days on market $214,990 Active 839 DOM
-
2026-06-01days on market $214,990 Active 838 DOM
-
2026-05-31days on market $214,990 Active 837 DOM
-
2026-05-30days on market $214,990 Active 836 DOM
-
2024-02-14$214,990 Active 1142-char remark
Show marketing remark (1142 chars)
The Denton V G by DSLD Homes offers a perfect combination of energy efficiency and modern living with 1,394 square feet of comfortable living space and a total area of 1,896 square feet. This thoughtfully designed floor plan features three bedrooms and two bathrooms, ideal for families or individuals seeking a functional and stylish home. The home boasts a brick and siding exterior, delivering a classic and low-maintenance look. Step outside and enjoy the covered rear patio, providing a serene space for outdoor relaxation. The two-car garage offers convenience and ample storage space, making it perfect for families on the go. Inside, the open floor plan creates a welcoming atmosphere, connecting the living, dining, and kitchen areas. The kitchen is well-equipped with recessed can lighting, offering bright and efficient illumination. The master suite is a standout feature, featuring a spacious walk-in closet that enhances the home's overall appeal. With its energy-saving features, convenient layout, and stylish finishes, the Denton V G is the perfect home for those looking to enjoy both modern living and long-term efficiency.
ⓘ Source: listings_history table (triggers on properties + properties_extension) + one-shot
backfill from property_details.listing_events for pre-trigger history.
Nearby sold comps map
Loading sold comps map…
Walkable amenities ~0.75 mi
Loading nearby amenities…
Taxation est. · year 1
- Rental income
- $20,925
- − Mortgage interest
- −$14,132
- − Property taxes
- −$3,784
- − Insurance
- −$1,261
- − Repairs & maintenance
- −$1,674
- − Management
- −$1,674
- − Depreciation
- −$7,339
- Taxable loss
- −$8,939
- Est. tax savings @ 24.0%
- +$2,145
- After-tax cash flow
- $-2,245/yr
For passive investors: Depreciation is non-cash, so a rental often shows a tax loss while cash-flowing — sheltering income. Rental losses are passive: they offset passive income freely, and up to $25,000/yr can offset ordinary (W-2) income if you actively participate and your MAGI is under $100k (phasing out to $0 by $150k); unused losses carry forward. On sale, claimed depreciation is recaptured at up to 25%, and gains may owe capital-gains tax (a 1031 exchange can defer both). Figures are a year-1 estimate at your 24.0% rate — not tax advice; consult a CPA.
Condition & rehab AI · 3 photos
This property requires extensive repairs and maintenance, including exterior repairs, roof replacement, and interior updates. Significant value can be added through these improvements, making it a good investment opportunity.
Repairs flagged
- Major siding — Significant damage and wear visible on the exterior.
- Major roof — Significant wear and potential leaks visible.
- Major exterior paint — The exterior paint is peeling and in poor condition.
- Major interior walls and paint — The interior condition is not visible, but the exterior suggests a lack of maintenance.
- Major systems and appliances — The overall condition suggests outdated or damaged systems and appliances.
Value-add opportunities
- Resale exterior repairs and painting — A fresh exterior will attract more buyers.
- Resale roof repair — A new roof will significantly increase the home's value.
- Both interior repairs and painting — Fresh interior will appeal to both buyers and renters.
- Both system upgrades — Upgrading systems will improve the home's functionality and appeal.
- Both landscaping and curb appeal — A well-maintained yard will enhance the home's curb appeal and attract more interest.
Renovation cost estimate screening
| Repair item | Severity | Est. cost |
|---|---|---|
| siding · Significant damage and wear visible on the exterior. | Major | $15,000–50,000 |
| roof · Significant wear and potential leaks visible. | Major | $15,000–50,000 |
| exterior paint · The exterior paint is peeling and in poor condition. | Major | $15,000–50,000 |
| interior walls and paint · The interior condition is not visible, but the exterior suggests a lack of maintenance. | Major | $15,000–50,000 |
| systems and appliances · The overall condition suggests outdated or damaged systems and appliances. | Major | $15,000–50,000 |
| Total estimated repair cost · 5 items | $75,000–250,000 |
Value-add ROI direction
- Resale exterior repairs and painting — A fresh exterior will attract more buyers. ↑
- Resale roof repair — A new roof will significantly increase the home's value. ↑
- Both interior repairs and painting — Fresh interior will appeal to both buyers and renters. ↑
- Both system upgrades — Upgrading systems will improve the home's functionality and appeal. ↑
- Both landscaping and curb appeal — A well-maintained yard will enhance the home's curb appeal and attract more interest. ↑
ⓘ Cost ranges are severity-bucket heuristics (US national rule-of-thumb). Get contractor quotes + a written scope before underwriting a rehab budget.
Schools (NCES district)
- District
- Lafayette Parish
- NCES district ID
- 2200870
- Math proficiency
- 38% ▼ -32.00%
- Reading proficiency
- 46% ▼ -24.00%
- Median HH income
- $50,238
- Composite
- 36.15/100
- National rank
- #4741
- State rank
- #19 of 98 in LA
Livability — Carencro
- Score
- 69/100
- State rank
- #65
- US rank
- #8277
Category grades
Schools grade is shown separately in the Schools card above.
Census & demographics
- Census place
- Carencro, LA
- City population
- 20,134
- Population (ZIP)
- 20,134
Population outlook (Lafayette County) Hauer SSP2
- Today (2025)
- 280,930 people
- By 2030
- 301,092 · +7.2%
- By 2040
- 339,456 · +20.8%
- By 2050
- 375,156 · +33.5%
- By 2075
- 451,672 · +60.8%
- By 2100
- 497,203 · +77.0%
Race, ethnicity, and origin ACS 2023
- Neighborhood character
- Diverse neighborhood (Simpson 0.56)
- Race & ethnicity
- White 58% Black 32% Two or more races 5% Hispanic / Latino 3% Asian 2%
- Common ancestry
- Lithuanian 13% Scotch-Irish 2% Italian 1%
- Foreign-born
- 2% · Canada
- Languages at home
- 92% English-only · French/Haitian/Cajun 5% Spanish 1% Other Indo-European 1%
Political lean MEDSL · Lafayette
- 2024 margin
- Solid R (+31.4) · D 33.5% · R 64.8% · Other 1.7%
- 2008→2024 swing
- -0.1pp no change · 2008: -31.3pp · 2024: -31.4pp
- All cycles
- 2024: R+31.4 2020: R+28.7 2016: R+33.6 2012: R+33.7 2008: R+31.3
Not yet ingested
- Civics
- —
Market trends
- HPI YoY
- ▼ -33.62%
- Current HPI
- 157.0194
- Rent YoY
- —
- Metro
- —
- State GDP YoY
- ▲ 3.29%
- F500 in state
- 10
Industry mix (Fortune 500 HQ in LA)
| Industry | F500 HQs | Revenue |
|---|---|---|
| Telecommunications | 2 | $23B |
|
||
| Utilities | 1 | $12B |
|
||
| Wholesale / Distribution | 1 | $5B |
|
||
| Advertising | 1 | $2B |
|
||
Price history
1 event — show timeline
- 2024-02-14 Listed $214,990 Zillow
Cash-flow waterfall
monthlySold comps — $/sqft
last 12 mo · ≤1 miLoading sold comps…