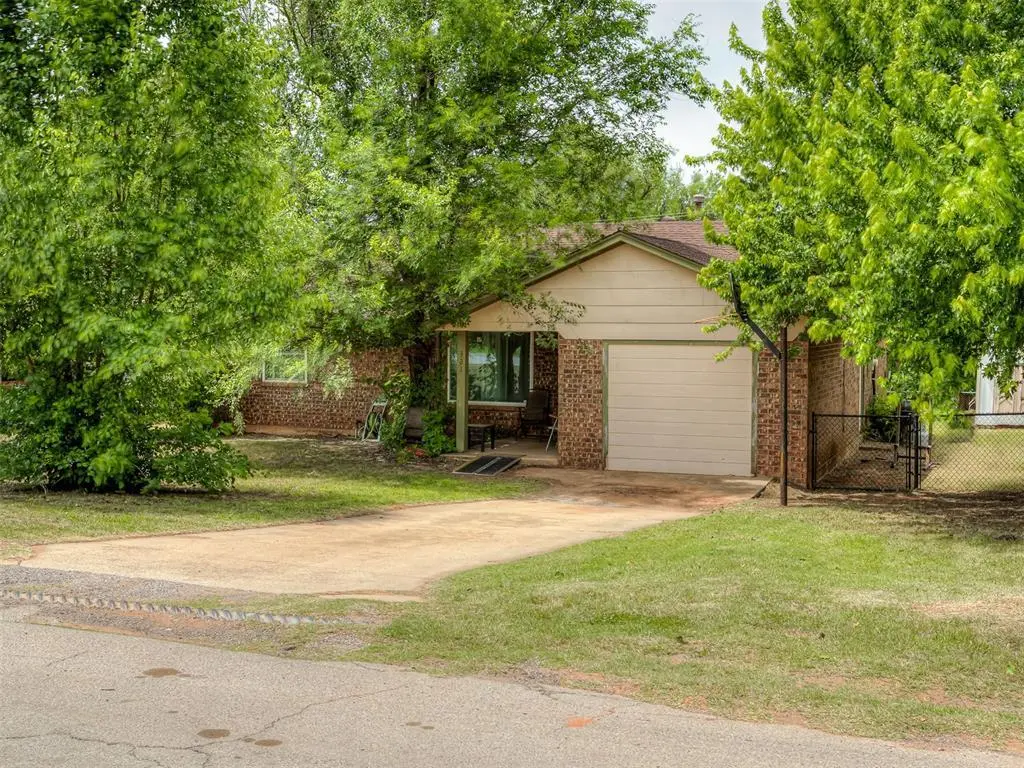
321 N Jefferson Ave · Blanchard, OK
Flood risk 1/10 · Minimal
- FEMA flood zone
- X (unshaded)
- Chance of flooding over 30 yrs
- 0.0%
- Est. flood insurance / yr
- $507 – $1,088
Fire risk 5/10 · Moderate
- Est. fire insurance / yr
- $2,463 – $4,575
Heat risk 6/10 · Moderate
- Hot days now (above 108°F)
- 7 days/yr
- Hot days in 30 yrs
- 19 days/yr
Wind risk 3/10 · Minor
- Chance of severe wind over 30 yrs
- 5.0%
Air-quality risk 2/10 · Minimal
- Unhealthy air days now
- 1 days/yr
- Unhealthy air days in 30 yrs
- 2 days/yr
Risk factors via First Street. Map © Google.
Why this score? — see what drove the C- grade
The composite is a weighted blend of 9 inputs, each scored 0–100. Each bar is that input's sub-score; the figure is the points it added to the 100-point composite (weight × sub-score).
- Cash flow +15.1/30.0
- ARV discount +11.4/15.0
- Appreciation +5.7/10.0
- DSCR +4.6/10.0
- Schools +3.6/10.0
- 1% rule +3.5/10.0
- Livability +3.5/5.0
- Rent growth +2.5/5.0
- Condition / age +2.5/5.0
$179,000
🖨 Deal sheet 📄 Offer letter ✓ Due diligence
Listing remarks MLS
NEW CH&A 2013, NEW REPLACEMENT WINDOWS 2012, NEW CARPET 2012, NEW TILE 2010, NEW DECK 2014, NEW ROOF ABOUT 4 YEARS AGO, TOTAL TEAR OFF. NICE HOME, BIG OPEN FLOOR PLAN. LARGE MATURE TREES, FENCED BACK YARD WITH DECK.
Key facts
- Near schools
- Near dining
- Converted garage
Tags
Property features AI
Finance
- Other: Occupied by owner; Located in Blanchard addition
- Financial info: Listing offered in as-is condition; Loan qualification allowed
- HOA & community: No mandatory association dues
Exterior
- Parking: 1-car garage
- Utilities: No flood insurance required (per listing); Living area recorded by assessor
- Home design: Single family residence; One story; Faces east; Residential property; Existing property
- Construction: Brick construction; Composition roof; Slab foundation; Built status: existing
- Exterior features: Chain link fencing; Interior lot
Interior
- Bedrooms: 3 bedrooms
- Bathrooms: 1 full bathroom; 1 half bathroom
- Interior features: One living area; No fireplace listed
Neighborhood map
What this means for you Summary
Snapshot
- This is a 3-bed/2.0-bath single-family listed at $179k.
Deal economics
- At list price, monthly cash flow is $57 ($690/yr) — positive.
- The deal already cash-flows at list — no discount required.
- To meet the 1% rule (rent ≥ 1% of price), the offer needs to be $152k (15.0% below list).
- Recommended offer: $152k (15.0% below list) — sets the bar for 1% rule.
- Cap rate 6.7% vs local median 2.6% in Blanchard — top-decile yield for the area; either an underpriced asset or a hidden risk that comps aren't pricing in. Stress-test before assuming the spread holds.
Location & tenants
- Location reads 69/100 on livability (#47 in OK) — a middle-class / working-renter tenant base. Strengths: crime A+, cost of living A+, housing A+; Watch: amenities F, commute F, health & safety F.
- Blanchard (rural): math 39% / reading 41% proficiency, ranked #13 of 270 in OK (top 5%) — families likely to look elsewhere, expect single-tenant / working-renter base with shorter leases.
- Zoned schools: Blanchard Es (558 students, 0% FRL); Blanchard Hs (math 27% / reading 42%, grade F, #48 of 447 statewide, top 14%, 724 students, 0% FRL) — zoned schools average 0% FRL vs 38% district-wide (38 pts lower); this property's tenant base skews higher-income than the district average.
- Market conditions: 507 active listings in the ZIP; 6 comparable units currently listed for rent nearby; rentals leasing fast (median 2d on market — plan ~1-2 weeks tenant-placement turnaround); solid renter incomes; 334 units permitted in McClain County in 2024 (0 in 5+ unit buildings).
Forward outlook
- In year one you build about $4k of equity ($1k loan paydown + $3k appreciation (1.4% local appreciation)).
- McClain County population projected at +44% by 2050 — long-run rental-demand tailwind backs the buy-and-hold thesis.
- At projected returns (1.4% appreciation + 3.0% rent growth), your $50k cash investment doubles in ~8 years — after that, you're playing with house money.
- By year 9, paydown + projected appreciation supports a ~$34k cash-out refi (75% LTV) — recoverable capital for the next deal without selling this one.
Negotiation context
- It's been on market 16 days — a 2% lower offer ($176k) is reasonable based on typical stale-listing flexibility.
- 2 sale attempts since 12y ago with the ask held roughly flat each time — persistent listings suggest the price (not the market) is what's stuck; bring a comps-based counter.
- Current owner paid $108k; list at $179k implies a 67% gain — meaningful room to come down on a strong offer.
Risks & watch-outs
- Climate carrying-cost: moderate wildfire risk; extreme-heat days projected 7→19/yr by 2055 (HVAC capex compounding) — expect insurance premiums to compound above CPI over the hold.
Questions for the listing agent
- Is there a deadline driving the sale (1031 exchange, divorce, estate, relocation)? That informs how much negotiation room exists.
- Schools are D-rated, which usually means shorter tenancies and higher turnover. Who's the typical renter profile here, and what's been the actual vacancy rate?
- What's the average days-on-market for RENTAL listings here right now (not sales)? A rising rental-DOM trend means longer vacancies and softer asking-rent achievability than the comps imply.
- What's the recent tenant-quality profile in this submarket — average credit score on applications, eviction rate, late-payment / NSF rate, and stable-employment percentage? A property-management company in the area should have these aggregated.
- How much new for-sale + rental construction is in the pipeline within 1–3 miles? Heavy new supply typically softens prices + rents 12–24 months out; constrained supply supports both.
Investment metrics
- 1% rule
- 0.85% ✗
- Cap rate
- 6.68%
- Cash-on-cash
- 1.38%
- DSCR
- 1.06
- GRM
- 9.8
CMA / ARV
- ARV (on-the-fly)
- $196,020
- Comps found
- 12
Show comp detail 12 sales within ~0.75 mi
| Address | Dist | Beds/Ba | Sqft | Sold | Price | $/sf | Match |
|---|---|---|---|---|---|---|---|
| 321 N Madison Ave | 0.07mi | 3/2.0 | 1,276 (+6%) | 2mo | $218,000 | $171 | 86 |
| 711 N Van Buren Ave | 0.43mi | 2/1.0 (-1) | 1,176 (-3%) | 6mo | $150,000 | $128 | 62 |
| 521 N Harrison Ave | 0.44mi | 3/2.0 | 1,239 (+2%) | 19mo | $193,000 | $156 | 60 |
| 311 N Monroe Ave | 0.14mi | 2/1.0 (-1) | 1,071 (-12%) | 8mo | $182,000 | $170 | 58 |
| 321 Van Buren St | 0.35mi | 3/1.0 | 1,144 (-6%) | 21mo | $189,000 | $165 | 53 |
| 301 Cherokee Ct | 0.72mi | 3/2.0 | 1,309 (+8%) | 8mo | $210,000 | $160 | 46 |
| 417 N Van Buren Ave | 0.35mi | 2/2.0 (-1) | 1,098 (-9%) | 20mo | $150,000 | $137 | 46 |
| 110 N Harrison Ave | 0.47mi | 3/2.0 | 1,056 (-13%) | 13mo | $178,000 | $169 | 46 |
| 317 S Tyler Ave | 0.61mi | 3/2.0 | 1,376 (+14%) | 8mo | $222,900 | $162 | 42 |
| 310 N Jackson Ave | 0.32mi | 3/1.5 | 1,035 (-14%) | 21mo | $165,000 | $159 | 42 |
| 213 S Tyler | 0.56mi | 3/2.0 | 1,350 (+12%) | 22mo | $234,900 | $174 | 36 |
| 420 E Broadway St | 0.53mi | 3/1.5 | 1,056 (-13%) | 22mo | $155,000 | $147 | 34 |
Match score weights: distance 35% · size 25% · config 20% · recency 20%. Top-matched comps best support the ARV.
Projected returns pro-forma
1.45% appreciation · 3.0% rent growth · sell at horizon
- IRR
- 4.2%
- Equity multiple
- 1.22×
- Total profit
- $10,910
- Equity at exit
- $65,294
- IRR
- 8.2%
- Equity multiple
- 2.05×
- Total profit
- $52,628
- Equity at exit
- $90,104
Cash invested: $50,120 (down + closing). Projections, not guarantees.
Landlord ↔ Tenant lean methodology
- Overall (STATE)
- 83 Strongly Landlord-Friendly
- State Oklahoma
- 83 Strongly Landlord-Friendly · R+20
- County
- — inherits STATE
- City
- — inherits STATE
ZIP-level market 73010
- Home prices YoY
- 0.5%
- Active inventory
- 507
- Price-to-rent
- 9.8×
Monthly cashflow live
- Estimated rent
- $1,522 high interval (Pro) →
- Mortgage (P&I)
- −$939
- Tax from tax record
- −$131 /mo · $1,576/yr
- Insurance
- −$75
- HOA
- −$0
- Vacancy / Maint / Mgmt
- −$320
- Net cashflow
- $57
Break-even live
UW: 25.0% down · 7.5% · 30yr · 1.5% tax · 5.0% vac · 8.0% maint · 8.0% mgmt
Financing live
Cash to close
- Down payment
- $44,750
- Closing costs
- $5,370
- Reserves months
- —
- Total cash needed
- —
Loan-product check · same deal, 3 products live
Conventional
25% down · 7.5% · 30yr
- Down + closing
- —
- Monthly P&I
- —
- Monthly cashflow
- —
- DSCR
- —
- Eligible?
- —
Personal DTI + credit; lowest rate.
DSCR
20% down · 8.5% · 30yr
- Down + closing
- —
- Monthly P&I
- —
- Monthly cashflow
- —
- DSCR
- —
- Eligible?
- —
No personal income docs; deal must DSCR.
Hard money
10% down · 12.0% · 12mo
- Down + closing
- —
- Monthly P&I
- —
- Monthly cashflow
- —
- DSCR
- —
- Eligible?
- —
Short-term bridge; refi at stabilization.
Rent comps 6 comps
| Address | Beds | Baths | Sqft | Rent | $/sqft | DOM | Units | Dist |
|---|---|---|---|---|---|---|---|---|
| 720 N Main Blanchard, OK | 3.0 | 2.0 | 1434 | $1,650 | $1.15 | 3d | 1 | 0.33mi |
| 509 Harris Blanchard, OK | 2.0 | 1.0 | 1000 | $895 | $0.90 | 1d | 1 | 0.41mi |
| 203 Summerfield Dr Blanchard, OK | 2.0 | 1.0 | 700 | $1,046 | $1.49 | 1d | 6 | 0.58mi |
| 300 Point Pleasant Ct Blanchard, OK | 2.0–3.0 | 2.0 | 1150 | $1,264 | $1.10 | 1d | 2 | 0.61mi |
| 2449 Heather Rd Blanchard, OK | 3.0 | 2.0 | 1385 | $1,750 | $1.26 | 10d | 1 | 1.31mi |
| 2449 Heather Rd Blanchard, OK | 3.0 | 2.0 | 1385 | $1,750 | $1.26 | 1d | 1 | 1.31mi |
Listing history 11 events
-
2026-06-07statusdays on market $179,000 Pending 16 DOM
-
2026-06-03days on market $179,000 Active 13 DOM
-
2026-06-02days on market $179,000 Active 12 DOM
-
2026-06-01days on market $179,000 Active 11 DOM
-
2026-05-31days on market $179,000 Active 10 DOM
-
2026-05-21$179,000 Active
-
2014-10-02soldstatus $107,500
-
2014-09-12soldstatus $107,500 222-char remark
Show marketing remark (222 chars)
NEW CH&A 2013, NEW REPLACEMENT WINDOWS 2012, NEW CARPET 2012, NEW TILE 2010, NEW DECK 2014, NEW ROOF ABOUT 4 YEARS AGO, TOTAL TEAR OFF. NICE HOME, BIG OPEN FLOOR PLAN. LARGE MATURE TREES, FENCED BACK YARD WITH DECK.
-
2014-05-28$107,500 222-char remark
Show marketing remark (222 chars)
NEW CH&A 2013, NEW REPLACEMENT WINDOWS 2012, NEW CARPET 2012, NEW TILE 2010, NEW DECK 2014, NEW ROOF ABOUT 4 YEARS AGO, TOTAL TEAR OFF. NICE HOME, BIG OPEN FLOOR PLAN. LARGE MATURE TREES, FENCED BACK YARD WITH DECK.
-
2004-11-16soldstatus $90,000
-
1998-09-18soldstatus $56,500
ⓘ Source: listings_history table (triggers on properties + properties_extension) + one-shot
backfill from property_details.listing_events for pre-trigger history.
Tax reassessment forecast OK · Resets to sale price
- Current annual tax
- $1,576 · $131/mo
- Projected year-2 tax
- $1,611 · $134/mo
- Expected delta
- +$35/yr (+$3/mo · 2.2%)
ⓘ Screening estimate from a state-policy table — verify with the county assessor before closing.
Climate risk First Street
- Flood 1/10 Low FEMA zone X (unshaded) · 0% chance over 30 yrs
- Wildfire 5/10 Major
- Heat 6/10 Major 7 d/yr ≥108°F today · 19 d/yr by 30 yrs out
- Wind 3/10 Moderate 5% chance of damaging wind over 30 yrs
- Air quality 2/10 Low 1 unhealthy d/yr today · 2 by 30 yrs out
Nearby sold comps map
Loading sold comps map…
Walkable amenities ~0.75 mi
Loading nearby amenities…
Taxation est. · year 1
- Rental income
- $18,260
- − Mortgage interest
- −$10,027
- − Property taxes
- −$1,576
- − Insurance
- −$895
- − Repairs & maintenance
- −$1,461
- − Management
- −$1,461
- − Depreciation
- −$5,207
- Taxable loss
- −$2,367
- Est. tax savings @ 24.0%
- +$568
- After-tax cash flow
- $1,258/yr
For passive investors: Depreciation is non-cash, so a rental often shows a tax loss while cash-flowing — sheltering income. Rental losses are passive: they offset passive income freely, and up to $25,000/yr can offset ordinary (W-2) income if you actively participate and your MAGI is under $100k (phasing out to $0 by $150k); unused losses carry forward. On sale, claimed depreciation is recaptured at up to 25%, and gains may owe capital-gains tax (a 1031 exchange can defer both). Figures are a year-1 estimate at your 24.0% rate — not tax advice; consult a CPA.
Schools (NCES district)
- District
- Blanchard
- NCES district ID
- 4004680
- Math proficiency
- 39% ▼ -2.00%
- Reading proficiency
- 41% ▼ -6.00%
- Median HH income
- $61,936
- Composite
- 35.63/100
- National rank
- #4887
- State rank
- #13 of 270 in OK
Livability — Blanchard
- Score
- 69/100
- State rank
- #47
- US rank
- #8299
Category grades
Schools grade is shown separately in the Schools card above.
Census & demographics
- Census place
- Blanchard, OK
- County
- McClain County · 33,206 people
- City population
- 21,521
- Metro
- Oklahoma City, OK
- Population (ZIP)
- 21,521
- Household income
- $90,110
- Rent vs Own
- Severe rent burden
- 239.0
Population outlook (McClain County) Hauer SSP2
- Today (2025)
- 46,053 people
- By 2030
- 50,081 · +8.7%
- By 2040
- 58,231 · +26.4%
- By 2050
- 66,276 · +43.9%
- By 2075
- 86,558 · +88.0%
- By 2100
- 100,421 · +118.1%
Race, ethnicity, and origin ACS 2023
- Neighborhood character
- Predominantly White (81%)
- Race & ethnicity
- White 81% Two or more races 10% Hispanic / Latino 6% Native American 4%
- Hispanic origin (detail)
- Mexican 5%
- Common ancestry
- Italian 2% Lithuanian 2% Slovak 2%
- Foreign-born
- 1% · Canada
- Languages at home
- 97% English-only · Spanish 3%
Political lean MEDSL · McClain
- 2024 margin
- Solid R (+60.6) · D 18.8% · R 79.5% · Other 1.7%
- 2008→2024 swing
- -8.8pp toward R · 2008: -51.8pp · 2024: -60.6pp
- All cycles
- 2024: R+60.6 2020: R+60.9 2016: R+60.9 2012: R+55.4 2008: R+51.8
Not yet ingested
- Civics
- —
Market trends
- HPI YoY
- ▲ 1.45%
- Current HPI
- 285.8653
- Rent YoY
- —
- Metro
- Oklahoma City, OK
- State GDP YoY
- ▲ 1.55%
- F500 in state
- 6
Industry mix (Fortune 500 HQ in OK)
| Industry | F500 HQs | Revenue |
|---|---|---|
| Energy | 3 | $48B |
|
||
Price history
+216.8% since first listed6 events — show timeline
- 2026-05-21 Listed $179,000 MLSOK
- 2014-10-02 Sold (Public Records) $107,500 Public Records
- 2014-09-12 Sold (MLS) $107,500 MLSOK
- 2014-05-28 Listed $107,500 MLSOK
- 2004-11-16 Sold (Public Records) $90,000 Public Records
- 1998-09-18 Sold (Public Records) $56,500 Public Records
Property tax history
+2.8%/yrLatest (2025): $1,576 · +4.9% YoY. Source: county tax records.
Cash-flow waterfall
monthlySold comps — $/sqft
last 12 mo · ≤1 miLoading sold comps…