 🏗️ New Construction
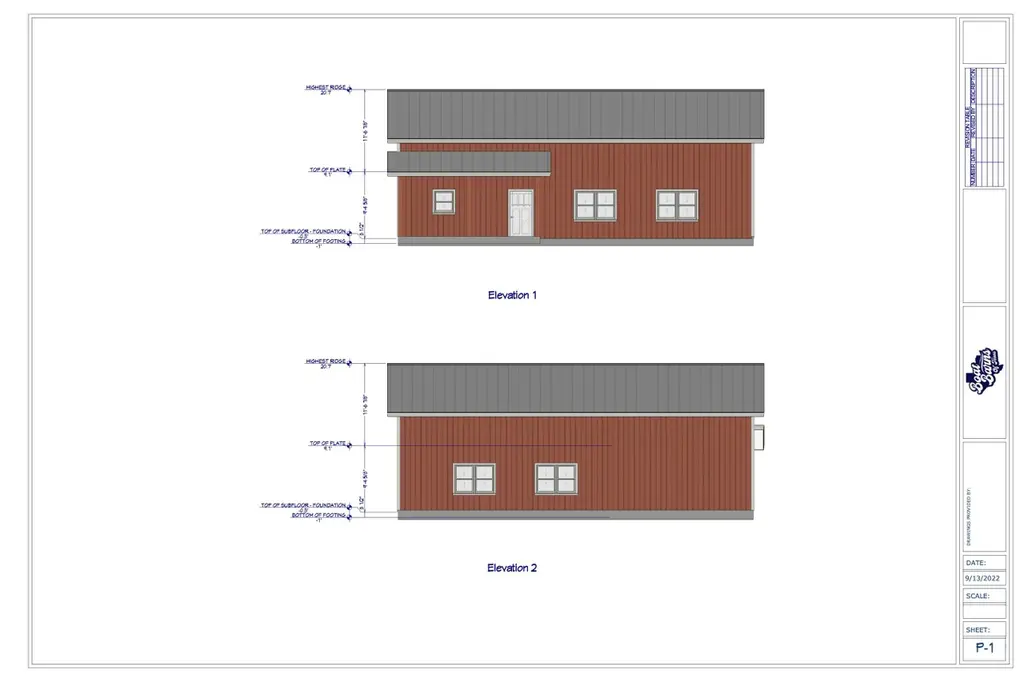
The Cypress Plan · Winnsboro, TX
Flood risk No data
- FEMA flood zone
- —
- Chance of flooding over 30 yrs
- —
- Est. flood insurance / yr
- —
Fire risk No data
- Est. fire insurance / yr
- —
Heat risk No data
- Hot days now (above threshold)
- —
- Hot days in 30 yrs
- —
Wind risk No data
- Chance of severe wind over 30 yrs
- —
Air-quality risk No data
- Unhealthy air days now
- —
- Unhealthy air days in 30 yrs
- —
Risk factors via First Street. Map © Google.
Why this score? — see what drove the F grade
The composite is a weighted blend of 9 inputs, each scored 0–100. Each bar is that input's sub-score; the figure is the points it added to the 100-point composite (weight × sub-score).
- Appreciation +7.6/10.0
- ARV discount +7.5/15.0
- Schools +3.9/10.0
- Livability +3.5/5.0
- Rent growth +2.5/5.0
- Condition / age +1.0/5.0
- Cash flow +0.1/30.0
- 1% rule +0.0/10.0
- DSCR +0.0/10.0
$208,000
🖨 Deal sheet 📄 Offer letter ✓ Due diligence
Listing remarks MLS
The Cypress boasts approximately 1600sf under roof with a huge porch for outdoor enjoyment. The Cypress is the most affordable floorpan. The 12' tall garage door and large driveway makes storing the tallest ski boat, lake toys, classic cars and more. Create your dream ManCave or She Shed.
Key facts
- 2 parking spots
- Listed 953 days
Neighborhood map
What this means for you Summary
Snapshot
- This is a 1-bed/1.5-bath single-family listed at $208k. Condition is rated poor.
Deal economics
- At list price, monthly cash flow is $-3k ($-37k/yr) — negative.
- The deal already cash-flows at list — no discount required.
- To meet the 1% rule (rent ≥ 1% of price), the offer needs to be $203k (2.6% below list).
- Recommended offer: $183k (12.0% below list) — sets the bar for market timing.
- Cap rate 0.8% vs local median 3.8% in Winnsboro — below-typical yield; the buyer is paying a premium for something (appreciation thesis, condition, location) that the cap rate doesn't capture.
Location & tenants
- Location reads 69/100 on livability (#416 in TX) — a middle-class / working-renter tenant base. Strengths: cost of living A+, housing A+, crime B; Watch: employment D+, amenities F, commute F.
- Mount Vernon ISD (town): math 49% / reading 43% proficiency, ranked #251 of 826 in TX (top 30%) — families likely to look elsewhere, expect single-tenant / working-renter base with shorter leases.
- Market conditions: 96 active listings in the ZIP; 7 units permitted in Franklin County in 2024 (0 in 5+ unit buildings).
Forward outlook
- In year one you build about $39k of equity ($5k loan paydown + $35k appreciation (5.1% local appreciation)).
- By year 2, paydown + projected appreciation supports a ~$63k cash-out refi (75% LTV) — recoverable capital for the next deal without selling this one.
Negotiation context
- It's been on market 954 days — a 12% lower offer ($183k) is reasonable based on typical stale-listing flexibility.
Risks & watch-outs
- Watch-outs: property tax is 4.9% of price.
Questions for the listing agent
- What do current leases actually rent for vs. the listed asking? Can we see a recent rent roll and the last 12 months of T-12 income?
- It's been on market 954 days. Have you received any prior offers? Is the seller open to a 12% concession, seller financing, or rate buy-down credit?
- Have any recent inspections been done? Can we get a copy of the seller's disclosures and any deferred-maintenance estimates?
- Property tax is high relative to price — has the assessment been appealed recently, and will the sale trigger a re-assessment?
- Why hasn't it sold? Are there any deal-killer items the seller is aware of (foundation, flood, title, zoning, code violations)?
- Is there a deadline driving the sale (1031 exchange, divorce, estate, relocation)? That informs how much negotiation room exists.
- The area grade is low — what's the realistic commute time and amenity access for the typical tenant pool here? Any planned neighborhood developments (good or bad) we should know about?
- What's the average days-on-market for RENTAL listings here right now (not sales)? A rising rental-DOM trend means longer vacancies and softer asking-rent achievability than the comps imply.
- What's the recent tenant-quality profile in this submarket — average credit score on applications, eviction rate, late-payment / NSF rate, and stable-employment percentage? A property-management company in the area should have these aggregated.
- How much new for-sale + rental construction is in the pipeline within 1–3 miles? Heavy new supply typically softens prices + rents 12–24 months out; constrained supply supports both.
Investment metrics
- 1% rule
- 0.30% ✗
- Cap rate
- 0.83%
- Cash-on-cash
- -19.51%
- DSCR
- 0.13
- GRM
- 27.9
CMA / ARV
- ARV (median comp)
- $678,619
- List price
- $208,000
- Delta
- -69.35%
- Verdict
- UNDERPRICED
- Comps
- 3 within 1.0 mi
Projected returns pro-forma
5.13% appreciation · 3.0% rent growth · sell at horizon
- IRR
- -2.8%
- Equity multiple
- 0.81×
- Total profit
- $-35,457
- Equity at exit
- $389,778
- IRR
- 1.6%
- Equity multiple
- 1.32×
- Total profit
- $60,890
- Equity at exit
- $677,054
Cash invested: $190,013 (down + closing). Projections, not guarantees.
Landlord ↔ Tenant lean methodology
- Overall (STATE)
- 87 Strongly Landlord-Friendly
- State Texas
- 87 Strongly Landlord-Friendly · R+5
- County
- — inherits STATE
- City
- — inherits STATE
ZIP-level market 75480
- Home prices YoY
- 2.2%
- Active inventory
- 96
- Price-to-rent
- 8.6×
Monthly cashflow live
- Estimated rent
- $2,025 medium interval (Pro) →
- Mortgage (P&I)
- −$3,559
- Tax est. 1.5%
- −$848 /mo · $10,179/yr
- Insurance
- −$283
- HOA
- −$0
- Vacancy / Maint / Mgmt
- −$425
- Net cashflow
- $-3,090
Break-even live
UW: 25.0% down · 7.5% · 30yr · 1.5% tax · 5.0% vac · 8.0% maint · 8.0% mgmt
Financing live
Cash to close
- Down payment
- $169,655
- Closing costs
- $20,359
- Reserves months
- —
- Total cash needed
- —
Loan-product check · same deal, 3 products live
Conventional
25% down · 7.5% · 30yr
- Down + closing
- —
- Monthly P&I
- —
- Monthly cashflow
- —
- DSCR
- —
- Eligible?
- —
Personal DTI + credit; lowest rate.
DSCR
20% down · 8.5% · 30yr
- Down + closing
- —
- Monthly P&I
- —
- Monthly cashflow
- —
- DSCR
- —
- Eligible?
- —
No personal income docs; deal must DSCR.
Hard money
10% down · 12.0% · 12mo
- Down + closing
- —
- Monthly P&I
- —
- Monthly cashflow
- —
- DSCR
- —
- Eligible?
- —
Short-term bridge; refi at stabilization.
Listing history 16 events
-
2026-06-19days on market $208,000 Active 954 DOM
-
2026-06-18days on market $208,000 Active 953 DOM
-
2026-06-17days on market $208,000 Active 952 DOM
-
2026-06-16days on market $208,000 Active 951 DOM
-
2026-06-15days on market $208,000 Active 950 DOM
-
2026-06-14days on market $208,000 Active 948 DOM
-
2026-06-12days on market $208,000 Active 947 DOM
-
2026-06-09days on market $208,000 Active 944 DOM
-
2026-06-08days on market $208,000 Active 943 DOM
-
2026-06-07days on market $208,000 Active 942 DOM
-
2026-06-05days on market $208,000 Active 940 DOM
-
2026-06-02days on market $208,000 Active 937 DOM
-
2026-06-01days on market $208,000 Active 936 DOM
-
2026-05-31days on market $208,000 Active 935 DOM
-
2026-05-30days on market $208,000 Active 934 DOM
-
2023-11-08$208,000 Active 289-char remark
Show marketing remark (289 chars)
The Cypress boasts approximately 1600sf under roof with a huge porch for outdoor enjoyment. The Cypress is the most affordable floorpan. The 12' tall garage door and large driveway makes storing the tallest ski boat, lake toys, classic cars and more. Create your dream ManCave or She Shed.
ⓘ Source: listings_history table (triggers on properties + properties_extension) + one-shot
backfill from property_details.listing_events for pre-trigger history.
Nearby sold comps map
Loading sold comps map…
Walkable amenities ~0.75 mi
Loading nearby amenities…
Taxation est. · year 1
- Rental income
- $24,301
- − Mortgage interest
- −$38,013
- − Property taxes
- −$10,179
- − Insurance
- −$3,393
- − Repairs & maintenance
- −$1,944
- − Management
- −$1,944
- − Depreciation
- −$19,742
- Taxable loss
- −$50,914
- Est. tax savings @ 24.0%
- +$12,219
- After-tax cash flow
- $-24,860/yr
For passive investors: Depreciation is non-cash, so a rental often shows a tax loss while cash-flowing — sheltering income. Rental losses are passive: they offset passive income freely, and up to $25,000/yr can offset ordinary (W-2) income if you actively participate and your MAGI is under $100k (phasing out to $0 by $150k); unused losses carry forward. On sale, claimed depreciation is recaptured at up to 25%, and gains may owe capital-gains tax (a 1031 exchange can defer both). Figures are a year-1 estimate at your 24.0% rate — not tax advice; consult a CPA.
Condition & rehab AI · 0 photos
This home requires extensive repairs and updates to bring it up to a livable condition. Significant investments in the kitchen, bathrooms, roof, exterior, flooring, and HVAC system are necessary to increase its resale and rental value.
Repairs flagged
- Major Kitchen countertops and cabinets — The countertops and cabinets are visibly worn and need replacement.
- Major Bathroom fixtures and tiles — The fixtures and tiles are outdated and stained, requiring replacement.
- Major Roof — The roof shows significant damage and discoloration, indicating potential leaks and structural issues.
- Major Exterior siding — The siding is peeling and shows significant wear, requiring replacement.
- Major Flooring — The carpeted flooring is worn and needs replacement.
- Major Interior walls — The walls show signs of peeling paint and potential water damage, requiring repainting and possibly repairs.
- Major HVAC system — The HVAC system appears old and may need replacement or repair.
Value-add opportunities
- Resale Kitchen renovation — A new kitchen will attract buyers and increase the home's appeal.
- Resale Bathroom renovation — Upgraded bathrooms will appeal to potential buyers and increase the home's value.
- Resale Roof replacement — A new roof will eliminate the risk of leaks and improve the home's overall condition.
- Resale Exterior siding replacement — A new exterior will improve the home's curb appeal and increase its resale value.
- Resale Flooring replacement — New flooring will improve the home's appearance and increase its resale value.
- Resale Interior wall repainting — Fresh paint will improve the home's appearance and increase its resale value.
- Resale HVAC system replacement — A new HVAC system will improve the home's comfort and energy efficiency, increasing its resale value.
- Both Landscaping and curb appeal — A well-maintained yard and curb appeal will attract buyers and increase the home's rental value.
Renovation cost estimate screening
| Repair item | Severity | Est. cost |
|---|---|---|
| Kitchen countertops and cabinets · The countertops and cabinets are visibly worn and need replacement. | Major | $15,000–50,000 |
| Bathroom fixtures and tiles · The fixtures and tiles are outdated and stained, requiring replacement. | Major | $15,000–50,000 |
| Roof · The roof shows significant damage and discoloration, indicating potential leaks and structural issues. | Major | $15,000–50,000 |
| Exterior siding · The siding is peeling and shows significant wear, requiring replacement. | Major | $15,000–50,000 |
| Flooring · The carpeted flooring is worn and needs replacement. | Major | $15,000–50,000 |
| Interior walls · The walls show signs of peeling paint and potential water damage, requiring repainting and possibly repairs. | Major | $15,000–50,000 |
| HVAC system · The HVAC system appears old and may need replacement or repair. | Major | $15,000–50,000 |
| Total estimated repair cost · 7 items | $105,000–350,000 |
Value-add ROI direction
- Resale Kitchen renovation — A new kitchen will attract buyers and increase the home's appeal. ↑
- Resale Bathroom renovation — Upgraded bathrooms will appeal to potential buyers and increase the home's value. ↑
- Resale Roof replacement — A new roof will eliminate the risk of leaks and improve the home's overall condition. ↑
- Resale Exterior siding replacement — A new exterior will improve the home's curb appeal and increase its resale value. ↑
- Resale Flooring replacement — New flooring will improve the home's appearance and increase its resale value. ↑
- Resale Interior wall repainting — Fresh paint will improve the home's appearance and increase its resale value. ↑
- Resale HVAC system replacement — A new HVAC system will improve the home's comfort and energy efficiency, increasing its resale value. ↑
- Both Landscaping and curb appeal — A well-maintained yard and curb appeal will attract buyers and increase the home's rental value. ↑
ⓘ Cost ranges are severity-bucket heuristics (US national rule-of-thumb). Get contractor quotes + a written scope before underwriting a rehab budget.
Schools (NCES district)
- District
- Mount Vernon ISD
- NCES district ID
- 4831770
- Math proficiency
- 49% ▼ -6.00%
- Reading proficiency
- 43% ▬ 0.00%
- Median HH income
- $46,788
- Composite
- 39.19/100
- National rank
- #4021
- State rank
- #251 of 826 in TX
Livability — Winnsboro
- Score
- 69/100
- State rank
- #416
- US rank
- #8564
Category grades
Schools grade is shown separately in the Schools card above.
Census & demographics
- Population (ZIP)
- 1,787
Population outlook (Franklin County) Hauer SSP2
- Today (2025)
- 10,621 people
- By 2030
- 10,648 · +0.3%
- By 2040
- 10,629 · +0.1%
- By 2050
- 10,486 · -1.3%
- By 2075
- 10,038 · -5.5%
- By 2100
- 8,816 · -17.0%
Race, ethnicity, and origin ACS 2023
- Neighborhood character
- Predominantly White (82%)
- Race & ethnicity
- White 82% Two or more races 16% Hispanic / Latino 14%
- Hispanic origin (detail)
- Mexican 12%
- Common ancestry
- Slovak 8% German 7% Romanian 4%
- Foreign-born
- 9% · Canada
- Languages at home
- 86% English-only · Spanish 13%
Political lean MEDSL · Franklin
- 2024 margin
- Solid R (+68.9) · D 15.3% · R 84.2%
- 2008→2024 swing
- -16.5pp toward R · 2008: -52.5pp · 2024: -68.9pp
- All cycles
- 2024: R+68.9 2020: R+67.0 2016: R+67.0 2012: R+63.4 2008: R+52.5
Not yet ingested
- Civics
- —
Market trends
- HPI YoY
- ▲ 5.13%
- Current HPI
- 234.5679
- Rent YoY
- —
- Metro
- —
- State GDP YoY
- ▲ 3.95%
- F500 in state
- 110
Industry mix (Fortune 500 HQ in TX)
| Industry | F500 HQs | Revenue |
|---|---|---|
| Energy | 16 | $1,198B |
|
||
| Technology | 5 | $198B |
|
||
| Engineering / Construction | 4 | $72B |
|
||
| Energy Services | 3 | $60B |
|
||
| Utilities | 3 | $41B |
|
||
| Healthcare | 2 | $330B |
|
||
Price history
1 event — show timeline
- 2023-11-08 Listed $208,000 Zillow
Cash-flow waterfall
monthlySold comps — $/sqft
last 12 mo · ≤1 miLoading sold comps…