 Multi-family
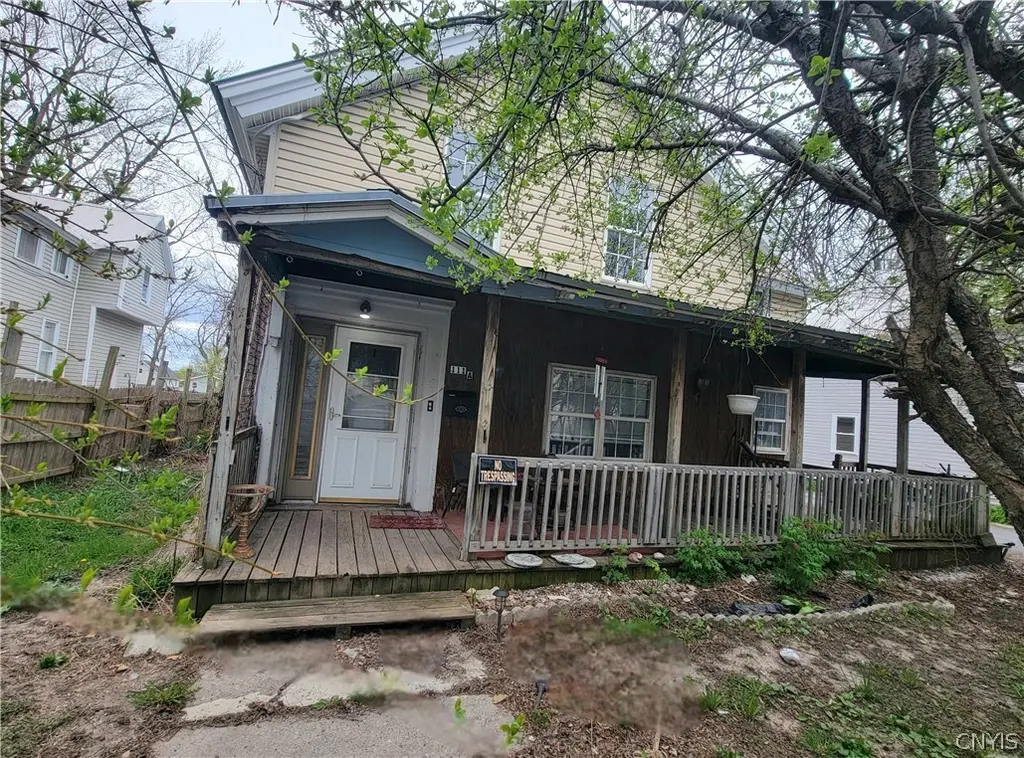
111 N Orchard St · Watertown, NY
Flood risk 1/10 · Minimal
- FEMA flood zone
- X
- Chance of flooding over 30 yrs
- 0.0%
- Est. flood insurance / yr
- $473 – $860
Fire risk 1/10 · Minimal
- Est. fire insurance / yr
- $691 – $1,283
Heat risk 2/10 · Minimal
- Hot days now (above 91°F)
- 7 days/yr
- Hot days in 30 yrs
- 15 days/yr
Wind risk 1/10 · Minimal
- Chance of severe wind over 30 yrs
- 0.0%
Air-quality risk 2/10 · Minimal
- Unhealthy air days now
- 1 days/yr
- Unhealthy air days in 30 yrs
- 1 days/yr
Risk factors via First Street. Map © Google.
Why this score? — see what drove the B+ grade
The composite is a weighted blend of 9 inputs, each scored 0–100. Each bar is that input's sub-score; the figure is the points it added to the 100-point composite (weight × sub-score).
- Cash flow +30.0/30.0
- ARV discount +15.0/15.0
- 1% rule +10.0/10.0
- DSCR +10.0/10.0
- Rent growth +5.0/5.0
- Schools +3.7/10.0
- Livability +3.4/5.0
- Condition / age +2.5/5.0
- Appreciation +0.0/10.0
$125,000
🖨 Deal sheet (PDF) 📄 Offer letter ✓ Due diligence
Multi-family units
County records classify this as Multi-Family (2-4 Unit). Listing-text estimate: 1 unit. estimate disagrees with records
Listing remarks
Two-Unit Property with Strong Potential – Opportunity awaits with this two-unit property offering flexible use and value-add potential. Whether continuing as a multi-unit residence or exploring renovation options, this property presents a range of possibilities, some of which have already been started, including the kitchen. The first unit spans two levels and includes four bedrooms, one full bathroom, a partially completed kitchen, formal dining room, living room, 1st floor laundry room, and both front and back porches, along with access to a spacious backyard. Many rooms showcase original tin ceilings that are in great condition. The second unit is located on one level and featur
Key facts
- 0.25 acre lot
- 2 parking spots
- Built 1880
Property features AI
Finance
- Other: Two-unit property with separate gas and electric meters for each unit
- Financial info: Operating expenses include insurance
Exterior
- Parking: Paved parking with two or more spaces
- Utilities: Public water connected; Sewer connected
- Home design: Single-story building; Existing property
- Construction: Vinyl siding; Metal roof; Stone foundation
- Exterior features: Near public transit; Rectangular residential lot; City street frontage
Interior
- Flooring: Carpet; Vinyl; Varies by area
- Bathrooms: Two full bathrooms
- Heating & cooling: Gas forced air heating
- Interior features: Full basement; Carpet and vinyl flooring; varying flooring in different areas
- Laundry & utility: Gas water heater
Neighborhood map
What this means for you Summary
Snapshot
- This is a 6-bed/2.0-bath multifamily listed at $125k.
Deal economics
- At list price, monthly cash flow is $1k ($17k/yr) — positive.
- The deal already cash-flows at list — no discount required.
- Meets the 1% rule at list price ($3k rent vs $125k).
- Recommended offer: $121k (3.0% below list) — sets the bar for market timing.
- Cap rate 19.7% vs local median 6.3% in Watertown — top-decile yield for the area; either an underpriced asset or a hidden risk that comps aren't pricing in. Stress-test before assuming the spread holds.
Location & tenants
- Location reads 68/100 on livability (#540 in NY) — a middle-class / working-renter tenant base. Strengths: health & safety A+, cost of living A-, housing A-; Watch: amenities C-, crime F, commute F.
- Watertown City School District (urban): math 34% / reading 54% proficiency, ranked #481 of 590 in NY (top 82%) — families likely to look elsewhere, expect single-tenant / working-renter base with shorter leases.
- Zoned schools: Sherman School (math 42% / reading 52%, grade D-, #1,195 of 2,108 statewide, top 60%, 320 students, 57% FRL); Case Middle School (math 17% / reading 41%, grade F, #566 of 729 statewide, top 78%, 626 students, 70% FRL); Watertown Senior High School (math 89% / reading 92%, grade A+, #231 of 1,100 statewide, top 21%, 1,083 students, 65% FRL).
- Market conditions: Rents rising fast (+10.0%/yr); 224 active listings in the ZIP; 196 units permitted in Jefferson County in 2024 (0 in 5+ unit buildings).
- At $2,814/mo this rent would consume 57% of the median local household income ($59k/yr) (locally 1634% of renters already pay >50% of income on rent) — very limited rent-growth headroom before tenants either downsize or default.
Forward outlook
- Local home prices are declining (-3.0%/yr); year-one equity from $864 of loan paydown is wiped out by about $4k of value loss. Plan a longer hold.
- Jefferson County population projected at -12% by 2050 — secular population decline; favor cash flow + early exit over multi-decade hold.
- At projected returns (-3.0% appreciation + 8.0% rent growth), your $35k cash investment doubles in ~3 years — after that, you're playing with house money.
Negotiation context
- It's been on market 48 days — a 3% lower offer ($121k) is reasonable based on typical stale-listing flexibility.
Risks & watch-outs
- Watch-outs: built in 1880 — expect roof / HVAC / electrical / plumbing capex.
Questions for the listing agent
- It's been on market 48 days. Have you received any prior offers? Is the seller open to a 3% concession, seller financing, or rate buy-down credit?
- Built in 1880 — when were the roof, HVAC, electrical panel, plumbing, and water heater last replaced?
- Is there a deadline driving the sale (1031 exchange, divorce, estate, relocation)? That informs how much negotiation room exists.
- Schools are D-rated, which usually means shorter tenancies and higher turnover. Who's the typical renter profile here, and what's been the actual vacancy rate?
- Crime grade is F in this area — have there been break-ins, vandalism, or insurance claims at this property in the last 3 years? What carrier currently insures it and at what premium?
- What's the average days-on-market for RENTAL listings here right now (not sales)? A rising rental-DOM trend means longer vacancies and softer asking-rent achievability than the comps imply.
- What's the recent tenant-quality profile in this submarket — average credit score on applications, eviction rate, late-payment / NSF rate, and stable-employment percentage? A property-management company in the area should have these aggregated.
- How much new apartment / multifamily construction is in the pipeline within 1–3 miles? Heavy new supply (>2% of stock underway) typically softens rents 12–24 months out; light construction supports rent growth.
Investment metrics
- 1% rule
- 2.25% ✓
- Cap rate
- 19.69%
- Cash-on-cash
- 47.83%
- DSCR
- 3.13
- GRM
- 3.7
CMA / ARV
- ARV (median comp)
- $236,664
- List price
- $125,000
- Delta
- -47.18%
- Verdict
- UNDERPRICED
- Comps
- 20 within 1.0 mi
Show comp detail 3 sales within ~0.75 mi
| Address | Dist | Beds/Ba | Sqft | Sold | Price | $/sf | Match |
|---|---|---|---|---|---|---|---|
| 377 W Main St | 0.40mi | 6/2.0 | 1,991 (-4%) | 23mo | $176,000 | $88 | 57 |
| 310 Howk St | 0.24mi | 6/3.0 | 1,810 (-12%) | 17mo | $181,000 | $100 | 50 |
| 146-148 E Main St | 0.71mi | 6/2.0 | 2,048 (-1%) | 20mo | $160,500 | $78 | 49 |
Match score weights: distance 35% · size 25% · config 20% · recency 20%. Top-matched comps best support the ARV.
Projected returns pro-forma
-3.0% appreciation · 8.0% rent growth · sell at horizon
- IRR
- 50.8%
- Equity multiple
- 3.39×
- Total profit
- $83,486
- Equity at exit
- $18,638
- IRR
- 58.2%
- Equity multiple
- 8.28×
- Total profit
- $254,876
- Equity at exit
- $10,808
Cash invested: $35,000 (down + closing). Projections, not guarantees.
Landlord ↔ Tenant lean methodology
- Overall (STATE)
- 15 Strongly Tenant-Friendly
- State New York
- 15 Strongly Tenant-Friendly · D+10
- County
- — inherits STATE
- City
- — inherits STATE
ZIP-level market 13601
- Home prices YoY
- -5.6%
- Rents YoY
- 10.0%
- Active inventory
- 224
- Price-to-rent
- 6.2×
Monthly cashflow live
- Estimated rent
- $2,814 high interval (Pro) →
- Mortgage (P&I)
- −$656
- Tax from tax record
- −$120 /mo · $1,445/yr
- Insurance
- −$52
- HOA
- −$0
- Vacancy / Maint / Mgmt
- −$591
- Net cashflow
- $1,395
Break-even live
Sensitivity live
| Price | -10% $1,466 | -5% $1,430 | +0% $1,395 | +5% $1,360 | +10% $1,324 |
|---|---|---|---|---|---|
| Rent | -10% $1,173 | -5% $1,284 | +0% $1,395 | +5% $1,506 | +10% $1,617 |
| Rate | -1.0pp $1,458 | -0.5pp $1,427 | base $1,395 | +0.5pp $1,363 | +1.0pp $1,330 |
2-unit breakdown (identical units grouped — click to expand)
| Units | Beds | Baths | Est. rent |
|---|---|---|---|
| 1× unit | 4 | 1 | $1,692 |
| 1× unit | 0 | 0 | $1,122 |
| Total (2 units) | $2,814 | ||
UW: 25.0% down · 7.5% · 30yr · 1.5% tax · 5.0% vac · 8.0% maint · 8.0% mgmt
Financing live
Cash to close
- Down payment
- $31,250
- Closing costs
- $3,750
- Reserves months
- —
- Total cash needed
- —
Loan-product check · same deal, 3 products live
Conventional
25% down · 7.5% · 30yr
- Down + closing
- —
- Monthly P&I
- —
- Monthly cashflow
- —
- DSCR
- —
- Eligible?
- —
Personal DTI + credit; lowest rate.
DSCR
20% down · 8.5% · 30yr
- Down + closing
- —
- Monthly P&I
- —
- Monthly cashflow
- —
- DSCR
- —
- Eligible?
- —
No personal income docs; deal must DSCR.
Hard money
10% down · 12.0% · 12mo
- Down + closing
- —
- Monthly P&I
- —
- Monthly cashflow
- —
- DSCR
- —
- Eligible?
- —
Short-term bridge; refi at stabilization.
Listing history 18 events
-
2026-06-21days on market $125,000 Active 48 DOM
-
2026-06-19days on market $125,000 Active 46 DOM
-
2026-06-18days on market $125,000 Active 45 DOM
-
2026-06-17days on market $125,000 Active 44 DOM
-
2026-06-16days on market $125,000 Active 43 DOM
-
2026-06-15days on market $125,000 Active 42 DOM
-
2026-06-14days on market $125,000 Active 40 DOM
-
2026-06-12days on market $125,000 Active 39 DOM
-
2026-06-09days on market $125,000 Active 36 DOM
-
2026-06-08days on market $125,000 Active 35 DOM
-
2026-06-07days on market $125,000 Active 34 DOM
-
2026-06-05days on market $125,000 Active 31 DOM
-
2026-06-03days on market $125,000 Active 30 DOM
-
2026-06-02days on market $125,000 Active 29 DOM
-
2026-06-01days on market $125,000 Active 28 DOM
-
2026-05-31days on market $125,000 Active 27 DOM
-
2026-05-30days on market $125,000 Active 26 DOM
-
2026-05-04$134,900 Active 1167-char remark
ⓘ Source: listings_history table (triggers on properties + properties_extension) + one-shot
backfill from property_details.listing_events for pre-trigger history.
Tax reassessment forecast NY · Partial reset (capped growth)
- Current annual tax
- $1,445 · $120/mo
- Projected year-2 tax
- $1,779 · $148/mo
- Expected delta
- +$334/yr (+$28/mo · 23.1%)
ⓘ Screening estimate from a state-policy table — verify with the county assessor before closing.
Climate risk First Street
- Flood 1/10 Low FEMA zone X · 0% chance over 30 yrs
- Wildfire 1/10 Low
- Heat 2/10 Low 7 d/yr ≥91°F today · 15 d/yr by 30 yrs out
- Wind 1/10 Low 0% chance of damaging wind over 30 yrs
- Air quality 2/10 Low 1 unhealthy d/yr today · 1 by 30 yrs out
Nearby sold comps map
Loading sold comps map…
Walkable amenities ~0.75 mi
Loading nearby amenities…
Taxation est. · year 1
- Rental income
- $33,768
- − Mortgage interest
- −$7,002
- − Property taxes
- −$1,445
- − Insurance
- −$625
- − Repairs & maintenance
- −$2,701
- − Management
- −$2,701
- − Depreciation
- −$3,636
- Taxable income
- $15,657
- Est. tax owed @ 24.0%
- −$3,758
- After-tax cash flow
- $12,983/yr
For passive investors: Depreciation is non-cash, so a rental often shows a tax loss while cash-flowing — sheltering income. Rental losses are passive: they offset passive income freely, and up to $25,000/yr can offset ordinary (W-2) income if you actively participate and your MAGI is under $100k (phasing out to $0 by $150k); unused losses carry forward. On sale, claimed depreciation is recaptured at up to 25%, and gains may owe capital-gains tax (a 1031 exchange can defer both). Figures are a year-1 estimate at your 24.0% rate — not tax advice; consult a CPA.
Schools (NCES district)
- District
- Watertown City School District
- NCES district ID
- 3630120
- Math proficiency
- 34% ▼ -10.00%
- Reading proficiency
- 54% ▲ 12.00%
- Median HH income
- $40,919
- Composite
- 36.86/100
- National rank
- #4551
- State rank
- #481 of 590 in NY
Livability — Watertown
- Score
- 68/100
- State rank
- #540
- US rank
- #9700
Category grades
Schools grade is shown separately in the Schools card above.
Census & demographics
- Census place
- Watertown, NY
- County
- Jefferson County · 47,417 people
- City population
- 36,839
- Metro
- Watertown-Fort Drum, NY
- Population (ZIP)
- 36,839
- Household income
- $58,791
- Rent vs Own
- Severe rent burden
- 1634.0
Population outlook (Jefferson County) Hauer SSP2
- Today (2025)
- 111,748 people
- By 2030
- 109,370 · -2.1%
- By 2040
- 103,828 · -7.1%
- By 2050
- 98,523 · -11.8%
- By 2075
- 91,422 · -18.2%
- By 2100
- 78,214 · -30.0%
Race, ethnicity, and origin ACS 2023
- Neighborhood character
- Predominantly White (82%)
- Race & ethnicity
- White 82% Two or more races 7% Hispanic / Latino 6% Black 4% Asian 2%
- Hispanic origin (detail)
- Mexican 2% Puerto Rican 2%
- Common ancestry
- Lithuanian 7% Romanian 3% Slovak 2%
- Foreign-born
- 4% · Canada
- Languages at home
- 94% English-only · Spanish 3% Other Indo-European 1% German/W. Germanic 1%
Political lean MEDSL · Jefferson
- 2024 margin
- Strong R (+23.6) · D 38.2% · R 61.8%
- 2008→2024 swing
- -18.3pp toward R · 2008: -5.3pp · 2024: -23.6pp
- All cycles
- 2024: R+23.6 2020: R+19.0 2016: R+22.4 2012: R+2.9 2008: R+5.3
Not yet ingested
- Civics
- —
Market trends
- HPI YoY
- ▼ -18.86%
- Current HPI
- 316.636
- Rent YoY
- ▲ 9.96%
- Metro
- Watertown-Fort Drum, NY
- State GDP YoY
- ▲ 2.60%
- F500 in state
- 92
Industry mix (Fortune 500 HQ in NY)
| Industry | F500 HQs | Revenue |
|---|---|---|
| Financial Services | 10 | $950B |
|
||
| Consumer Goods | 9 | $162B |
|
||
| Insurance | 4 | $225B |
|
||
| Telecommunications | 2 | $144B |
|
||
| Pharmaceuticals | 2 | $112B |
|
||
| Media / Entertainment | 2 | $69B |
|
||
Price history
-7.3% since first listed2 events — show timeline
- 2026-05-19 Price Changed $125,000 CNYIS
- 2026-05-04 Listed $134,900 CNYIS
Property tax history
+18.7%/yrLatest (2025): $1,445 · +3.9% YoY. Source: county tax records.
Cash-flow waterfall
monthlySold comps — $/sqft
last 12 mo · ≤1 miLoading sold comps…