1355 NE 59th Ln · Ankeny, IA
Flood risk No data
- FEMA flood zone
- —
- Chance of flooding over 30 yrs
- —
- Est. flood insurance / yr
- —
Fire risk No data
- Est. fire insurance / yr
- —
Heat risk No data
- Hot days now (above threshold)
- —
- Hot days in 30 yrs
- —
Wind risk No data
- Chance of severe wind over 30 yrs
- —
Air-quality risk No data
- Unhealthy air days now
- —
- Unhealthy air days in 30 yrs
- —
Risk factors via First Street. Map © Google.
Why this score? — see what drove the D- grade
The composite is a weighted blend of 9 inputs, each scored 0–100. Each bar is that input's sub-score; the figure is the points it added to the 100-point composite (weight × sub-score).
- Cash flow +8.1/30.0
- ARV discount +7.5/15.0
- Schools +7.5/10.0
- Livability +4.6/5.0
- 1% rule +3.5/10.0
- Rent growth +2.7/5.0
- Condition / age +2.5/5.0
- DSCR +2.1/10.0
- Appreciation +0.0/10.0
$229,990
🖨 Deal sheet 📄 Offer letter ✓ Due diligence
Listing remarks
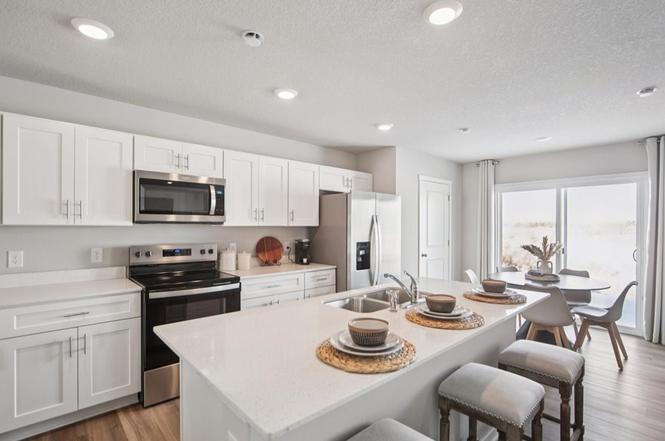
Welcome to the Sydney, a two-story townhome in Kimberley Crossing Townhomes - featuring 3 bedrooms, 2.5 bathrooms, and 1,511 sq. ft. of comfortable living space with appliances included. The inviting foyer leads to an open-concept main level where the kitchen, dining, and great room seamlessly connect—complete with a cozy electric fireplace. The kitchen is a showstopper with white cabinetry, stainless steel appliances, and a spacious island ideal for gatherings. Upstairs, all bedrooms are thoughtfully located for privacy. The primary suite offers a large walk-in closet and en-suite bath with dual vanities and a walk-in shower. Two additional bedrooms, a full bath, and an upstairs laun
Key facts
- Gourmet kitchen
- Easy access to i-35
- Great room
Tags
Neighborhood map
What this means for you Summary
Snapshot
- This is a 3-bed/2.5-bath other listed at $230k.
Deal economics
- At list price, monthly cash flow is $-225 ($-3k/yr) — negative.
- To cash-flow at today's rent, offer at most $197k (14.2% below list).
- To meet the 1% rule (rent ≥ 1% of price), the offer needs to be $196k (14.7% below list).
- Recommended offer: $196k (14.7% below list) — sets the bar for 1% rule.
- Cap rate 5.1% vs local median 2.9% in Ankeny — top-decile yield for the area; either an underpriced asset or a hidden risk that comps aren't pricing in. Stress-test before assuming the spread holds.
Location & tenants
- Location reads 92/100 on livability (#3 in IA, #29 nationally) — a professional / high-income tenant draw. Strengths: schools A+, amenities A+, employment A+; Watch: commute C-.
- North Polk Community School District (rural): math 87% / reading 84% proficiency, ranked #7 of 289 in IA (top 2%) — strong family-tenant draw, lease renewals of 3-5y typical; only 9% free/reduced lunch — higher-income household profile.
- Market conditions: Rents flat; 708 active listings in the ZIP; 5 comparable units currently listed for rent nearby; rentals at typical pace (median 14d on market — plan ~3-4 weeks tenant-placement turnaround); solid renter incomes; 2,953 units permitted in Polk County in 2024 (540 in 5+ unit buildings).
Forward outlook
- Local home prices are declining (-3.0%/yr); year-one equity from $2k of loan paydown is wiped out by about $7k of value loss. Plan a longer hold.
- Polk County population projected at +37% by 2050 — long-run rental-demand tailwind backs the buy-and-hold thesis.
Negotiation context
- It's been on market 195 days — a 12% lower offer ($202k) is reasonable based on typical stale-listing flexibility.
Questions for the listing agent
- What do current leases actually rent for vs. the listed asking? Can we see a recent rent roll and the last 12 months of T-12 income?
- It's been on market 195 days. Have you received any prior offers? Is the seller open to a 15% concession, seller financing, or rate buy-down credit?
- What does the HOA fee cover, when was the last increase, and are there any pending special assessments or reserve-fund shortfalls?
- Why hasn't it sold? Are there any deal-killer items the seller is aware of (foundation, flood, title, zoning, code violations)?
- Is there a deadline driving the sale (1031 exchange, divorce, estate, relocation)? That informs how much negotiation room exists.
- Schools are A-rated — typically a magnet for longer-tenancy family renters. What's the average tenant stay here, and is there a school-zone premium baked into asking?
- The area grade is low — what's the realistic commute time and amenity access for the typical tenant pool here? Any planned neighborhood developments (good or bad) we should know about?
- What's the average days-on-market for RENTAL listings here right now (not sales)? A rising rental-DOM trend means longer vacancies and softer asking-rent achievability than the comps imply.
- What's the recent tenant-quality profile in this submarket — average credit score on applications, eviction rate, late-payment / NSF rate, and stable-employment percentage? A property-management company in the area should have these aggregated.
- How much new for-sale + rental construction is in the pipeline within 1–3 miles? Heavy new supply typically softens prices + rents 12–24 months out; constrained supply supports both.
Investment metrics
- 1% rule
- 0.85% ✗
- Cap rate
- 5.12%
- Cash-on-cash
- -4.20%
- DSCR
- 0.81
- GRM
- 9.8
CMA / ARV
No comps found within radius.
Projected returns pro-forma
-3.0% appreciation · 0.92% rent growth · sell at horizon
- IRR
- -26.0%
- Equity multiple
- 0.14×
- Total profit
- $-55,487
- Equity at exit
- $34,292
- IRR
- -32.3%
- Equity multiple
- -0.27×
- Total profit
- $-82,027
- Equity at exit
- $19,885
Cash invested: $64,397 (down + closing). Projections, not guarantees.
Landlord ↔ Tenant lean methodology
- Overall (STATE)
- 83 Strongly Landlord-Friendly
- State Iowa
- 83 Strongly Landlord-Friendly · R+6
- County
- — inherits STATE
- City
- — inherits STATE
ZIP-level market 50021
- Rents YoY
- 0.9%
- Active inventory
- 708
- Price-to-rent
- 9.8×
Monthly cashflow live
- Estimated rent
- $1,961 high interval (Pro) →
- Mortgage (P&I)
- −$1,206
- Tax est. 1.5%
- −$287 /mo · $3,450/yr
- Insurance
- −$96
- HOA
- −$185
- Vacancy / Maint / Mgmt
- −$412
- Net cashflow
- $-225
Break-even live
UW: 25.0% down · 7.5% · 30yr · 1.5% tax · 5.0% vac · 8.0% maint · 8.0% mgmt
Financing live
Cash to close
- Down payment
- $57,498
- Closing costs
- $6,900
- Reserves months
- —
- Total cash needed
- —
Loan-product check · same deal, 3 products live
Conventional
25% down · 7.5% · 30yr
- Down + closing
- —
- Monthly P&I
- —
- Monthly cashflow
- —
- DSCR
- —
- Eligible?
- —
Personal DTI + credit; lowest rate.
DSCR
20% down · 8.5% · 30yr
- Down + closing
- —
- Monthly P&I
- —
- Monthly cashflow
- —
- DSCR
- —
- Eligible?
- —
No personal income docs; deal must DSCR.
Hard money
10% down · 12.0% · 12mo
- Down + closing
- —
- Monthly P&I
- —
- Monthly cashflow
- —
- DSCR
- —
- Eligible?
- —
Short-term bridge; refi at stabilization.
Rent comps 5 comps
| Address | Beds | Baths | Sqft | Rent | $/sqft | DOM | Units | Dist |
|---|---|---|---|---|---|---|---|---|
| 1424 NE 56th Ln Ankeny, IA | 4.0 | 2.5 | 1658 | $2,300 | $1.39 | 14d | 6 | 0.30mi |
| 4543 NE McDougal Ln Ankeny, IA | 3.0 | 3.5 | 1520 | $1,895 | $1.25 | 14d | 1 | 0.92mi |
| 3611 NE Otterview Cir Ankeny, IA | 1.0–2.0 | 1.0–2.0 | 834 | $1,800 | $2.16 | 14d | 20 | 1.26mi |
| 3921 NE Gardenia Ln Ankeny, IA | 2.0 | 1.5 | 1300 | $1,595 | $1.23 | 43d | 1 | 1.27mi |
| 2820 NE 38th St Ankeny, IA | 1.0–2.0 | 1.0–2.0 | 861 | $1,775 | $2.06 | 14d | 10 | 1.41mi |
HOA detail
- Monthly dues
- $185 · $2,220/yr
- Likely covers
- electric
Listing history 10 events
-
2026-03-23status Pending
-
2026-02-24price $229,990
-
2026-02-19price $234,990
-
2026-02-12price $232,990
-
2026-02-02price $235,990
-
2026-01-05price $233,990
-
2025-11-18price $236,990
-
2025-10-15price $239,990
-
2025-09-09$249,990 Active
-
2025-03-11soldstatus $560,000
ⓘ Source: listings_history table (triggers on properties + properties_extension) + one-shot
backfill from property_details.listing_events for pre-trigger history.
Nearby sold comps map
Loading sold comps map…
Walkable amenities ~0.75 mi
Loading nearby amenities…
Taxation est. · year 1
- Rental income
- $23,533
- − Mortgage interest
- −$12,883
- − Property taxes
- −$3,450
- − Insurance
- −$1,150
- − Repairs & maintenance
- −$1,883
- − Management
- −$1,883
- − HOA
- −$2,220
- − Depreciation
- −$6,691
- Taxable loss
- −$6,626
- Est. tax savings @ 24.0%
- +$1,590
- After-tax cash flow
- $-1,112/yr
For passive investors: Depreciation is non-cash, so a rental often shows a tax loss while cash-flowing — sheltering income. Rental losses are passive: they offset passive income freely, and up to $25,000/yr can offset ordinary (W-2) income if you actively participate and your MAGI is under $100k (phasing out to $0 by $150k); unused losses carry forward. On sale, claimed depreciation is recaptured at up to 25%, and gains may owe capital-gains tax (a 1031 exchange can defer both). Figures are a year-1 estimate at your 24.0% rate — not tax advice; consult a CPA.
Schools (NCES district)
- District
- North Polk Community School District
- NCES district ID
- 1920910
- Math proficiency
- 87% ▼ -2.00%
- Reading proficiency
- 84% ▼ -3.00%
- Median HH income
- $80,205
- Composite
- 75.13/100
- National rank
- #140
- State rank
- #7 of 289 in IA
Livability — Ankeny
- Score
- 92/100
- State rank
- #3
- US rank
- #29
Category grades
Schools grade is shown separately in the Schools card above.
Census & demographics
- Census place
- Ankeny, IA
- County
- Polk County · 453,298 people
- City population
- 76,589
- Metro
- Des Moines-West Des Moines, IA
- Population (ZIP)
- 30,283
- Household income
- $99,572
- Rent vs Own
- Severe rent burden
- 472.0
Population outlook (Polk County) Hauer SSP2
- Today (2025)
- 548,042 people
- By 2030
- 588,557 · +7.4%
- By 2040
- 670,629 · +22.4%
- By 2050
- 752,830 · +37.4%
- By 2075
- 955,069 · +74.3%
- By 2100
- 1,115,436 · +103.5%
Race, ethnicity, and origin ACS 2023
- Neighborhood character
- Predominantly White (84%)
- Race & ethnicity
- White 84% Hispanic / Latino 6% Black 5% Two or more races 4% Asian 3%
- Hispanic origin (detail)
- Mexican 5%
- Common ancestry
- Italian 5% Portuguese 4% Iranian 3%
- Foreign-born
- 6% · Canada, South Korea, Jamaica
- Languages at home
- 91% English-only · Spanish 5% Russian/Polish/Slavic 1% Other Asian/Pacific 1%
Political lean MEDSL · Polk
- 2024 margin
- D (+10.9) · D 54.8% · R 43.9% · Other 1.3%
- 2008→2024 swing
- -3.7pp toward R · 2008: 14.6pp · 2024: 10.9pp
- All cycles
- 2024: D+10.9 2020: D+15.2 2016: D+11.5 2012: D+14.2 2008: D+14.6
Not yet ingested
- Civics
- —
Market trends
- HPI YoY
- ▼ -150.38%
- Current HPI
- 208.945
- Rent YoY
- ▲ 0.92%
- Metro
- Des Moines-West Des Moines, IA
- State GDP YoY
- ▲ 2.48%
- F500 in state
- 4
Industry mix (Fortune 500 HQ in IA)
| Industry | F500 HQs | Revenue |
|---|---|---|
| Financial Services | 1 | $16B |
|
||
| Retail / Convenience | 1 | $15B |
|
||
Price history
-58.9% since first listed10 events — show timeline
- 2026-03-23 Pending — DMMLS
- 2026-02-24 Price Changed $229,990 DMMLS
- 2026-02-19 Price Changed $234,990 DMMLS
- 2026-02-12 Price Changed $232,990 DMMLS
- 2026-02-02 Price Changed $235,990 DMMLS
- 2026-01-05 Price Changed $233,990 DMMLS
- 2025-11-18 Price Changed $236,990 DMMLS
- 2025-10-15 Price Changed $239,990 DMMLS
- 2025-09-09 Listed $249,990 DMMLS
- 2025-03-11 Sold (Public Records) $560,000 Public Records
Cash-flow waterfall
monthlySold comps — $/sqft
last 12 mo · ≤1 miLoading sold comps…