102 5 1/2 St · Baltimore, MD
Flood risk 1/10 · Minimal
- FEMA flood zone
- X (unshaded)
- Chance of flooding over 30 yrs
- 0.0%
- Est. flood insurance / yr
- $473 – $860
Fire risk 1/10 · Minimal
- Est. fire insurance / yr
- $755 – $1,403
Heat risk 8/10 · Major
- Hot days now (above 103°F)
- 7 days/yr
- Hot days in 30 yrs
- 15 days/yr
Wind risk 6/10 · Moderate
- Chance of severe wind over 30 yrs
- 27.0%
Air-quality risk 4/10 · Minor
- Unhealthy air days now
- 6 days/yr
- Unhealthy air days in 30 yrs
- 7 days/yr
Risk factors via First Street. Map © Google.
Why this score? — see what drove the B- grade
The composite is a weighted blend of 9 inputs, each scored 0–100. Each bar is that input's sub-score; the figure is the points it added to the 100-point composite (weight × sub-score).
- Cash flow +30.0/30.0
- 1% rule +10.0/10.0
- DSCR +10.0/10.0
- ARV discount +7.5/15.0
- Livability +3.8/5.0
- Rent growth +2.8/5.0
- Condition / age +2.5/5.0
- Schools +1.0/10.0
- Appreciation +0.0/10.0
$80,000
🖨 Deal sheet (PDF) 📄 Offer letter ✓ Due diligence
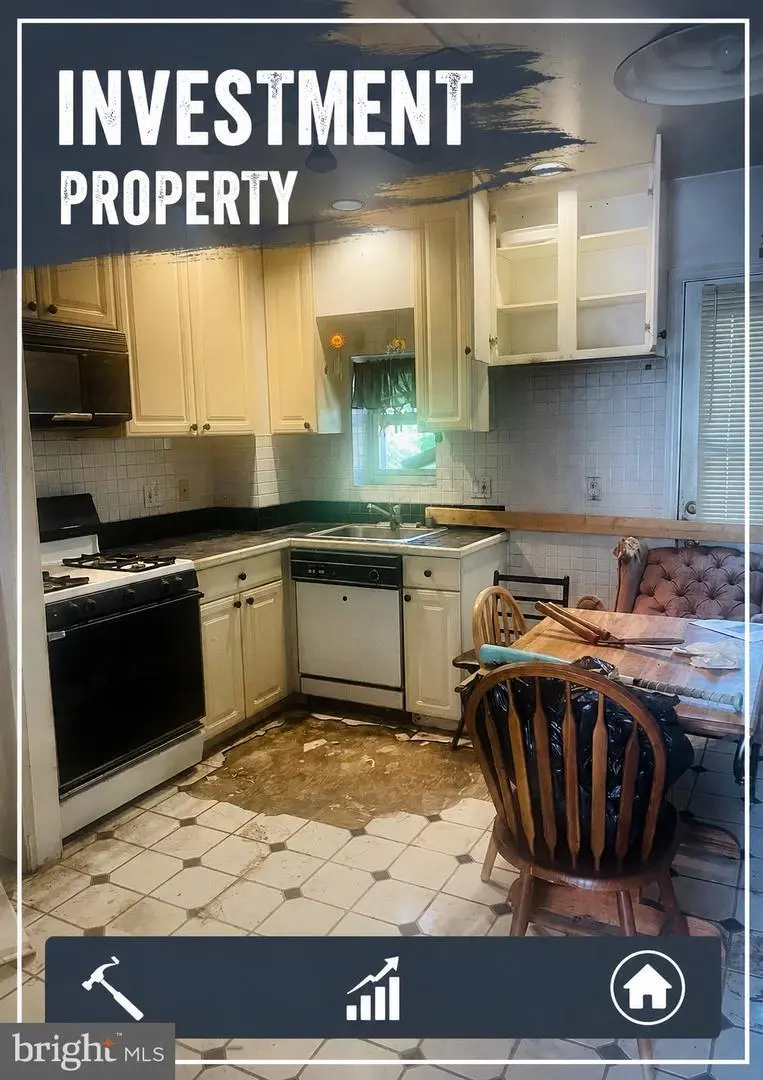
Listing remarks
small street with BIG POTENTIAL!! Complete Gut Available! Bring your ideas and make it your own! Rental potential or owner occupancy in Baltimore Highland Community. 2 bedrooms, 2 baths with a basement that was used for storage, laundry, and entertaining. Add this one to your portfolio! The seller has done the heavy lifting with removal of all contents inside. Go & Show, contact listing agent prior to any/all showings. Please DO NOT remove keys from the premises!
Key facts
- Built 1920
- Listed 31 days
Property features AI
Finance
- Other: Fee simple ownership; Not in a federal flood zone; Pets not allowed; Lease not considered
Exterior
- Parking: Asphalt driveway; Alley access; Public parking available
- Utilities: Public water; Public sewer (public hook-up available); Electric service with circuit breakers; Natural gas service available; Natural gas hot water; Municipal trash service; Internet service (other)
- Home design: Interior townhouse/rowhouse; Urban location; Outside city limits
- Construction: Brick construction; Flat rubber roof; Concrete perimeter foundation; Building not winterized; Year built estimated
- Exterior features: Other exterior features; Above-grade other structure
Interior
- Kitchen: Eat-in kitchen
- Bedrooms: Two bedrooms on the first upper level
- Bathrooms: Two full bathrooms (one on upper level, one on lower level)
- Heating & cooling: Forced air heating; Hot water heating; Natural gas available
- Interior features: Traditional floor plan; Eat-in kitchen; Walk-in shower; Drywall walls and ceilings; Partially finished combination basement
- Laundry & utility: Washer and dryer in unit; Laundry hookups in basement
Neighborhood map
What this means for you Summary
Snapshot
- This is a 2-bed/1.0-bath townhouse listed at $80k.
Deal economics
- At list price, monthly cash flow is $847 ($10k/yr) — positive.
- The deal already cash-flows at list — no discount required.
- Meets the 1% rule at list price ($2k rent vs $80k).
- Recommended offer: $78k (3.0% below list) — sets the bar for market timing.
Location & tenants
- Location reads 76/100 on livability (#90 in MD, #3,396 nationally) — a middle-class / working-renter tenant base. Strengths: amenities A+, commute A+, housing A+; Watch: crime F.
- Baltimore City Public Schools (urban): math 7% / reading 16% proficiency, ranked #24 of 24 in MD (top 100%) — low school quality limits family demand, transient renter base, plan for 1-2y turnover; 79% free/reduced lunch — lower-income household profile, screen leases tightly.
- Zoned schools: Highlandtown Elementary/Middle #237 (math 2% / reading 6%, grade F, #814 of 860 statewide, top 95%, 726 students, 59% FRL); Baltimore Polytechnic Institute (math 71% / reading 84%, grade A-, #22 of 222 statewide, top 10%, 1,555 students, 43% FRL) — zoned schools average 51% FRL vs 79% district-wide (28 pts lower); this property's tenant base skews higher-income than the district average.
- Zoned-school proficiency averages 41% at this address vs 12% district-wide (+29 pts) — the actual schools serving this property are materially stronger than the Baltimore City Public Schools average implies; a family-tenant draw the district grade alone would hide.
- Market conditions: Rents rising (+1.3%/yr); 393 active listings in the ZIP; 32 comparable units currently listed for rent nearby; rentals at typical pace (median 24d on market — plan ~3-4 weeks tenant-placement turnaround); solid renter incomes; 1,273 units permitted in Baltimore city in 2024 (1,104 in 5+ unit buildings).
Forward outlook
- Local home prices are declining (-3.0%/yr); year-one equity from $553 of loan paydown is wiped out by about $2k of value loss. Plan a longer hold.
- Baltimore County population projected to shrink 4% by 2050 — rents likely to lag national; underwrite the cash flow, not the appreciation.
- At projected returns (-3.0% appreciation + 1.3% rent growth), your $22k cash investment doubles in ~3 years — after that, you're playing with house money.
Negotiation context
- It's been on market 32 days — a 3% lower offer ($78k) is reasonable based on typical stale-listing flexibility.
- 2 sale attempts since 27y ago; this cycle's ask has dropped $20k (20%) from the opening price — seller is motivated, your offer sets the floor, not the list.
- Current owner paid $46k; list at $80k implies a 74% gain — meaningful room to come down on a strong offer.
Risks & watch-outs
- Watch-outs: built in 1920 — expect roof / HVAC / electrical / plumbing capex.
- Climate carrying-cost: major wind risk, 27% chance of damaging wind over 30y; extreme-heat days projected 7→15/yr by 2055 (HVAC capex compounding) — expect insurance premiums to compound above CPI over the hold.
Questions for the listing agent
- It's been on market 32 days. Have you received any prior offers? Is the seller open to a 3% concession, seller financing, or rate buy-down credit?
- Built in 1920 — when were the roof, HVAC, electrical panel, plumbing, and water heater last replaced?
- Is there a deadline driving the sale (1031 exchange, divorce, estate, relocation)? That informs how much negotiation room exists.
- Schools are D-rated, which usually means shorter tenancies and higher turnover. Who's the typical renter profile here, and what's been the actual vacancy rate?
- Crime grade is F in this area — have there been break-ins, vandalism, or insurance claims at this property in the last 3 years? What carrier currently insures it and at what premium?
- What's the average days-on-market for RENTAL listings here right now (not sales)? A rising rental-DOM trend means longer vacancies and softer asking-rent achievability than the comps imply.
- What's the recent tenant-quality profile in this submarket — average credit score on applications, eviction rate, late-payment / NSF rate, and stable-employment percentage? A property-management company in the area should have these aggregated.
- How much new for-sale + rental construction is in the pipeline within 1–3 miles? Heavy new supply typically softens prices + rents 12–24 months out; constrained supply supports both.
Investment metrics
- 1% rule
- 2.30% ✓
- Cap rate
- 19.00%
- Cash-on-cash
- 45.38%
- DSCR
- 3.02
- GRM
- 3.6
CMA / ARV
- ARV (on-the-fly)
- $192,290
- Comps found
- 5
Show comp detail 5 sales within ~0.75 mi
| Address | Dist | Beds/Ba | Sqft | Sold | Price | $/sf | Match |
|---|---|---|---|---|---|---|---|
| 107 S Dean St | 0.09mi | 2/1.0 | 720 (+8%) | 0mo | $104,000 | $144 | 83 |
| 228 S Haven St | 0.13mi | 2/2.5 | 720 (+8%) | 7mo | $145,000 | $201 | 69 |
| 3023 Fait Ave | 0.69mi | 1/1.5 (-1) | 693 (+3%) | 20mo | $275,000 | $397 | 39 |
| 825 S Decker Ave | 0.70mi | 2/1.0 | 748 (+12%) | 14mo | $215,000 | $287 | 37 |
| 1026 S Highland Ave | 0.71mi | 2/1.5 | 757 (+13%) | 8mo | $305,000 | $403 | 36 |
Match score weights: distance 35% · size 25% · config 20% · recency 20%. Top-matched comps best support the ARV.
Projected returns pro-forma
-3.0% appreciation · 1.31% rent growth · sell at horizon
- IRR
- 40.5%
- Equity multiple
- 2.69×
- Total profit
- $37,968
- Equity at exit
- $11,928
- IRR
- 46.0%
- Equity multiple
- 5.04×
- Total profit
- $90,560
- Equity at exit
- $6,917
Cash invested: $22,400 (down + closing). Projections, not guarantees.
Landlord ↔ Tenant lean methodology
- Overall (CITY)
- 12 Strongly Tenant-Friendly
- State Maryland
- 27 Tenant-Leaning · D+14
- County
- — inherits STATE
- City Baltimore
- 12 Strongly Tenant-Friendly · D+58
ZIP-level market 21224
- Rents YoY
- 1.3%
- Active inventory
- 393
- Price-to-rent
- 3.6×
Monthly cashflow live
- Estimated rent
- $1,843 high interval (Pro) →
- Mortgage (P&I)
- −$420
- Tax from tax record
- −$156 /mo · $1,872/yr
- Insurance
- −$33
- HOA
- −$0
- Vacancy / Maint / Mgmt
- −$387
- Net cashflow
- $847
Break-even live
Sensitivity live
| Price | -10% $892 | -5% $870 | +0% $847 | +5% $824 | +10% $802 |
|---|---|---|---|---|---|
| Rent | -10% $701 | -5% $774 | +0% $847 | +5% $920 | +10% $993 |
| Rate | -1.0pp $887 | -0.5pp $867 | base $847 | +0.5pp $826 | +1.0pp $805 |
UW: 25.0% down · 7.5% · 30yr · 1.5% tax · 5.0% vac · 8.0% maint · 8.0% mgmt
Financing live
Cash to close
- Down payment
- $20,000
- Closing costs
- $2,400
- Reserves months
- —
- Total cash needed
- —
Loan-product check · same deal, 3 products live
Conventional
25% down · 7.5% · 30yr
- Down + closing
- —
- Monthly P&I
- —
- Monthly cashflow
- —
- DSCR
- —
- Eligible?
- —
Personal DTI + credit; lowest rate.
DSCR
20% down · 8.5% · 30yr
- Down + closing
- —
- Monthly P&I
- —
- Monthly cashflow
- —
- DSCR
- —
- Eligible?
- —
No personal income docs; deal must DSCR.
Hard money
10% down · 12.0% · 12mo
- Down + closing
- —
- Monthly P&I
- —
- Monthly cashflow
- —
- DSCR
- —
- Eligible?
- —
Short-term bridge; refi at stabilization.
Rent comps 32 comps
| Address | Beds | Baths | Sqft | Rent | $/sqft | DOM | Units | Dist |
|---|---|---|---|---|---|---|---|---|
| 201 S Conkling St Baltimore, MD | 1.0 | 1.0 | 740 | $1,500 | $2.03 | 4d | 2 | 0.14mi |
| 3905 Bank St Baltimore, MD | 4.0 | 1.0–3.0 | 909 | $2,350 | $2.58 | 4d | 20 | 0.26mi |
| 3344 E Baltimore St Unit 2 Baltimore, MD | 1.0 | 1.0 | 545 | $1,250 | $2.29 | 45d | 1 | 0.27mi |
| 400 S Conkling St Unit 3 Baltimore, MD | 1.0 | 1.0 | 700 | $1,700 | $2.43 | 45d | 1 | 0.28mi |
| 3235 Eastern Ave Unit 2FL Baltimore, MD | 1.0 | 1.0 | 552 | $1,795 | $3.25 | 6d | 1 | 0.43mi |
| 3610 Dillon St Baltimore, MD | 1.0–2.0 | 1.0–2.0 | 828 | $2,820 | $3.41 | 45d | 1 | 0.63mi |
| 1211 S Eaton St Unit 8024 Baltimore, MD | 1.0 | 1.0 | 627 | $2,014 | $3.21 | 45d | 1 | 0.77mi |
| 3850 Boston St Baltimore, MD | 2.0 | 1.0–2.0 | 854 | $3,378 | $3.96 | 4d | 22 | 0.77mi |
| 1200 S Conkling St Baltimore, MD | 1.0–2.0 | 1.0–2.0 | 1085 | $2,933 | $2.70 | 3d | 16 | 0.83mi |
| 3700 Toone St Baltimore, MD | 1.0–2.0 | 1.0–2.0 | 1093 | $3,218 | $2.94 | 3d | 28 | 0.84mi |
| 3018 O Donnell St Unit 2R Baltimore, MD | 1.0 | 1.0 | 750 | $1,700 | $2.27 | 45d | 1 | 0.85mi |
| 560 Bayview Blvd Baltimore, MD | 1.0–3.0 | 1.0–3.0 | 1108 | $2,515 | $2.27 | 4d | 25 | 0.95mi |
| 400 N Rose St #1 Baltimore, MD | 1.0 | 1.0 | 588 | $1,080 | $1.84 | 45d | 1 | 0.95mi |
| 500 N Rose St Baltimore, MD | 3.0 | 2.0 | 520 | $1,200 | $2.31 | 6d | 1 | 0.99mi |
| 2309 Eastern Ave Unit B Baltimore, MD | 1.0 | 1.0 | 550 | $1,295 | $2.35 | 45d | 1 | 1.08mi |
| 107 S Collington Ave Unit 2 REAR Baltimore, MD | 1.0 | 1.0 | 600 | $1,800 | $3.00 | 6d | 1 | 1.13mi |
| 305 S Collington Ave Baltimore, MD | 3.0 | 2.5 | 722 | $2,895 | $4.01 | 19d | 1 | 1.14mi |
| 440 Elrino St Unit 2 Baltimore, MD | 1.0 | 1.0 | 750 | $1,050 | $1.40 | 25d | 1 | 1.19mi |
| 421 Elrino St Unit B Baltimore, MD | 1.0 | 1.0 | 750 | $995 | $1.33 | 25d | 1 | 1.21mi |
| 723 N Patterson Park Ave Baltimore, MD | 1.0 | 1.0 | 350 | $1,000 | $2.86 | 45d | 1 | 1.21mi |
| 6201 Eastern Ave Baltimore, MD | 1.0 | 1.0 | 650 | $1,350 | $2.08 | 45d | 1 | 1.22mi |
| 1401 N Potomac St Unit 1 Baltimore, MD | 1.0 | 1.0 | 700 | $1,099 | $1.57 | 19d | 1 | 1.26mi |
| 1323 N Kenwood Ave Unit 2 Baltimore, MD | 1.0 | 1.0 | 600 | $950 | $1.58 | 45d | 1 | 1.30mi |
| 1901 E Lombard St Baltimore, MD | 1.0 | 1.0 | 650 | $1,750 | $2.69 | 25d | 1 | 1.35mi |
| 1901 E Lombard St Apt 3 Baltimore, MD | 1.0 | 1.0 | 650 | $1,750 | $2.69 | 16d | 1 | 1.35mi |
| 1901 E Lombard St Baltimore, MD | 1.0 | 1.0 | 660 | $1,800 | $2.73 | 23d | 1 | 1.35mi |
| 1901 E Lombard St Apt 4 Baltimore, MD | 1.0 | 1.0 | 650 | $1,750 | $2.69 | 23d | 1 | 1.35mi |
| 1901 E Lombard St Apt 2 Baltimore, MD | 1.0 | 1.0 | 650 | $1,650 | $2.54 | 3d | 1 | 1.35mi |
| 1901 E Lombard St Baltimore, MD | 1.0 | 1.0 | 702 | $1,750 | $2.49 | 45d | 1 | 1.35mi |
| 1901 E Lombard St Apt 3 Baltimore, MD | 1.0 | 1.0 | 650 | $1,750 | $2.69 | 6d | 1 | 1.35mi |
| 521 S Wolfe St Unit 1R Baltimore, MD | 1.0 | 1.0 | 500 | $1,350 | $2.70 | 12d | 1 | 1.39mi |
| 1742 Fleet St Unit 302 Baltimore, MD | 1.0 | 1.0 | 524 | $1,600 | $3.05 | 6d | 1 | 1.50mi |
Listing history 20 events
-
2026-06-21days on market $80,000 Active 32 DOM
-
2026-06-18days on market $80,000 Active 29 DOM
-
2026-06-17days on market $80,000 Active 28 DOM
-
2026-06-16days on market $80,000 Active 27 DOM
-
2026-06-15days on market $80,000 Active 26 DOM
-
2026-06-13days on market $80,000 Active 24 DOM
-
2026-06-09days on market $80,000 Active 20 DOM
-
2026-06-08days on market $80,000 Active 19 DOM
-
2026-06-07days on market $80,000 Active 18 DOM
-
2026-06-04pricedays on market $80,000 Active 15 DOM
-
2026-06-03days on market $100,000 Active 14 DOM
-
2026-06-02days on market $100,000 Active 13 DOM
-
2026-06-01days on market $100,000 Active 12 DOM
-
2026-05-31days on market $100,000 Active 11 DOM
-
2026-05-20$100,000 Active
-
1999-12-02soldstatus $46,000
-
1999-09-24soldstatus $46,000
-
1999-08-01historical
-
1999-07-08$47,000
-
1994-08-12soldstatus $750
ⓘ Source: listings_history table (triggers on properties + properties_extension) + one-shot
backfill from property_details.listing_events for pre-trigger history.
Tax reassessment forecast MD · Partial reset (capped growth)
- Current annual tax
- $1,872 · $156/mo
- Projected year-2 tax
- $1,872 · $156/mo
- Expected delta
- $0/yr ($0/mo · 0.0%)
ⓘ Screening estimate from a state-policy table — verify with the county assessor before closing.
Climate risk First Street
- Flood 1/10 Low FEMA zone X (unshaded) · 0% chance over 30 yrs
- Wildfire 1/10 Low
- Heat 8/10 Severe 7 d/yr ≥103°F today · 15 d/yr by 30 yrs out
- Wind 6/10 Major 27% chance of damaging wind over 30 yrs
- Air quality 4/10 Moderate 6 unhealthy d/yr today · 7 by 30 yrs out
Nearby sold comps map
Loading sold comps map…
Walkable amenities ~0.75 mi
Loading nearby amenities…
Taxation est. · year 1
- Rental income
- $22,116
- − Mortgage interest
- −$4,481
- − Property taxes
- −$1,872
- − Insurance
- −$400
- − Repairs & maintenance
- −$1,769
- − Management
- −$1,769
- − Depreciation
- −$2,327
- Taxable income
- $9,497
- Est. tax owed @ 24.0%
- −$2,279
- After-tax cash flow
- $7,886/yr
For passive investors: Depreciation is non-cash, so a rental often shows a tax loss while cash-flowing — sheltering income. Rental losses are passive: they offset passive income freely, and up to $25,000/yr can offset ordinary (W-2) income if you actively participate and your MAGI is under $100k (phasing out to $0 by $150k); unused losses carry forward. On sale, claimed depreciation is recaptured at up to 25%, and gains may owe capital-gains tax (a 1031 exchange can defer both). Figures are a year-1 estimate at your 24.0% rate — not tax advice; consult a CPA.
Schools (NCES district)
- District
- Baltimore City Public Schools
- NCES district ID
- 2400090
- Math proficiency
- 7% ▼ -9.00%
- Reading proficiency
- 16% ▼ -5.00%
- Median HH income
- $42,108
- Composite
- 10.08/100
- National rank
- #9805
- State rank
- #24 of 24 in MD
Livability — Baltimore
- Score
- 76/100
- State rank
- #90
- US rank
- #3396
Category grades
Schools grade is shown separately in the Schools card above.
Census & demographics
- Census place
- Baltimore, MD
- County
- Baltimore City · 558,601 people
- City population
- 59,407
- Metro
- Baltimore-Columbia-Towson, MD
- Population (ZIP)
- 47,465
- Household income
- $89,017
- Rent vs Own
- Severe rent burden
- 1786.0
Population outlook (Baltimore County) Hauer SSP2
- Today (2025)
- 624,249 people
- By 2030
- 621,541 · -0.4%
- By 2040
- 609,756 · -2.3%
- By 2050
- 597,249 · -4.3%
- By 2075
- 552,236 · -11.5%
- By 2100
- 513,934 · -17.7%
Race, ethnicity, and origin ACS 2023
- Neighborhood character
- Diverse neighborhood (Simpson 0.62)
- Race & ethnicity
- White 55% Hispanic / Latino 21% Black 16% Two or more races 7% Asian 4%
- Hispanic origin (detail)
- Mexican 4% Puerto Rican 2% Dominican 1%
- Common ancestry
- Romanian 5% Lithuanian 2% Italian 1%
- Foreign-born
- 17% · Canada, China, Vietnam
- Languages at home
- 76% English-only · Spanish 18% Other Indo-European 2% Russian/Polish/Slavic 1%
Political lean MEDSL · Baltimore
- 2024 margin
- Solid D (+73.0) · D 85.2% · R 12.2% · Other 2.6%
- 2008→2024 swing
- -2.5pp toward R · 2008: 75.5pp · 2024: 73.0pp
- All cycles
- 2024: D+73.0 2020: D+76.6 2016: D+74.6 2012: D+76.4 2008: D+75.5
Not yet ingested
- Civics
- —
Market trends
- HPI YoY
- ▼ -332.23%
- Current HPI
- 241.284
- Rent YoY
- ▲ 1.31%
- Metro
- Baltimore-Columbia-Towson, MD
- State GDP YoY
- ▲ 2.97%
- F500 in state
- 12
Industry mix (Fortune 500 HQ in MD)
| Industry | F500 HQs | Revenue |
|---|---|---|
| Aerospace / Defense | 1 | $71B |
|
||
| Utilities | 1 | $25B |
|
||
| Hotels | 1 | $24B |
|
||
| Consumer Goods | 1 | $7B |
|
||
| Real Estate | 1 | $6B |
|
||
| Chemicals | 1 | $2B |
|
||
Price history
+112.8% since first listed6 events — show timeline
- 2026-05-20 Listed $100,000 BRIGHT MLS
- 1999-12-02 Sold (Public Records) $46,000 Public Records
- 1999-09-24 Sold (MLS) $46,000 MRIS
- 1999-08-01 Delisted — MRIS
- 1999-07-08 Listed $47,000 MRIS
- 1994-08-12 Sold (Public Records) $750 Public Records
Property tax history
-0.3%/yrLatest (2025): $1,872 · +5.9% YoY. Source: county tax records.
Cash-flow waterfall
monthlySold comps — $/sqft
last 12 mo · ≤1 miLoading sold comps…