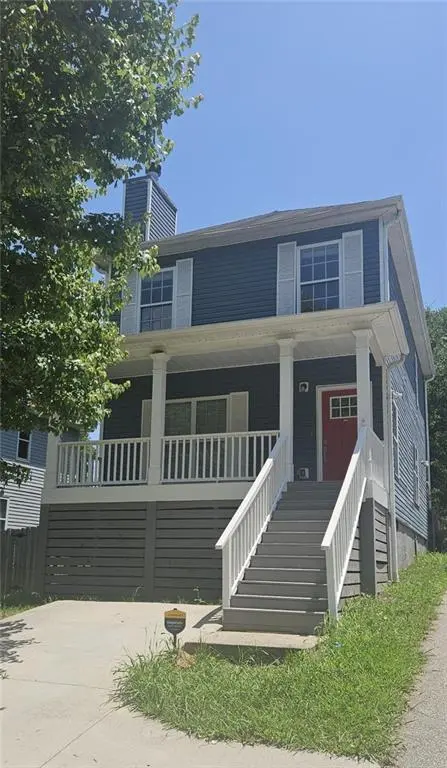
810 Metropolitan Pkwy SW · Atlanta, GA
Flood risk 1/10 · Minimal
- FEMA flood zone
- X (unshaded)
- Chance of flooding over 30 yrs
- 0.0%
- Est. flood insurance / yr
- $473 – $860
Fire risk 1/10 · Minimal
- Est. fire insurance / yr
- $963 – $1,789
Heat risk 5/10 · Moderate
- Hot days now (above 104°F)
- 7 days/yr
- Hot days in 30 yrs
- 18 days/yr
Wind risk 4/10 · Minor
- Chance of severe wind over 30 yrs
- 22.0%
Air-quality risk 4/10 · Minor
- Unhealthy air days now
- 4 days/yr
- Unhealthy air days in 30 yrs
- 6 days/yr
Risk factors via First Street. Map © Google.
Why this score? — see what drove the D grade
The composite is a weighted blend of 9 inputs, each scored 0–100. Each bar is that input's sub-score; the figure is the points it added to the 100-point composite (weight × sub-score).
- ARV discount +14.8/15.0
- Cash flow +7.8/30.0
- Livability +4.2/5.0
- Appreciation +3.7/10.0
- Rent growth +3.4/5.0
- Schools +2.7/10.0
- 1% rule +2.6/10.0
- Condition / age +2.5/5.0
- DSCR +1.9/10.0
$300,000
🖨 Deal sheet (PDF) 📄 Offer letter ✓ Due diligence
Listing remarks
* * * Over $60,000 in down payment assistance available * * * ask your lender to see how much you qualify for. * * * Special incentive for Educators and First Responders * * * Don't miss this charming spacious 3 bedrooms 2 and a half bath home. New carpet on the top level, New LVP on the first level as well as new paint throughout. The main bedroom has an en-suite with a double vanity with contemporary bowls and a large closet attached. The eat in kitchen also has a bar island with black and stainless appliances. Outside, discover a private fenced back yard and a parking pad in front. The home is also conveniently located on the Marta bus line and lots of shopping.
Key facts
- Double vanity
- New carpet
- Large closet
Tags
Property features AI
Exterior
- Parking: Driveway and parking pad; One total parking space; Open parking available
- Utilities: Public water; Public sewer; 110 volt electric; Cable available; Electricity available; Water and sewer available
- Home design: Two levels; Resale property
- Construction: HardiPlank and wood siding; Shingle roof; Brick/mortar foundation
- Exterior features: Private yard; Rear stairs; Deck; Front porch; Back yard fencing: wood privacy fence
Interior
- Kitchen: Breakfast bar; Eat-in kitchen; Pantry; Solid surface counters; View to family room; Dishwasher; Electric range
- Bedrooms: Three bedrooms on the upper level
- Flooring: Carpet; Luxury vinyl
- Bathrooms: Two full bathrooms; One half bathroom (main level); Master bath with double vanity and tub/shower combo
- Heating & cooling: Central heating (forced air); Central air; Ceiling fans
- Interior features: One fireplace (electric, factory-built, ventless) in the living room; Double vanities; Walk-in closet(s); Insulated windows; No shared/common walls
- Laundry & utility: Laundry room on main level; Laundry located in kitchen; Electric dryer hookup; Electric water heater
Neighborhood map
What this means for you Summary
Snapshot
- This is a 3-bed/2.5-bath single-family listed at $300k.
Deal economics
- At list price, monthly cash flow is $-331 ($-4k/yr) — negative.
- To cash-flow at today's rent, offer at most $241k (19.5% below list).
- To meet the 1% rule (rent ≥ 1% of price), the offer needs to be $229k (23.7% below list).
- Recommended offer: $229k (23.7% below list) — sets the bar for 1% rule.
- Cap rate 5.0% vs local median 3.1% in Atlanta — top-decile yield for the area; either an underpriced asset or a hidden risk that comps aren't pricing in. Stress-test before assuming the spread holds.
Location & tenants
- Location reads 83/100 on livability (#6 in GA, #919 nationally) — a professional / high-income tenant draw. Strengths: amenities A+, commute A+, housing A+; Watch: cost of living C-.
- Atlanta Public Schools (urban): math 28% / reading 35% proficiency, ranked #80 of 174 in GA (top 46%) — families likely to look elsewhere, expect single-tenant / working-renter base with shorter leases; 71% free/reduced lunch — lower-income household profile, screen leases tightly.
- Zoned schools: Charles L. Gideons Elementary School (math 2% / reading 8%, grade F, #1,160 of 1,228 statewide, top 98%, 343 students, 100% FRL); Sylvan Hills Middle School (math 5% / reading 12%, grade F, #439 of 470 statewide, top 94%, 445 students, 100% FRL); Carver High School Early College (math 10% / reading 24%, grade F, #269 of 424 statewide, top 65%, 575 students, 100% FRL) — zoned schools average 100% FRL vs 71% district-wide (29 pts higher); higher-poverty schools than district average — tighter screening recommended.
- Zoned-school proficiency averages 10% at this address vs 32% district-wide (-21 pts) — the specific schools serving this property underperform the Atlanta Public Schools average; the district grade overstates school quality for this exact location.
- Market conditions: Rents rising (+3.6%/yr); 39 active listings in the ZIP; 40 comparable units currently listed for rent nearby; rentals at typical pace (median 24d on market — plan ~3-4 weeks tenant-placement turnaround); 11,565 units permitted in Fulton County in 2024 (8,159 in 5+ unit buildings).
Forward outlook
- Local home prices are declining (-2.5%/yr); year-one equity from $2k of loan paydown is wiped out by about $8k of value loss. Plan a longer hold.
- Fulton County population projected at +38% by 2050 — long-run rental-demand tailwind backs the buy-and-hold thesis.
Negotiation context
- It's been on market 16 days — a 2% lower offer ($296k) is reasonable based on typical stale-listing flexibility.
- 6 sale attempts since 19y ago with the ask held roughly flat each time — persistent listings suggest the price (not the market) is what's stuck; bring a comps-based counter.
- Current owner paid $230k; 30% above their basis — modest negotiation headroom, anchor on the comps not their cost.
Risks & watch-outs
- Climate carrying-cost: extreme-heat days projected 7→18/yr by 2055 (HVAC capex compounding) — expect insurance premiums to compound above CPI over the hold.
Questions for the listing agent
- What do current leases actually rent for vs. the listed asking? Can we see a recent rent roll and the last 12 months of T-12 income?
- Is there a deadline driving the sale (1031 exchange, divorce, estate, relocation)? That informs how much negotiation room exists.
- The area grade is low — what's the realistic commute time and amenity access for the typical tenant pool here? Any planned neighborhood developments (good or bad) we should know about?
- What's the average days-on-market for RENTAL listings here right now (not sales)? A rising rental-DOM trend means longer vacancies and softer asking-rent achievability than the comps imply.
- What's the recent tenant-quality profile in this submarket — average credit score on applications, eviction rate, late-payment / NSF rate, and stable-employment percentage? A property-management company in the area should have these aggregated.
- How much new for-sale + rental construction is in the pipeline within 1–3 miles? Heavy new supply typically softens prices + rents 12–24 months out; constrained supply supports both.
Investment metrics
- 1% rule
- 0.76% ✗
- Cap rate
- 4.97%
- Cash-on-cash
- -4.73%
- DSCR
- 0.79
- GRM
- 10.9
CMA / ARV
- ARV (median comp)
- $358,418
- List price
- $300,000
- Delta
- -12.67%
- Verdict
- UNDERPRICED
- Comps
- 20 within 1.0 mi
Show comp detail 12 sales within ~0.75 mi
| Address | Dist | Beds/Ba | Sqft | Sold | Price | $/sf | Match |
|---|---|---|---|---|---|---|---|
| 881 Oakhill Ave SW | 0.16mi | 3/2.0 | 1,434 (-0%) | 1mo | $462,500 | $323 | 89 |
| 845 Metropolitan Pkwy SW | 0.07mi | 3/2.0 | 1,500 (+4%) | 4mo | $220,000 | $147 | 84 |
| 656 Shelton Ave SW | 0.13mi | 3/2.0 | 1,553 (+8%) | 3mo | $410,000 | $264 | 76 |
| 641 Ira St SW | 0.54mi | 3/2.5 | 1,480 (+3%) | 3mo | $230,000 | $155 | 68 |
| 762 Pearce St SW | 0.38mi | 3/2.0 | 1,328 (-8%) | 3mo | $488,500 | $368 | 65 |
| 865 Rose Cir SW | 0.50mi | 3/2.0 | 1,546 (+7%) | 2mo | $415,000 | $268 | 61 |
| 923 Ira St SW | 0.49mi | 4/2.0 (+1) | 1,517 (+5%) | 2mo | $160,000 | $105 | 59 |
| 1011 Allene Ave SW | 0.52mi | 2/2.0 (-1) | 1,360 (-6%) | 1mo | $415,000 | $305 | 59 |
| 911 Smith St SW | 0.44mi | 3/2.0 | 1,266 (-12%) | 0mo | $185,000 | $146 | 57 |
| 904 Ira St SW | 0.49mi | 4/2.0 (+1) | 1,560 (+8%) | 0mo | $355,000 | $228 | 56 |
| 763 Joseph E Lowery Blvd SW | 0.59mi | 3/2.0 | 1,575 (+9%) | 2mo | $303,900 | $193 | 53 |
| 885 Rose Cir | 0.53mi | 3/1.0 | 1,259 (-13%) | 2mo | $195,000 | $155 | 47 |
Match score weights: distance 35% · size 25% · config 20% · recency 20%. Top-matched comps best support the ARV.
Projected returns pro-forma
-2.54% appreciation · 3.59% rent growth · sell at horizon
- IRR
- -20.3%
- Equity multiple
- 0.26×
- Total profit
- $-62,487
- Equity at exit
- $50,881
- IRR
- -12.6%
- Equity multiple
- 0.16×
- Total profit
- $-70,586
- Equity at exit
- $36,628
Cash invested: $84,000 (down + closing). Projections, not guarantees.
Landlord ↔ Tenant lean methodology
- Overall (STATE)
- 90 Strongly Landlord-Friendly
- State Georgia
- 90 Strongly Landlord-Friendly · R+3
- County
- — inherits STATE
- City
- — inherits STATE
ZIP-level market 30303
- Home prices YoY
- -2.0%
- Rents YoY
- 3.6%
- Active inventory
- 39
- Price-to-rent
- 10.9×
Monthly cashflow live
- Estimated rent
- $2,288 high interval (Pro) →
- Mortgage (P&I)
- −$1,573
- Tax from tax record
- −$440 /mo · $5,285/yr
- Insurance
- −$125
- HOA
- −$0
- Vacancy / Maint / Mgmt
- −$480
- Net cashflow
- $-331
Break-even live
Sensitivity live
| Price | -10% $-161 | -5% $-246 | +0% $-331 | +5% $-416 | +10% $-501 |
|---|---|---|---|---|---|
| Rent | -10% $-512 | -5% $-422 | +0% $-331 | +5% $-241 | +10% $-150 |
| Rate | -1.0pp $-180 | -0.5pp $-255 | base $-331 | +0.5pp $-409 | +1.0pp $-488 |
UW: 25.0% down · 7.5% · 30yr · 1.5% tax · 5.0% vac · 8.0% maint · 8.0% mgmt
Financing live
Cash to close
- Down payment
- $75,000
- Closing costs
- $9,000
- Reserves months
- —
- Total cash needed
- —
Loan-product check · same deal, 3 products live
Conventional
25% down · 7.5% · 30yr
- Down + closing
- —
- Monthly P&I
- —
- Monthly cashflow
- —
- DSCR
- —
- Eligible?
- —
Personal DTI + credit; lowest rate.
DSCR
20% down · 8.5% · 30yr
- Down + closing
- —
- Monthly P&I
- —
- Monthly cashflow
- —
- DSCR
- —
- Eligible?
- —
No personal income docs; deal must DSCR.
Hard money
10% down · 12.0% · 12mo
- Down + closing
- —
- Monthly P&I
- —
- Monthly cashflow
- —
- DSCR
- —
- Eligible?
- —
Short-term bridge; refi at stabilization.
Rent comps 40 comps
| Address | Beds | Baths | Sqft | Rent | $/sqft | DOM | Units | Dist |
|---|---|---|---|---|---|---|---|---|
| 776 Metropolitan Pkwy SW Atlanta, GA | 2.0 | 2.0 | 1062 | $2,165 | $2.04 | 0d | 2 | 0.08mi |
| 802 Lowndes Ave SW Atlanta, GA | 3.0 | 2.0 | 1872 | $2,550 | $1.36 | 24d | 1 | 0.19mi |
| 564 Hope St SW Unit A Atlanta, GA | 4.0 | 2.0 | 1188 | $2,300 | $1.94 | 26d | 1 | 0.21mi |
| 806 Murphy Ave SW Atlanta, GA | 1.0–2.0 | 1.0 | 825 | $1,254 | $1.52 | 26d | 8 | 0.22mi |
| 906 Allene Ave SW Atlanta, GA | 3.0 | 2.0 | 1500 | $3,500 | $2.33 | 24d | 1 | 0.37mi |
| 840 Smith St SW Unit A Atlanta, GA | 2.0 | 1.5 | 910 | $1,550 | $1.70 | 18d | 1 | 0.42mi |
| 404 Bass St SW Atlanta, GA | 3.0 | 2.0 | 1080 | $1,850 | $1.71 | 18d | 1 | 0.43mi |
| 827 Elbert St SW Atlanta, GA | 3.0 | 2.0 | 1300 | $2,900 | $2.23 | 26d | 1 | 0.50mi |
| 1063 Metropolitan Pkwy SW Atlanta, GA | 4.0 | 2.0 | 1700 | $1,700 | $1.00 | 26d | 1 | 0.50mi |
| 610 Fletcher St SW Atlanta, GA | 3.0 | 2.5 | 1550 | $2,100 | $1.35 | 26d | 1 | 0.51mi |
| 706 Catherine St SW Atlanta, GA | 3.0 | 2.0 | 1352 | $2,200 | $1.63 | 9d | 1 | 0.53mi |
| 706 Catherine St SW Atlanta, GA | 3.0 | 2.0 | 1352 | $2,200 | $1.63 | 1d | 1 | 0.53mi |
| 685 Garibaldi St SW Atlanta, GA | 3.0 | 2.5 | 1868 | $1,900 | $1.02 | 20d | 1 | 0.54mi |
| 903 Beecher St SW Unit 905 Beecher Atlanta, GA | 3.0 | 2.0 | 1500 | $4,000 | $2.67 | 24d | 1 | 0.54mi |
| 903 Beecher St SW Atlanta, GA | 3.0 | 2.0 | 1500 | $7,500 | $5.00 | 26d | 1 | 0.54mi |
| 600 Mayland Ave SW Atlanta, GA | 3.0 | 2.0 | 1100 | $2,300 | $2.09 | 26d | 1 | 0.58mi |
| 931 Oglethorpe Ave SW Atlanta, GA | 3.0 | 2.0 | 1700 | $2,800 | $1.65 | 1d | 1 | 0.63mi |
| 1133 Mayland Cir SW Atlanta, GA | 3.0 | 2.0 | 1120 | $3,600 | $3.21 | 26d | 1 | 0.63mi |
| 1040 Smith St SW Atlanta, GA | 3.0 | 2.5 | 1500 | $1,595 | $1.06 | 26d | 1 | 0.63mi |
| 1135 Coleman St SW Atlanta, GA | 3.0 | 2.5 | 1353 | $1,795 | $1.33 | 26d | 1 | 0.66mi |
| 1135 Coleman St SW Atlanta, GA | 3.0 | 2.5 | 1353 | $1,795 | $1.33 | 1d | 1 | 0.66mi |
| 1048 Garibaldi St SW Atlanta, GA | 2.0 | 2.0 | 1280 | $2,150 | $1.68 | 26d | 1 | 0.69mi |
| 818 Peeples St SW Atlanta, GA | 2.0 | 1.0 | 936 | $1,500 | $1.60 | 26d | 1 | 0.70mi |
| 235 Dodd Ave SW Atlanta, GA | 2.0 | 2.0 | 1120 | $1,595 | $1.42 | 1d | 1 | 0.71mi |
| 898 Oak St SW #3203 Atlanta, GA | 2.0 | 2.0 | 1208 | $2,000 | $1.66 | 6d | 1 | 0.73mi |
| 504 Dunbar St SW Atlanta, GA | 3.0 | 2.5 | 1728 | $1,625 | $0.94 | 1d | 1 | 0.74mi |
| 504 Dunbar St SW Atlanta, GA | 3.0 | 2.5 | 1728 | $1,625 | $0.94 | 26d | 1 | 0.74mi |
| 1151 Smith St SW Atlanta, GA | 3.0 | 2.5 | 1728 | $1,100 | $0.64 | 26d | 1 | 0.76mi |
| 1153 Smith St SW Atlanta, GA | 3.0 | 2.5 | 1728 | $2,023 | $1.17 | 14d | 1 | 0.77mi |
| 396 Rawson St SW Unit 12 Atlanta, GA | 2.0 | 1.0 | 1000 | $2,100 | $2.10 | 1d | 1 | 0.80mi |
| 1187 McDaniel St SW Unit B Atlanta, GA | 2.0 | 1.0 | 1038 | $1,025 | $0.99 | 14d | 1 | 0.81mi |
| 561 Formwalt St SW Atlanta, GA | 2.0 | 2.0 | 1000 | $1,600 | $1.60 | 26d | 1 | 0.82mi |
| 1175 Garibaldi St SW Atlanta, GA | 3.0 | 2.5 | 1364 | $2,295 | $1.68 | 1d | 1 | 0.85mi |
| 1246 Allene Ave SW Atlanta, GA | 2.0 | 1.0–2.0 | 896 | $2,110 | $2.35 | 1d | 21 | 0.86mi |
| 1093 West Ave SW Atlanta, GA | 2.0 | 1.0–2.0 | 770 | $1,414 | $1.84 | 1d | 6 | 0.86mi |
| 346 Peters St SW #102 Atlanta, GA | 2.0 | 1.0 | 1080 | $3,150 | $2.92 | 20d | 1 | 0.87mi |
| 1141 Moton Ave SW Atlanta, GA | 3.0 | 3.0 | 1584 | $2,800 | $1.77 | 26d | 1 | 0.90mi |
| 600 Greensferry Ave SW Atlanta, GA | 1.0–3.0 | 1.0–2.0 | 949 | $1,590 | $1.68 | 9d | 16 | 0.90mi |
| 547 Erin Ave SW Atlanta, GA | 3.0 | 2.0 | 1400 | $5,000 | $3.57 | 4d | 1 | 0.92mi |
| 547 Erin Ave SW Atlanta, GA | 3.0 | 2.0 | 1394 | $2,600 | $1.87 | 26d | 1 | 0.92mi |
Listing history 31 events
-
2026-06-21days on market $300,000 Active 16 DOM
-
2026-06-18days on market $300,000 Active 13 DOM
-
2026-06-17days on market $300,000 Active 12 DOM
-
2026-06-16days on market $300,000 Active 11 DOM
-
2026-06-15days on market $300,000 Active 10 DOM
-
2026-06-13days on market $300,000 Active 8 DOM
-
2026-06-13pricedays on market $300,000 Active 7 DOM
-
2026-06-09days on market $310,900 Active 4 DOM
-
2026-06-08days on market $310,900 Active 3 DOM
-
2026-06-07remarks 685-char remark
-
2026-06-07pricedays on market $310,900 Active 2 DOM
-
2026-04-29$313,000 Active 677-char remark
-
2026-04-19historical
-
2026-04-10price $310,900
-
2026-03-16price $315,900
-
2026-02-22$318,900 Active
-
2025-12-14historical
-
2025-12-04price $325,000
-
2025-11-13$330,000 Active
-
2025-11-02historical
-
2025-09-02$330,000 Active
-
2020-07-10soldstatus $230,000
-
2018-04-13soldstatus $165,000
-
2018-04-05soldstatus $165,000 Sold
-
2018-04-04status Under Contract
-
2018-01-22$169,999 New
-
2017-10-05soldstatus $53,000
-
2017-10-05soldstatus $73,000
-
2014-06-20soldstatus $47,400
-
2007-12-07soldstatus $65,000
-
2007-11-09$69,900
ⓘ Source: listings_history table (triggers on properties + properties_extension) + one-shot
backfill from property_details.listing_events for pre-trigger history.
Tax reassessment forecast GA · Resets to sale price
- Current annual tax
- $5,285 · $440/mo
- Projected year-2 tax
- $5,285 · $440/mo
- Expected delta
- $0/yr ($0/mo · 0.0%)
ⓘ Screening estimate from a state-policy table — verify with the county assessor before closing.
Climate risk First Street
- Flood 1/10 Low FEMA zone X (unshaded) · 0% chance over 30 yrs
- Wildfire 1/10 Low
- Heat 5/10 Major 7 d/yr ≥104°F today · 18 d/yr by 30 yrs out
- Wind 4/10 Moderate 22% chance of damaging wind over 30 yrs
- Air quality 4/10 Moderate 4 unhealthy d/yr today · 6 by 30 yrs out
Nearby sold comps map
Loading sold comps map…
Walkable amenities ~0.75 mi
Loading nearby amenities…
Taxation est. · year 1
- Rental income
- $27,455
- − Mortgage interest
- −$16,805
- − Property taxes
- −$5,285
- − Insurance
- −$1,500
- − Repairs & maintenance
- −$2,196
- − Management
- −$2,196
- − Depreciation
- −$8,727
- Taxable loss
- −$9,255
- Est. tax savings @ 24.0%
- +$2,221
- After-tax cash flow
- $-1,754/yr
For passive investors: Depreciation is non-cash, so a rental often shows a tax loss while cash-flowing — sheltering income. Rental losses are passive: they offset passive income freely, and up to $25,000/yr can offset ordinary (W-2) income if you actively participate and your MAGI is under $100k (phasing out to $0 by $150k); unused losses carry forward. On sale, claimed depreciation is recaptured at up to 25%, and gains may owe capital-gains tax (a 1031 exchange can defer both). Figures are a year-1 estimate at your 24.0% rate — not tax advice; consult a CPA.
Schools (NCES district)
- District
- Atlanta Public Schools
- NCES district ID
- 1300120
- Math proficiency
- 28% ▼ -6.00%
- Reading proficiency
- 35% ▼ -2.00%
- Median HH income
- $48,306
- Composite
- 27.27/100
- National rank
- #7006
- State rank
- #80 of 174 in GA
Livability — Atlanta
- Score
- 83/100
- State rank
- #6
- US rank
- #919
Category grades
Schools grade is shown separately in the Schools card above.
Census & demographics
- Census place
- Atlanta, GA
- County
- Fulton County · 1,094,430 people
- City population
- 629,525
- Metro
- Atlanta-Sandy Springs-Alpharetta, GA
- Population (ZIP)
- 6,797
- Rent vs Own
- Severe rent burden
- 603.0
Population outlook (Fulton County) Hauer SSP2
- Today (2025)
- 1,203,707 people
- By 2030
- 1,299,706 · +8.0%
- By 2040
- 1,488,256 · +23.6%
- By 2050
- 1,664,580 · +38.3%
- By 2075
- 2,036,072 · +69.2%
- By 2100
- 2,222,402 · +84.6%
Race, ethnicity, and origin ACS 2023
- Neighborhood character
- Diverse neighborhood (Simpson 0.64)
- Race & ethnicity
- Black 52% White 29% Asian 9% Hispanic / Latino 8% Two or more races 5%
- Hispanic origin (detail)
- Common ancestry
- Lithuanian 3% Serbian 2% Slovak 1%
- Foreign-born
- 9% · Canada, China, Guatemala
- Languages at home
- 85% English-only · Spanish 4% Other Indo-European 4% Other Asian/Pacific 3%
Political lean MEDSL · Fulton
- 2024 margin
- Solid D (+44.9) · D 71.9% · R 27.0% · Other 1.1%
- 2008→2024 swing
- +9.8pp toward D · 2008: 35.0pp · 2024: 44.9pp
- All cycles
- 2024: D+44.9 2020: D+46.4 2016: D+42.1 2012: D+29.6 2008: D+35.0
Not yet ingested
- Civics
- —
Market trends
- HPI YoY
- ▼ -2.54%
- Current HPI
- 125.7242
- Rent YoY
- ▲ 3.59%
- Metro
- Atlanta-Sandy Springs-Alpharetta, GA
- State GDP YoY
- ▲ 2.66%
- F500 in state
- 28
Industry mix (Fortune 500 HQ in GA)
| Industry | F500 HQs | Revenue |
|---|---|---|
| Paper / Packaging | 2 | $29B |
|
||
| Retail | 1 | $160B |
|
||
| Transportation / Logistics | 1 | $91B |
|
||
| Airlines | 1 | $62B |
|
||
| Consumer Goods | 1 | $47B |
|
||
| Utilities | 1 | $25B |
|
||
Price history
+329.2% since first listed21 events — show timeline
- 2026-06-12 Price Changed $300,000 FMLS
- 2026-06-05 Listed $310,900 FMLS
- 2026-04-19 Listing Removed — FMLS
- 2026-04-10 Price Changed $310,900 FMLS
- 2026-03-16 Price Changed $315,900 FMLS
- 2026-02-22 Listed $318,900 FMLS
- 2025-12-14 Listing Removed — FMLS
- 2025-12-04 Price Changed $325,000 FMLS
- 2025-11-13 Listed $330,000 FMLS
- 2025-11-02 Listing Removed — FMLS
- 2025-09-02 Listed $330,000 FMLS
- 2020-07-10 Sold (Public Records) $230,000 Public Records
- 2018-04-13 Sold (Public Records) $165,000 Public Records
- 2018-04-05 Sold (MLS) $165,000 GAMLS
- 2018-04-04 Pending — GAMLS
- 2018-01-22 Listed $169,999 GAMLS
- 2017-10-05 Sold (Public Records) $73,000 Public Records
- 2017-10-05 Sold (Public Records) $53,000 Public Records
- 2014-06-20 Sold (Public Records) $47,400 Public Records
- 2007-12-07 Sold (MLS) $65,000 FMLS
- 2007-11-09 Listed $69,900 FMLS
Property tax history
+7.5%/yrLatest (2025): $5,285 · -0.1% YoY. Source: county tax records.
Cash-flow waterfall
monthlySold comps — $/sqft
last 12 mo · ≤1 miLoading sold comps…