 🏗️ New Construction
The Congaree Plan · Josephine, TX
Flood risk 1/10 · Minimal
- FEMA flood zone
- X (unshaded)
- Chance of flooding over 30 yrs
- 0.0%
- Est. flood insurance / yr
- $507 – $1,088
Fire risk 3/10 · Minor
- Est. fire insurance / yr
- $1,222 – $2,270
Heat risk 8/10 · Major
- Hot days now (above 110°F)
- 7 days/yr
- Hot days in 30 yrs
- 23 days/yr
Wind risk 6/10 · Moderate
- Chance of severe wind over 30 yrs
- 27.0%
Air-quality risk 2/10 · Minimal
- Unhealthy air days now
- 1 days/yr
- Unhealthy air days in 30 yrs
- 1 days/yr
Risk factors via First Street. Map © Google.
Why this score? — see what drove the C- grade
The composite is a weighted blend of 9 inputs, each scored 0–100. Each bar is that input's sub-score; the figure is the points it added to the 100-point composite (weight × sub-score).
- Cash flow +12.8/30.0
- Appreciation +10.0/10.0
- ARV discount +7.5/15.0
- Condition / age +4.0/5.0
- DSCR +3.8/10.0
- 1% rule +3.6/10.0
- Schools +3.2/10.0
- Livability +3.0/5.0
- Rent growth +2.5/5.0
$268,990
🖨 Deal sheet 📄 Offer letter ✓ Due diligence
Listing remarks
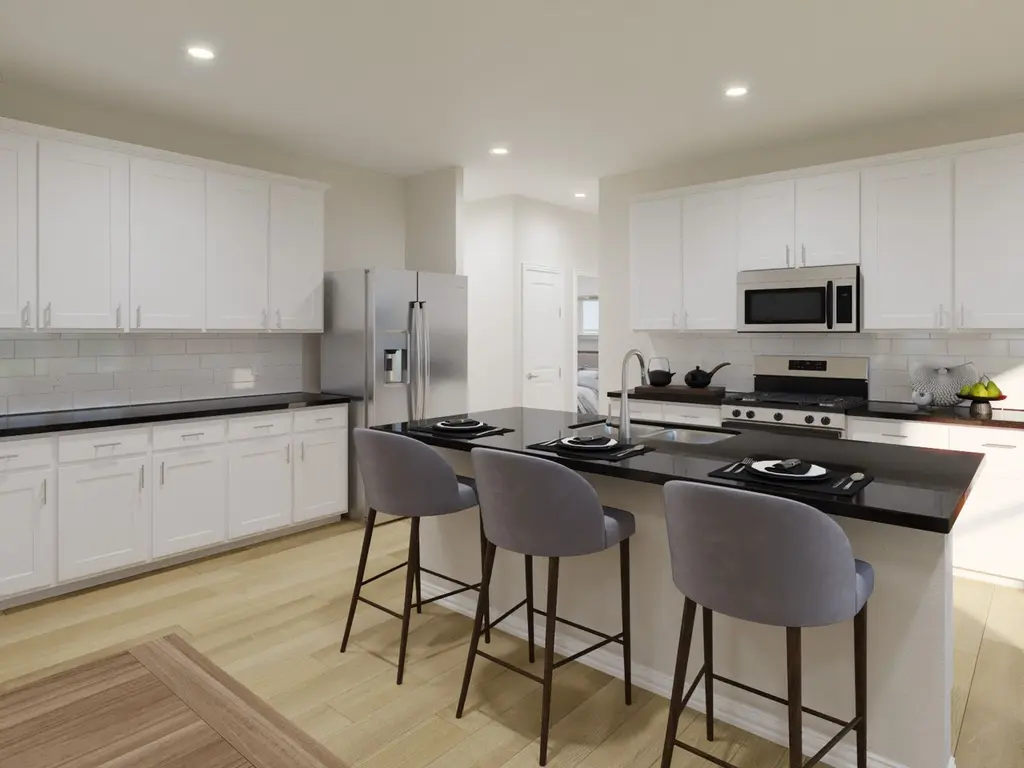
Unwind after a long day in the Congaree's relaxing primary suite, complete with a spa-like primary bathroom. The expansive kitchen island makes a great buffet or informal dining area.
Key facts
- 2 garage spots
- Listed 35 days
Tags
Property features AI
Finance
- Other: Address: 303 Eldora Dr, Josephine TX 75173; Status: Active
- Financial info: List price $268,990
Exterior
- Parking: 2 garage spaces (2 total parking spaces)
- Home design: The Congaree plan; Single-family (new construction)
- Construction: New construction (plan inventory type); Built 2026 (listing year)
- Exterior features: Living area approximately 1505
Interior
- Kitchen: Kitchen included (appliances not specified)
- Bedrooms: 3 bedrooms
- Bathrooms: 2 full bathrooms
- Interior features: Open living area (per plan); New construction plan
Neighborhood map
What this means for you Summary
Snapshot
- This is a 3-bed/2.0-bath single-family listed at $269k. Condition is rated good.
Deal economics
- At list price, monthly cash flow is $-25 ($-295/yr) — negative.
- To cash-flow at today's rent, offer at most $247k (8.1% below list).
- To meet the 1% rule (rent ≥ 1% of price), the offer needs to be $216k (19.6% below list).
- Recommended offer: $216k (19.6% below list) — sets the bar for 1% rule.
- Cap rate 6.2% vs local median 4.4% in Josephine — top-decile yield for the area; either an underpriced asset or a hidden risk that comps aren't pricing in. Stress-test before assuming the spread holds.
Location & tenants
- Location reads 60/100 on livability (#1,076 in TX) — a middle-class / working-renter tenant base. Strengths: cost of living A+, housing A+, crime A-; Watch: schools F, amenities F, commute F.
- Community ISD (rural): math 30% / reading 38% proficiency, ranked #479 of 826 in TX (top 58%) — families likely to look elsewhere, expect single-tenant / working-renter base with shorter leases.
- Market conditions: 421 active listings in the ZIP; 9 comparable units currently listed for rent nearby; rentals leasing fast (median 10d on market — plan ~1-2 weeks tenant-placement turnaround); 19,194 units permitted in Collin County in 2024 (3,988 in 5+ unit buildings).
Forward outlook
- In year one you build about $27k of equity ($2k loan paydown + $25k appreciation (10.0% local appreciation)).
- Collin County population projected at +60% by 2050 — long-run rental-demand tailwind backs the buy-and-hold thesis.
- At projected returns (10.0% appreciation + 3.0% rent growth), your $70k cash investment doubles in ~3 years — after that, you're playing with house money.
- By year 2, paydown + projected appreciation supports a ~$43k cash-out refi (75% LTV) — recoverable capital for the next deal without selling this one.
Negotiation context
- It's been on market 35 days — a 3% lower offer ($261k) is reasonable based on typical stale-listing flexibility.
Risks & watch-outs
- Climate carrying-cost: major wind risk, 27% chance of damaging wind over 30y; extreme-heat days projected 7→23/yr by 2055 (HVAC capex compounding) — expect insurance premiums to compound above CPI over the hold.
Questions for the listing agent
- What do current leases actually rent for vs. the listed asking? Can we see a recent rent roll and the last 12 months of T-12 income?
- It's been on market 35 days. Have you received any prior offers? Is the seller open to a 20% concession, seller financing, or rate buy-down credit?
- Is there a deadline driving the sale (1031 exchange, divorce, estate, relocation)? That informs how much negotiation room exists.
- Schools are F-rated, which usually means shorter tenancies and higher turnover. Who's the typical renter profile here, and what's been the actual vacancy rate?
- What's the average days-on-market for RENTAL listings here right now (not sales)? A rising rental-DOM trend means longer vacancies and softer asking-rent achievability than the comps imply.
- What's the recent tenant-quality profile in this submarket — average credit score on applications, eviction rate, late-payment / NSF rate, and stable-employment percentage? A property-management company in the area should have these aggregated.
- How much new for-sale + rental construction is in the pipeline within 1–3 miles? Heavy new supply typically softens prices + rents 12–24 months out; constrained supply supports both.
Investment metrics
- 1% rule
- 0.86% ✗
- Cap rate
- 6.18%
- Cash-on-cash
- -0.42%
- DSCR
- 0.98
- GRM
- 9.7
CMA / ARV
- ARV (median comp)
- $250,703
- List price
- $268,990
- Delta
- 7.29%
- Verdict
- FAIR
- Comps
- 20 within 1.0 mi
Show comp detail 12 sales within ~0.75 mi
| Address | Dist | Beds/Ba | Sqft | Sold | Price | $/sf | Match |
|---|---|---|---|---|---|---|---|
| 1402 Centerline Dr | 0.49mi | 3/2.0 | 1,620 (+8%) | 2mo | $309,990 | $191 | 63 |
| 913 W Cook St | 0.65mi | 3/2.0 | 1,527 (+2%) | 7mo | $525,000 | $344 | 61 |
| 806 Independence | 0.47mi | 3/2.0 | 1,420 (-6%) | 9mo | $245,000 | $173 | 61 |
| 806 Lexington | 0.55mi | 3/2.0 | 1,589 (+6%) | 12mo | $261,990 | $165 | 55 |
| 828 Lexington Ln | 0.51mi | 3/2.0 | 1,589 (+6%) | 15mo | $270,000 | $170 | 55 |
| 808 Lexington | 0.53mi | 3/2.0 | 1,420 (-6%) | 14mo | $286,500 | $202 | 54 |
| 817 Lexington | 0.52mi | 3/2.0 | 1,636 (+9%) | 12mo | $255,990 | $156 | 51 |
| 492 Milton St | 0.72mi | 3/2.5 | 1,454 (-3%) | 14mo | $275,000 | $189 | 47 |
| 114 Cotton Cir | 0.57mi | 3/2.0 | 1,288 (-14%) | 9mo | $233,000 | $181 | 42 |
| 507 Fountain View Ln | 0.72mi | 4/2.0 (+1) | 1,621 (+8%) | 12mo | $257,000 | $159 | 38 |
| 835 Lexington | 0.47mi | 4/2.0 (+1) | 1,721 (+14%) | 16mo | $305,990 | $178 | 36 |
| 704 Savanna Dr | 0.73mi | 3/2.0 | 1,310 (-13%) | 13mo | $239,900 | $183 | 34 |
Match score weights: distance 35% · size 25% · config 20% · recency 20%. Top-matched comps best support the ARV.
Projected returns pro-forma
10.0% appreciation · 3.0% rent growth · sell at horizon
- IRR
- 24.0%
- Equity multiple
- 2.92×
- Total profit
- $135,006
- Equity at exit
- $225,853
- IRR
- 21.3%
- Equity multiple
- 6.68×
- Total profit
- $398,867
- Equity at exit
- $487,061
Cash invested: $70,197 (down + closing). Projections, not guarantees.
Landlord ↔ Tenant lean methodology
- Overall (STATE)
- 87 Strongly Landlord-Friendly
- State Texas
- 87 Strongly Landlord-Friendly · R+5
- County
- — inherits STATE
- City
- — inherits STATE
ZIP-level market 75173
- Home prices YoY
- 3.1%
- Active inventory
- 421
- Price-to-rent
- 10.4×
Monthly cashflow live
- Estimated rent
- $2,162 high interval (Pro) →
- Mortgage (P&I)
- −$1,315
- Tax est. 1.5%
- −$313 /mo · $3,761/yr
- Insurance
- −$104
- HOA
- −$0
- Vacancy / Maint / Mgmt
- −$454
- Net cashflow
- $-25
Break-even live
UW: 25.0% down · 7.5% · 30yr · 1.5% tax · 5.0% vac · 8.0% maint · 8.0% mgmt
Financing live
Cash to close
- Down payment
- $62,676
- Closing costs
- $7,521
- Reserves months
- —
- Total cash needed
- —
Loan-product check · same deal, 3 products live
Conventional
25% down · 7.5% · 30yr
- Down + closing
- —
- Monthly P&I
- —
- Monthly cashflow
- —
- DSCR
- —
- Eligible?
- —
Personal DTI + credit; lowest rate.
DSCR
20% down · 8.5% · 30yr
- Down + closing
- —
- Monthly P&I
- —
- Monthly cashflow
- —
- DSCR
- —
- Eligible?
- —
No personal income docs; deal must DSCR.
Hard money
10% down · 12.0% · 12mo
- Down + closing
- —
- Monthly P&I
- —
- Monthly cashflow
- —
- DSCR
- —
- Eligible?
- —
Short-term bridge; refi at stabilization.
Rent comps 9 comps
| Address | Beds | Baths | Sqft | Rent | $/sqft | DOM | Units | Dist |
|---|---|---|---|---|---|---|---|---|
| 6135 FM 547 Farmersville, TX | 4.0 | 2.5 | 1771 | $2,295 | $1.30 | 24d | 1 | 0.95mi |
| 319 Plum Dr Nevada, TX | 4.0 | 2.0 | 1587 | $1,899 | $1.20 | 10d | 1 | 1.02mi |
| 464 N Greenville St Farmersville, TX | 3.0 | 2.0 | 2000 | $3,000 | $1.50 | 1d | 1 | 1.10mi |
| 504 Saddle Blanket Dr Nevada, TX | 4.0 | 2.0 | 1649 | $1,949 | $1.18 | 15d | 1 | 1.28mi |
| 504 Saddle Blanket Dr Nevada, TX | 4.0 | 2.0 | 1649 | $1,925 | $1.17 | 6d | 1 | 1.28mi |
| 503 Saddle Blanket Dr Nevada, TX | 4.0 | 3.0 | 2077 | $2,190 | $1.05 | 43d | 1 | 1.31mi |
| 306 E Cook St Josephine, TX | 3.0 | 2.0 | 1817 | $2,100 | $1.16 | 1d | 1 | 1.35mi |
| 214 Crooked Field Dr Royse City, TX | 3.0 | 2.0 | 1398 | $1,900 | $1.36 | 24d | 1 | 1.45mi |
| 315 Pine Hollow Way Josephine, TX | 4.0 | 3.0 | 2212 | $2,300 | $1.04 | 7d | 1 | 1.49mi |
Listing history 15 events
-
2026-06-18days on market $268,990 Active 35 DOM
-
2026-06-17days on market $268,990 Active 34 DOM
-
2026-06-16days on market $268,990 Active 33 DOM
-
2026-06-15days on market $268,990 Active 32 DOM
-
2026-06-13days on market $268,990 Active 30 DOM
-
2026-06-13days on market $268,990 Active 29 DOM
-
2026-06-09days on market $268,990 Active 26 DOM
-
2026-06-08days on market $268,990 Active 25 DOM
-
2026-06-07days on market $268,990 Active 24 DOM
-
2026-06-04days on market $268,990 Active 21 DOM
-
2026-06-03days on market $268,990 Active 20 DOM
-
2026-06-02days on market $268,990 Active 19 DOM
-
2026-06-01days on market $268,990 Active 18 DOM
-
2026-05-31days on market $268,990 Active 17 DOM
-
2026-05-14$268,990 Active 183-char remark
ⓘ Source: listings_history table (triggers on properties + properties_extension) + one-shot
backfill from property_details.listing_events for pre-trigger history.
Climate risk First Street
- Flood 1/10 Low FEMA zone X (unshaded) · 0% chance over 30 yrs
- Wildfire 3/10 Moderate
- Heat 8/10 Severe 7 d/yr ≥110°F today · 23 d/yr by 30 yrs out
- Wind 6/10 Major 27% chance of damaging wind over 30 yrs
- Air quality 2/10 Low 1 unhealthy d/yr today · 1 by 30 yrs out
Nearby sold comps map
Loading sold comps map…
Walkable amenities ~0.75 mi
Loading nearby amenities…
Taxation est. · year 1
- Rental income
- $25,944
- − Mortgage interest
- −$14,043
- − Property taxes
- −$3,761
- − Insurance
- −$1,254
- − Repairs & maintenance
- −$2,076
- − Management
- −$2,076
- − Depreciation
- −$7,293
- Taxable loss
- −$4,558
- Est. tax savings @ 24.0%
- +$1,094
- After-tax cash flow
- $799/yr
For passive investors: Depreciation is non-cash, so a rental often shows a tax loss while cash-flowing — sheltering income. Rental losses are passive: they offset passive income freely, and up to $25,000/yr can offset ordinary (W-2) income if you actively participate and your MAGI is under $100k (phasing out to $0 by $150k); unused losses carry forward. On sale, claimed depreciation is recaptured at up to 25%, and gains may owe capital-gains tax (a 1031 exchange can defer both). Figures are a year-1 estimate at your 24.0% rate — not tax advice; consult a CPA.
Condition & rehab AI · 6 photos
This home is in good condition with a modern kitchen and primary bathroom. It has potential for increasing its value with exterior improvements and smart home upgrades.
Value-add opportunities
- Both Paint the exterior and landscaping — Enhances curb appeal and resale value
- Both Install a smart thermostat — Improves energy efficiency and adds a modern touch
- Both Add a smart home security system — Enhances safety and adds a modern touch
Renovation cost estimate screening
Value-add ROI direction
- Both Paint the exterior and landscaping — Enhances curb appeal and resale value ↑
- Both Install a smart thermostat — Improves energy efficiency and adds a modern touch ↑
- Both Add a smart home security system — Enhances safety and adds a modern touch ↑
ⓘ Cost ranges are severity-bucket heuristics (US national rule-of-thumb). Get contractor quotes + a written scope before underwriting a rehab budget.
Schools (NCES district)
- District
- Community ISD
- NCES district ID
- 4814850
- Math proficiency
- 30% ▼ -23.00%
- Reading proficiency
- 38% ▼ -11.00%
- Median HH income
- $71,841
- Composite
- 31.58/100
- National rank
- #5951
- State rank
- #479 of 826 in TX
Livability — Josephine
- Score
- 60/100
- State rank
- #1076
- US rank
- #19105
Category grades
Schools grade is shown separately in the Schools card above.
Census & demographics
- Population (ZIP)
- 9,284
Population outlook (Collin County) Hauer SSP2
- Today (2025)
- 1,210,074 people
- By 2030
- 1,358,201 · +12.2%
- By 2040
- 1,654,061 · +36.7%
- By 2050
- 1,937,359 · +60.1%
- By 2075
- 2,567,039 · +112.1%
- By 2100
- 2,952,048 · +144.0%
Race, ethnicity, and origin ACS 2023
- Neighborhood character
- Majority White (65%)
- Race & ethnicity
- White 65% Hispanic / Latino 28% Two or more races 15% Black 2% Native American 1%
- Hispanic origin (detail)
- Mexican 26%
- Common ancestry
- Slovak 2% Serbian 1% Iranian 1%
- Foreign-born
- 17% · Canada, Jamaica
- Languages at home
- 74% English-only · Spanish 24% Arabic 1%
Political lean MEDSL · Collin
- 2024 margin
- R (+11.1) · D 43.1% · R 54.3% · Other 2.6%
- 2008→2024 swing
- +14.4pp toward D · 2008: -25.6pp · 2024: -11.1pp
- All cycles
- 2024: R+11.1 2020: R+4.3 2016: R+17.0 2012: R+31.6 2008: R+25.6
Not yet ingested
- Civics
- —
Market trends
- HPI YoY
- ▲ 10.09%
- Current HPI
- 331.12
- Rent YoY
- —
- Metro
- —
- State GDP YoY
- ▲ 3.95%
- F500 in state
- 110
Industry mix (Fortune 500 HQ in TX)
| Industry | F500 HQs | Revenue |
|---|---|---|
| Energy | 16 | $1,198B |
|
||
| Technology | 5 | $198B |
|
||
| Engineering / Construction | 4 | $72B |
|
||
| Energy Services | 3 | $60B |
|
||
| Utilities | 3 | $41B |
|
||
| Healthcare | 2 | $330B |
|
||
Cash-flow waterfall
monthlySold comps — $/sqft
last 12 mo · ≤1 miLoading sold comps…