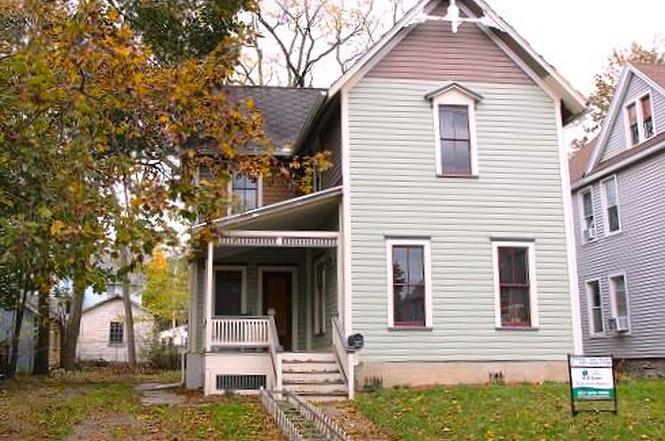
499 Fulton St · Waverly, NY
Flood risk 1/10 · Minimal
- FEMA flood zone
- X (unshaded)
- Chance of flooding over 30 yrs
- 0.0%
- Est. flood insurance / yr
- $473 – $860
Fire risk 2/10 · Minimal
- Est. fire insurance / yr
- $691 – $1,283
Heat risk 3/10 · Minor
- Hot days now (above 96°F)
- 7 days/yr
- Hot days in 30 yrs
- 16 days/yr
Wind risk 2/10 · Minimal
- Chance of severe wind over 30 yrs
- 1.0%
Air-quality risk 2/10 · Minimal
- Unhealthy air days now
- 0 days/yr
- Unhealthy air days in 30 yrs
- 1 days/yr
Risk factors via First Street. Map © Google.
Why this score? — see what drove the B+ grade
The composite is a weighted blend of 9 inputs, each scored 0–100. Each bar is that input's sub-score; the figure is the points it added to the 100-point composite (weight × sub-score).
- Cash flow +30.0/30.0
- 1% rule +10.0/10.0
- DSCR +10.0/10.0
- ARV discount +7.5/15.0
- Appreciation +6.4/10.0
- Schools +3.7/10.0
- Livability +3.4/5.0
- Rent growth +2.5/5.0
- Condition / age +2.5/5.0
$69,000
🖨 Deal sheet (PDF) 📄 Offer letter ✓ Due diligence
Listing remarks
In Town Structurally Sound Two Story Home. Home has recently undergone extensive rehab focused in first floor living area and family room. Nice kitchen with gas stove. Newer (approx. 3 years) gas boiler system and updated wiring & electric outlets on 1st floor. Second Floor has 3 BR's, Two Nice Size, One Smaller could use updating. Full Basement, Concrete Floor. Front Covered Entry & Encl. Back Porch, Large Storage Wood Frame Shed in backyard. Good Solid Home/Investment.
Key facts
- Extensive rehab
- Enclosed back porch
- Updated wiring
Tags
Neighborhood map
What this means for you Summary
Snapshot
- This is a 4-bed/1.0-bath single-family listed at $69k.
Deal economics
- At list price, monthly cash flow is $511 ($6k/yr) — positive.
- The deal already cash-flows at list — no discount required.
- Meets the 1% rule at list price ($1k rent vs $69k).
- Recommended offer: $68k (1.5% below list) — sets the bar for market timing.
- Cap rate 15.2% vs local median 4.6% in Waverly — top-decile yield for the area; either an underpriced asset or a hidden risk that comps aren't pricing in. Stress-test before assuming the spread holds.
Location & tenants
- Location reads 67/100 on livability (#569 in NY) — a middle-class / working-renter tenant base. Strengths: cost of living A+, housing A+, health & safety A; Watch: amenities F, commute F, employment F.
- Waverly Central School District (town): math 41% / reading 46% proficiency, ranked #480 of 590 in NY (top 81%) — families likely to look elsewhere, expect single-tenant / working-renter base with shorter leases.
- Zoned schools: Elm Street Elementary School (math 44% / reading 47%, grade D-, #1,271 of 2,108 statewide, top 60%, 443 students, 58% FRL); Waverly Middle School (math 30% / reading 45%, grade F, #445 of 729 statewide, top 61%, 463 students, 53% FRL); Waverly High School (math 87% / reading 75%, grade A, #485 of 1,100 statewide, top 45%, 443 students, 46% FRL).
- Market conditions: 53 active listings in the ZIP; 139 units permitted in Tioga County in 2024 (65 in 5+ unit buildings).
Forward outlook
- In year one you build about $2k of equity ($477 loan paydown + $2k appreciation (2.8% local appreciation)).
- Tioga County population projected at -27% by 2050 — secular population decline; favor cash flow + early exit over multi-decade hold.
- At projected returns (2.8% appreciation + 3.0% rent growth), your $19k cash investment doubles in ~3 years — after that, you're playing with house money.
Negotiation context
- It's been on market 17 days — a 2% lower offer ($68k) is reasonable based on typical stale-listing flexibility.
- Current owner paid $60k; 15% above their basis — modest negotiation headroom, anchor on the comps not their cost.
Risks & watch-outs
- Watch-outs: property tax is 3.4% of price; built in 1900 — expect roof / HVAC / electrical / plumbing capex.
Questions for the listing agent
- Built in 1900 — when were the roof, HVAC, electrical panel, plumbing, and water heater last replaced?
- Property tax is high relative to price — has the assessment been appealed recently, and will the sale trigger a re-assessment?
- Is there a deadline driving the sale (1031 exchange, divorce, estate, relocation)? That informs how much negotiation room exists.
- What's the average days-on-market for RENTAL listings here right now (not sales)? A rising rental-DOM trend means longer vacancies and softer asking-rent achievability than the comps imply.
- What's the recent tenant-quality profile in this submarket — average credit score on applications, eviction rate, late-payment / NSF rate, and stable-employment percentage? A property-management company in the area should have these aggregated.
- How much new for-sale + rental construction is in the pipeline within 1–3 miles? Heavy new supply typically softens prices + rents 12–24 months out; constrained supply supports both.
Investment metrics
- 1% rule
- 2.01% ✓
- Cap rate
- 15.18%
- Cash-on-cash
- 31.74%
- DSCR
- 2.41
- GRM
- 4.1
CMA / ARV
- ARV (on-the-fly)
- $184,450
- Comps found
- 12
Show comp detail 12 sales within ~0.75 mi
| Address | Dist | Beds/Ba | Sqft | Sold | Price | $/sf | Match |
|---|---|---|---|---|---|---|---|
| 520 Fulton St | 0.11mi | 4/2.0 | 2,219 (+2%) | 1mo | $91,490 | $41 | 86 |
| 446 Pennsylvania Ave | 0.37mi | 4/1.5 | 2,151 (-1%) | 6mo | $140,000 | $65 | 74 |
| 326 Chemung St | 0.31mi | 4/1.5 | 2,311 (+6%) | 10mo | $65,000 | $28 | 64 |
| 29 Cadwell Ave | 0.13mi | 5/2.0 (+1) | 2,388 (+10%) | 7mo | $180,000 | $75 | 62 |
| 32 Lyman Ave | 0.34mi | 3/1.0 (-1) | 2,066 (-5%) | 12mo | $175,000 | $85 | 61 |
| 536 Fulton St | 0.18mi | 3/1.5 (-1) | 1,844 (-15%) | 4mo | $135,000 | $73 | 56 |
| 1 Lyman Ave | 0.38mi | 4/1.5 | 1,932 (-11%) | 7mo | $280,000 | $145 | 56 |
| 40 Pine St | 0.24mi | 4/2.0 | 2,432 (+12%) | 13mo | $222,450 | $91 | 54 |
| 431 Loder St | 0.23mi | 3/1.5 (-1) | 1,874 (-14%) | 15mo | $75,000 | $40 | 47 |
| 324 Chemung St | 0.30mi | 5/3.0 (+1) | 2,467 (+14%) | 6mo | $208,500 | $85 | 45 |
| 12 Tioga | 0.25mi | 3/2.5 (-1) | 1,872 (-14%) | 13mo | $180,000 | $96 | 44 |
| 89 Spring St | 0.69mi | 3/1.5 (-1) | 2,425 (+12%) | 15mo | $228,723 | $94 | 29 |
Match score weights: distance 35% · size 25% · config 20% · recency 20%. Top-matched comps best support the ARV.
Projected returns pro-forma
2.78% appreciation · 3.0% rent growth · sell at horizon
- IRR
- 37.2%
- Equity multiple
- 3.08×
- Total profit
- $40,143
- Equity at exit
- $30,168
- IRR
- 37.5%
- Equity multiple
- 6.09×
- Total profit
- $98,431
- Equity at exit
- $45,836
Cash invested: $19,320 (down + closing). Projections, not guarantees.
Landlord ↔ Tenant lean methodology
- Overall (STATE)
- 15 Strongly Tenant-Friendly
- State New York
- 15 Strongly Tenant-Friendly · D+10
- County
- — inherits STATE
- City
- — inherits STATE
ZIP-level market 14892
- Home prices YoY
- 1.2%
- Active inventory
- 53
- Price-to-rent
- 4.1×
Monthly cashflow live
- Estimated rent
- $1,389 medium interval (Pro) →
- Mortgage (P&I)
- −$362
- Tax from tax record
- −$195 /mo · $2,345/yr
- Insurance
- −$29
- HOA
- −$0
- Vacancy / Maint / Mgmt
- −$292
- Net cashflow
- $511
Break-even live
Sensitivity live
| Price | -10% $550 | -5% $531 | +0% $511 | +5% $492 | +10% $472 |
|---|---|---|---|---|---|
| Rent | -10% $401 | -5% $456 | +0% $511 | +5% $566 | +10% $621 |
| Rate | -1.0pp $546 | -0.5pp $529 | base $511 | +0.5pp $493 | +1.0pp $475 |
UW: 25.0% down · 7.5% · 30yr · 1.5% tax · 5.0% vac · 8.0% maint · 8.0% mgmt
Financing live
Cash to close
- Down payment
- $17,250
- Closing costs
- $2,070
- Reserves months
- —
- Total cash needed
- —
Loan-product check · same deal, 3 products live
Conventional
25% down · 7.5% · 30yr
- Down + closing
- —
- Monthly P&I
- —
- Monthly cashflow
- —
- DSCR
- —
- Eligible?
- —
Personal DTI + credit; lowest rate.
DSCR
20% down · 8.5% · 30yr
- Down + closing
- —
- Monthly P&I
- —
- Monthly cashflow
- —
- DSCR
- —
- Eligible?
- —
No personal income docs; deal must DSCR.
Hard money
10% down · 12.0% · 12mo
- Down + closing
- —
- Monthly P&I
- —
- Monthly cashflow
- —
- DSCR
- —
- Eligible?
- —
Short-term bridge; refi at stabilization.
Listing history 4 events
-
2026-02-13soldstatus $60,000
-
2025-12-19status Pending
-
2025-11-26$69,000 Active
-
2012-04-27soldstatus $17,500
ⓘ Source: listings_history table (triggers on properties + properties_extension) + one-shot
backfill from property_details.listing_events for pre-trigger history.
Tax reassessment forecast NY · Partial reset (capped growth)
- Current annual tax
- $2,345 · $195/mo
- Projected year-2 tax
- $2,345 · $195/mo
- Expected delta
- $0/yr ($0/mo · 0.0%)
ⓘ Screening estimate from a state-policy table — verify with the county assessor before closing.
Climate risk First Street
- Flood 1/10 Low FEMA zone X (unshaded) · 0% chance over 30 yrs
- Wildfire 2/10 Low
- Heat 3/10 Moderate 7 d/yr ≥96°F today · 16 d/yr by 30 yrs out
- Wind 2/10 Low 100% chance of damaging wind over 30 yrs
- Air quality 2/10 Low 0 unhealthy d/yr today · 1 by 30 yrs out
Nearby sold comps map
Loading sold comps map…
Walkable amenities ~0.75 mi
Loading nearby amenities…
Taxation est. · year 1
- Rental income
- $16,665
- − Mortgage interest
- −$3,865
- − Property taxes
- −$2,345
- − Insurance
- −$345
- − Repairs & maintenance
- −$1,333
- − Management
- −$1,333
- − Depreciation
- −$2,007
- Taxable income
- $5,436
- Est. tax owed @ 24.0%
- −$1,305
- After-tax cash flow
- $4,828/yr
For passive investors: Depreciation is non-cash, so a rental often shows a tax loss while cash-flowing — sheltering income. Rental losses are passive: they offset passive income freely, and up to $25,000/yr can offset ordinary (W-2) income if you actively participate and your MAGI is under $100k (phasing out to $0 by $150k); unused losses carry forward. On sale, claimed depreciation is recaptured at up to 25%, and gains may owe capital-gains tax (a 1031 exchange can defer both). Figures are a year-1 estimate at your 24.0% rate — not tax advice; consult a CPA.
Schools (NCES district)
- District
- Waverly Central School District
- NCES district ID
- 3630270
- Math proficiency
- 41% ▼ -4.00%
- Reading proficiency
- 46% ▲ 8.00%
- Median HH income
- $44,935
- Composite
- 36.9/100
- National rank
- #4544
- State rank
- #480 of 590 in NY
Livability — Waverly
- Score
- 67/100
- State rank
- #569
- US rank
- #10246
Category grades
Schools grade is shown separately in the Schools card above.
Census & demographics
- Census place
- Waverly, NY
- Population (ZIP)
- 7,531
Population outlook (Tioga County) Hauer SSP2
- Today (2025)
- 45,155 people
- By 2030
- 42,801 · -5.2%
- By 2040
- 37,960 · -15.9%
- By 2050
- 33,071 · -26.8%
- By 2075
- 24,144 · -46.5%
- By 2100
- 16,545 · -63.4%
Race, ethnicity, and origin ACS 2023
- Neighborhood character
- Predominantly White (93%)
- Race & ethnicity
- White 93% Hispanic / Latino 2% Two or more races 2% Black 1% Asian 1%
- Common ancestry
- Iranian 3% Romanian 3% Italian 2%
- Foreign-born
- 2%
- Languages at home
- 98% English-only · German/W. Germanic 1% Tagalog/Filipino 1%
Political lean MEDSL · Tioga
- 2024 margin
- Strong R (+22.9) · D 38.6% · R 61.4%
- 2008→2024 swing
- -12.7pp toward R · 2008: -10.2pp · 2024: -22.9pp
- All cycles
- 2024: R+22.9 2020: R+20.6 2016: R+27.6 2012: R+15.1 2008: R+10.2
Not yet ingested
- Civics
- —
Market trends
- HPI YoY
- ▲ 2.78%
- Current HPI
- 236.7714
- Rent YoY
- —
- Metro
- —
- State GDP YoY
- ▲ 2.60%
- F500 in state
- 92
Industry mix (Fortune 500 HQ in NY)
| Industry | F500 HQs | Revenue |
|---|---|---|
| Financial Services | 10 | $950B |
|
||
| Consumer Goods | 9 | $162B |
|
||
| Insurance | 4 | $225B |
|
||
| Telecommunications | 2 | $144B |
|
||
| Pharmaceuticals | 2 | $112B |
|
||
| Media / Entertainment | 2 | $69B |
|
||
Price history
+242.9% since first listed4 events — show timeline
- 2026-02-13 Sold (Public Records) $60,000 Public Records
- 2025-12-19 Pending — NMPA
- 2025-11-26 Listed $69,000 NMPA
- 2012-04-27 Sold (Public Records) $17,500 Public Records
Property tax history
+5.7%/yrLatest (2025): $2,345 · +4.6% YoY. Source: county tax records.
Cash-flow waterfall
monthlySold comps — $/sqft
last 12 mo · ≤1 miLoading sold comps…