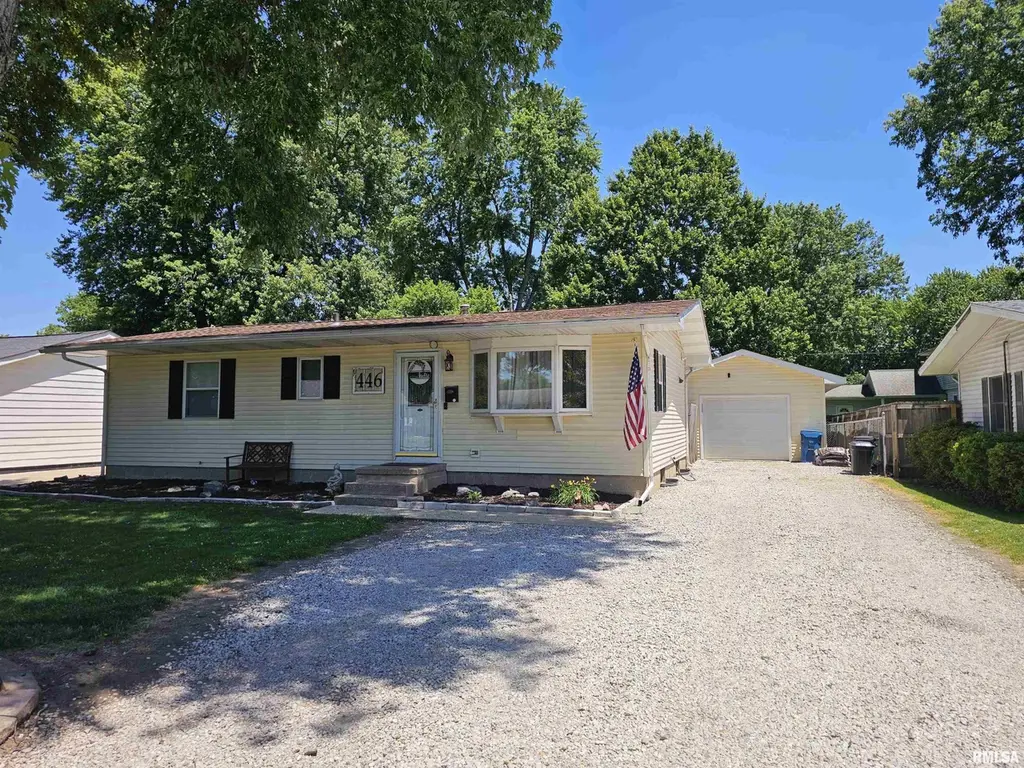
446 W Lake Shore Dr · Springfield, IL
Flood risk 1/10 · Minimal
- FEMA flood zone
- X (unshaded)
- Chance of flooding over 30 yrs
- 0.0%
- Est. flood insurance / yr
- $473 – $860
Fire risk 1/10 · Minimal
- Est. fire insurance / yr
- $804 – $1,492
Heat risk 4/10 · Minor
- Hot days now (above 105°F)
- 7 days/yr
- Hot days in 30 yrs
- 20 days/yr
Wind risk 2/10 · Minimal
- Chance of severe wind over 30 yrs
- 2.0%
Air-quality risk 2/10 · Minimal
- Unhealthy air days now
- 1 days/yr
- Unhealthy air days in 30 yrs
- 1 days/yr
Risk factors via First Street. Map © Google.
Why this score? — see what drove the B- grade
The composite is a weighted blend of 9 inputs, each scored 0–100. Each bar is that input's sub-score; the figure is the points it added to the 100-point composite (weight × sub-score).
- Cash flow +28.7/30.0
- DSCR +10.0/10.0
- 1% rule +8.6/10.0
- Appreciation +5.0/10.0
- ARV discount +4.4/15.0
- Livability +4.0/5.0
- Rent growth +2.5/5.0
- Condition / age +2.5/5.0
- Schools +1.7/10.0
$143,000
🖨 Deal sheet 📄 Offer letter ✓ Due diligence
Listing remarks MLS
Move-in ready 3 bed, 1 bath ranch w/ partially finished basement! Large eat-in kitchen and spacious living room! Updated bathroom! Hardwood, new carpet, fresh paint, SS appliances and more! Plenty of storage! Potential to finish more of basement w/ roughed in plumbing for 2nd bathroom! Large fenced-in back yard w/ patio space for entertaining, storage shed, and Brand New garage! Beautiful landscaping! Basement is professionally waterproofed w/ lifetime warranty!
Key facts
- 7,200 sq ft lot
- Garage
- Built 1957
Property features AI
Exterior
- Parking: Detached 1-car garage
- Utilities: Public water; Public sewer
- Home design: Single-family residence; Built in 1957
- Construction: Not new construction
- Exterior features: Shingle roof; Level lot; Gravel road access; Lot dimensions approximately 60 x 120
Interior
- Kitchen: Tile flooring in kitchen
- Bedrooms: Three bedrooms (all on the main level)
- Flooring: Hardwood in two bedrooms; Carpet in one bedroom; Tile in kitchen
- Bathrooms: One full bathroom
- Heating & cooling: Central air conditioning; Forced air heating
- Interior features: Full basement, partially finished; No fireplaces
Neighborhood map
What this means for you Summary
Snapshot
- This is a 3-bed/1.0-bath single-family listed at $143k.
Deal economics
- At list price, monthly cash flow is $478 ($6k/yr) — positive.
- The deal already cash-flows at list — no discount required.
- Meets the 1% rule at list price ($2k rent vs $143k).
- Cap rate 10.3% vs local median 4.9% in Springfield — top-decile yield for the area; either an underpriced asset or a hidden risk that comps aren't pricing in. Stress-test before assuming the spread holds.
Location & tenants
- Location reads 79/100 on livability (#122 in IL, #2,138 nationally) — a middle-class / working-renter tenant base. Strengths: amenities A+, commute A+, cost of living A+; Watch: crime F.
- Springfield SD 186 (urban): math 17% / reading 22% proficiency, ranked #438 of 620 in IL (top 71%) — low school quality limits family demand, transient renter base, plan for 1-2y turnover; 64% free/reduced lunch — lower-income household profile, screen leases tightly.
- Zoned schools: Springfield Southeast High Sch (math 17% / reading 22%, grade F, #397 of 693 statewide, top 61%, 1,261 students, 0% FRL) — zoned schools average 0% FRL vs 64% district-wide (64 pts lower); this property's tenant base skews higher-income than the district average.
- Market conditions: 1 active listings in the ZIP; 2 comparable units currently listed for rent nearby; 225 units permitted in Sangamon County in 2024 (48 in 5+ unit buildings).
Forward outlook
- In year one you build about $5k of equity ($989 loan paydown + $4k appreciation (3.0% local appreciation)).
- Sangamon County population projected to shrink 9% by 2050 — rents likely to lag national; underwrite the cash flow, not the appreciation.
- At projected returns (3.0% appreciation + 3.0% rent growth), your $40k cash investment doubles in ~4 years — after that, you're playing with house money.
- By year 7, paydown + projected appreciation supports a ~$33k cash-out refi (75% LTV) — recoverable capital for the next deal without selling this one.
Negotiation context
- Only 4 days on market — expect competitive offers; lowballing is unlikely to land.
- 3 sale attempts since 19y ago; this cycle's ask is 44% above the opening price — seller raised mid-cycle; expect resistance to lowballs.
- Current owner paid $94k; list at $143k implies a 52% gain — meaningful room to come down on a strong offer.
Risks & watch-outs
- Watch-outs: built in 1957 — expect roof / HVAC / electrical / plumbing capex.
Questions for the listing agent
- Built in 1957 — when were the roof, HVAC, electrical panel, plumbing, and water heater last replaced?
- Is there a deadline driving the sale (1031 exchange, divorce, estate, relocation)? That informs how much negotiation room exists.
- Schools are D-rated, which usually means shorter tenancies and higher turnover. Who's the typical renter profile here, and what's been the actual vacancy rate?
- Crime grade is F in this area — have there been break-ins, vandalism, or insurance claims at this property in the last 3 years? What carrier currently insures it and at what premium?
- What's the average days-on-market for RENTAL listings here right now (not sales)? A rising rental-DOM trend means longer vacancies and softer asking-rent achievability than the comps imply.
- What's the recent tenant-quality profile in this submarket — average credit score on applications, eviction rate, late-payment / NSF rate, and stable-employment percentage? A property-management company in the area should have these aggregated.
- How much new for-sale + rental construction is in the pipeline within 1–3 miles? Heavy new supply typically softens prices + rents 12–24 months out; constrained supply supports both.
Investment metrics
- 1% rule
- 1.36% ✓
- Cap rate
- 10.30%
- Cash-on-cash
- 14.31%
- DSCR
- 1.64
- GRM
- 6.1
CMA / ARV
- ARV (on-the-fly)
- $133,900
- Comps found
- 12
Show comp detail 12 sales within ~0.75 mi
| Address | Dist | Beds/Ba | Sqft | Sold | Price | $/sf | Match |
|---|---|---|---|---|---|---|---|
| 3625 Sheffield Rd | 0.25mi | 3/1.5 | 1,296 (-0%) | 4mo | $130,000 | $100 | 82 |
| 3515 Ivanhoe Rd | 0.21mi | 3/1.0 | 1,233 (-5%) | 1mo | $117,000 | $95 | 81 |
| 2456 Devonshire Rd | 0.31mi | 3/1.0 | 1,270 (-2%) | 1mo | $125,000 | $98 | 81 |
| 146 Circle Dr | 0.39mi | 3/2.0 | 1,338 (+3%) | 0mo | $175,000 | $131 | 73 |
| 2025 E Hood St | 0.42mi | 3/1.0 | 1,360 (+5%) | 3mo | $139,900 | $103 | 70 |
| 3518 Sheffield Rd | 0.23mi | 3/1.0 | 1,443 (+11%) | 2mo | $150,000 | $104 | 69 |
| 1913 E Hood St | 0.57mi | 3/1.0 | 1,218 (-6%) | 1mo | $147,000 | $121 | 62 |
| 2155 Pickett St | 0.37mi | 2/1.0 (-1) | 1,160 (-11%) | 7mo | $120,000 | $103 | 54 |
| 3719 E Hooker St | 0.67mi | 3/1.0 | 1,429 (+10%) | 3mo | $146,500 | $103 | 49 |
| 1937 Pickett St | 0.53mi | 3/2.0 | 1,477 (+14%) | 5mo | $145,000 | $98 | 44 |
| 3213 Sherman St | 0.64mi | 3/1.0 | 1,493 (+15%) | 5mo | $159,900 | $107 | 41 |
| 77 Glen Aire Dr | 0.68mi | 3/1.5 | 1,150 (-12%) | 7mo | $80,000 | $70 | 41 |
Match score weights: distance 35% · size 25% · config 20% · recency 20%. Top-matched comps best support the ARV.
Projected returns pro-forma
3.0% appreciation · 3.0% rent growth · sell at horizon
- IRR
- 21.0%
- Equity multiple
- 2.19×
- Total profit
- $47,718
- Equity at exit
- $64,299
- IRR
- 22.1%
- Equity multiple
- 4.18×
- Total profit
- $127,356
- Equity at exit
- $99,092
Cash invested: $40,040 (down + closing). Projections, not guarantees.
Landlord ↔ Tenant lean methodology
- Overall (STATE)
- 43 Moderately Tenant-Leaning
- State Illinois
- 43 Moderately Tenant-Leaning · D+7
- County
- — inherits STATE
- City
- — inherits STATE
ZIP-level market 62703-5059
- Active inventory
- 1
- Price-to-rent
- 6.1×
Monthly cashflow live
- Estimated rent
- $1,940 medium interval (Pro) →
- Mortgage (P&I)
- −$750
- Tax from tax record
- −$246 /mo · $2,950/yr
- Insurance
- −$60
- HOA
- −$0
- Vacancy / Maint / Mgmt
- −$407
- Net cashflow
- $478
Break-even live
UW: 25.0% down · 7.5% · 30yr · 1.5% tax · 5.0% vac · 8.0% maint · 8.0% mgmt
Financing live
Cash to close
- Down payment
- $35,750
- Closing costs
- $4,290
- Reserves months
- —
- Total cash needed
- —
Loan-product check · same deal, 3 products live
Conventional
25% down · 7.5% · 30yr
- Down + closing
- —
- Monthly P&I
- —
- Monthly cashflow
- —
- DSCR
- —
- Eligible?
- —
Personal DTI + credit; lowest rate.
DSCR
20% down · 8.5% · 30yr
- Down + closing
- —
- Monthly P&I
- —
- Monthly cashflow
- —
- DSCR
- —
- Eligible?
- —
No personal income docs; deal must DSCR.
Hard money
10% down · 12.0% · 12mo
- Down + closing
- —
- Monthly P&I
- —
- Monthly cashflow
- —
- DSCR
- —
- Eligible?
- —
Short-term bridge; refi at stabilization.
Rent comps 2 comps
| Address | Beds | Baths | Sqft | Rent | $/sqft | DOM | Units | Dist |
|---|---|---|---|---|---|---|---|---|
| 136 East Hazel Dell Ln Springfield, IL | 2.0 | 2.0 | 1350 | $2,300 | $1.70 | 21d | 1 | 0.56mi |
| 2949 Fox Bridge Rd Springfield, IL | 2.0 | 1.0 | 900 | $960 | $1.07 | 21d | 1 | 1.09mi |
Listing history 10 events
-
2026-06-15status $143,000 Pending 4 DOM
-
2026-06-15days on market $143,000 Active 4 DOM
-
2026-06-14days on market $143,000 Active 2 DOM
-
2026-06-13statusdays on market $143,000 Active 1 DOM
-
2026-06-10days on market $143,000 Coming Soon 6 DOM
-
2026-06-09days on market $143,000 Coming Soon 5 DOM
-
2026-06-08days on market $143,000 Coming Soon 4 DOM
-
2026-06-07days on market $143,000 Coming Soon 3 DOM
-
2026-06-05remarks 699-char remark
-
2026-06-05$143,000 Coming Soon 1 DOM
ⓘ Source: listings_history table (triggers on properties + properties_extension) + one-shot
backfill from property_details.listing_events for pre-trigger history.
Tax reassessment forecast IL · Partial reset (capped growth)
- Current annual tax
- $2,950 · $246/mo
- Projected year-2 tax
- $3,098 · $258/mo
- Expected delta
- +$148/yr (+$12/mo · 5.0%)
ⓘ Screening estimate from a state-policy table — verify with the county assessor before closing.
Climate risk First Street
- Flood 1/10 Low FEMA zone X (unshaded) · 0% chance over 30 yrs
- Wildfire 1/10 Low
- Heat 4/10 Moderate 7 d/yr ≥105°F today · 20 d/yr by 30 yrs out
- Wind 2/10 Low 2% chance of damaging wind over 30 yrs
- Air quality 2/10 Low 1 unhealthy d/yr today · 1 by 30 yrs out
Nearby sold comps map
Loading sold comps map…
Walkable amenities ~0.75 mi
Loading nearby amenities…
Taxation est. · year 1
- Rental income
- $23,285
- − Mortgage interest
- −$8,010
- − Property taxes
- −$2,950
- − Insurance
- −$715
- − Repairs & maintenance
- −$1,863
- − Management
- −$1,863
- − Depreciation
- −$4,160
- Taxable income
- $3,725
- Est. tax owed @ 24.0%
- −$894
- After-tax cash flow
- $4,838/yr
For passive investors: Depreciation is non-cash, so a rental often shows a tax loss while cash-flowing — sheltering income. Rental losses are passive: they offset passive income freely, and up to $25,000/yr can offset ordinary (W-2) income if you actively participate and your MAGI is under $100k (phasing out to $0 by $150k); unused losses carry forward. On sale, claimed depreciation is recaptured at up to 25%, and gains may owe capital-gains tax (a 1031 exchange can defer both). Figures are a year-1 estimate at your 24.0% rate — not tax advice; consult a CPA.
Schools (NCES district)
- District
- Springfield SD 186
- NCES district ID
- 1737080
- Math proficiency
- 17% ▼ -7.00%
- Reading proficiency
- 22% ▼ -5.00%
- Median HH income
- $43,744
- Composite
- 16.89/100
- National rank
- #9142
- State rank
- #438 of 620 in IL
Livability — Springfield
- Score
- 79/100
- State rank
- #122
- US rank
- #2138
Category grades
Schools grade is shown separately in the Schools card above.
Census & demographics
- Census place
- Springfield, IL
Population outlook (Sangamon County) Hauer SSP2
- Today (2025)
- 198,317 people
- By 2030
- 196,127 · -1.1%
- By 2040
- 188,664 · -4.9%
- By 2050
- 179,624 · -9.4%
- By 2075
- 155,027 · -21.8%
- By 2100
- 122,588 · -38.2%
Not yet ingested
- Political lean
- —
- Race & ethnicity
- —
- Common origin
- —
- Civics
- —
Market trends
- HPI YoY
- —
- Current HPI
- —
- Rent YoY
- —
- Metro
- —
- State GDP YoY
- ▲ 1.59%
- F500 in state
- 60
Industry mix (Fortune 500 HQ in IL)
| Industry | F500 HQs | Revenue |
|---|---|---|
| Insurance | 4 | $201B |
|
||
| Consumer Goods | 4 | $87B |
|
||
| Industrial Machinery | 3 | $64B |
|
||
| Healthcare | 2 | $55B |
|
||
| Retail / Pharmacy | 1 | $148B |
|
||
| Agriculture / Food | 1 | $86B |
|
||
Price history
+84.5% since first listed11 events — show timeline
- 2026-06-04 Coming Soon $143,000 RMLSA as Distributed by MLS Grid
- 2015-10-28 Sold (Public Records) $94,100 Public Records
- 2015-10-23 Sold (MLS) $94,000 RMLSA as Distributed by MLS Grid
- 2015-05-26 Listed $99,500 RMLSA as Distributed by MLS Grid
- 2012-09-13 Sold (Public Records) $87,500 Public Records
- 2012-09-10 Sold (MLS) $87,500 RMLSA as Distributed by MLS Grid
- 2012-08-03 Listed $89,900 RMLSA as Distributed by MLS Grid
- 2007-05-02 Sold (Public Records) $85,500 Public Records
- 2007-04-27 Sold (MLS) $85,500 RMLSA as Distributed by MLS Grid
- 2007-03-08 Listed $89,900 RMLSA as Distributed by MLS Grid
- 2001-09-07 Sold (Public Records) $77,500 Public Records
Property tax history
+4.1%/yrLatest (2025): $2,950 · +4.6% YoY. Source: county tax records.
Cash-flow waterfall
monthlySold comps — $/sqft
last 12 mo · ≤1 miLoading sold comps…