 Multi-family
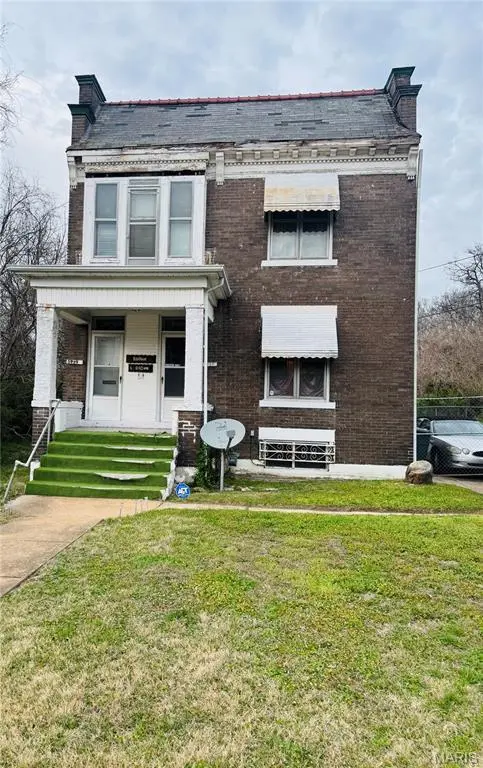
5939 Etzel Ave Unit A/B · St. Louis, MO
Flood risk 1/10 · Minimal
- FEMA flood zone
- X (unshaded)
- Chance of flooding over 30 yrs
- 0.0%
- Est. flood insurance / yr
- $473 – $860
Fire risk 1/10 · Minimal
- Est. fire insurance / yr
- $1,054 – $1,958
Heat risk 5/10 · Moderate
- Hot days now (above 107°F)
- 7 days/yr
- Hot days in 30 yrs
- 20 days/yr
Wind risk 2/10 · Minimal
- Chance of severe wind over 30 yrs
- 1.0%
Air-quality risk 4/10 · Minor
- Unhealthy air days now
- 4 days/yr
- Unhealthy air days in 30 yrs
- 5 days/yr
Risk factors via First Street. Map © Google.
Why this score? — see what drove the C grade
The composite is a weighted blend of 9 inputs, each scored 0–100. Each bar is that input's sub-score; the figure is the points it added to the 100-point composite (weight × sub-score).
- Cash flow +30.0/30.0
- 1% rule +10.0/10.0
- DSCR +10.0/10.0
- Rent growth +3.1/5.0
- Livability +2.5/5.0
- Condition / age +1.5/5.0
- Schools +1.2/10.0
- ARV discount +0.0/15.0
- Appreciation +0.0/10.0
$93,000
🖨 Deal sheet 📄 Offer letter ✓ Due diligence
Multi-family units
County records classify this as Multi-Family (2-4 Unit). Listing-text estimate: 1 unit. estimate disagrees with records
Listing remarks MLS
First time on the market in over 50 plus years. Value-add duplex opportunity in the West End with rare features and flexible living potential. Property includes original hardwood floors, two enclosed back porches, and a basement with additional living space and kitchenette, ideal for extended use or entertaining. Off-street parking and a detached 4-car garage add significant utility, though the garage is being sold as-is with condition and access unknown. Property will require renovation, including a new roof, and is being sold strictly as-is. Potential for conversion to a spacious 2,600 sqft single-family residence. Ideal for investors or buyers looking to create value in a developing area. Property is owner-occupied. Showings by appointment only, agent must accompany client. Professional photos coming soon. Happy showing!
Key facts
- 0.24 acre lot
- 4 garage spots
- Built 1909
Tags
Neighborhood map
What this means for you Summary
Snapshot
- This is a 4-bed/1.0-bath multifamily listed at $93k. Condition is rated poor.
Deal economics
- At list price, monthly cash flow is $2k ($23k/yr) — positive.
- The deal already cash-flows at list — no discount required.
- Meets the 1% rule at list price ($3k rent vs $93k).
- Recommended offer: $87k (6.0% below list) — sets the bar for market timing.
- Cap rate 31.2% vs local median 5.0% in St. Louis — top-decile yield for the area; either an underpriced asset or a hidden risk that comps aren't pricing in. Stress-test before assuming the spread holds.
Location & tenants
- Location reads: area grade C — affects rentability + tenant quality, not the cash-flow math above.
- St. Louis City (urban): math 10% / reading 18% proficiency, ranked #312 of 324 in MO (top 96%) — low school quality limits family demand, transient renter base, plan for 1-2y turnover; 80% free/reduced lunch — lower-income household profile, screen leases tightly.
- Market conditions: Rents rising (+2.4%/yr); 118 active listings in the ZIP; 7 comparable units currently listed for rent nearby; rentals at typical pace (median 24d on market — plan ~3-4 weeks tenant-placement turnaround); 43% of comp listings sitting > 30 days — soft ceiling on asking rent; 294 units permitted in St. Louis city in 2024 (227 in 5+ unit buildings).
- At $3,259/mo this rent would consume 86% of the median local household income ($46k/yr) (locally 1457% of renters already pay >50% of income on rent) — very limited rent-growth headroom before tenants either downsize or default.
Forward outlook
- Local home prices are declining (-3.0%/yr); year-one equity from $643 of loan paydown is wiped out by about $3k of value loss. Plan a longer hold.
- St. Louis County population projected to shrink 6% by 2050 — rents likely to lag national; underwrite the cash flow, not the appreciation.
- At projected returns (-3.0% appreciation + 2.4% rent growth), your $26k cash investment doubles in ~2 years — after that, you're playing with house money.
Negotiation context
- It's been on market 63 days — a 6% lower offer ($87k) is reasonable based on typical stale-listing flexibility.
Risks & watch-outs
- Watch-outs: built in 1909 — expect roof / HVAC / electrical / plumbing capex.
- Climate carrying-cost: extreme-heat days projected 7→20/yr by 2055 (HVAC capex compounding) — expect insurance premiums to compound above CPI over the hold.
Questions for the listing agent
- It's been on market 63 days. Have you received any prior offers? Is the seller open to a 6% concession, seller financing, or rate buy-down credit?
- Have any recent inspections been done? Can we get a copy of the seller's disclosures and any deferred-maintenance estimates?
- Built in 1909 — when were the roof, HVAC, electrical panel, plumbing, and water heater last replaced?
- Why hasn't it sold? Are there any deal-killer items the seller is aware of (foundation, flood, title, zoning, code violations)?
- Is there a deadline driving the sale (1031 exchange, divorce, estate, relocation)? That informs how much negotiation room exists.
- What's the average days-on-market for RENTAL listings here right now (not sales)? A rising rental-DOM trend means longer vacancies and softer asking-rent achievability than the comps imply.
- What's the recent tenant-quality profile in this submarket — average credit score on applications, eviction rate, late-payment / NSF rate, and stable-employment percentage? A property-management company in the area should have these aggregated.
- How much new apartment / multifamily construction is in the pipeline within 1–3 miles? Heavy new supply (>2% of stock underway) typically softens rents 12–24 months out; light construction supports rent growth.
Investment metrics
- 1% rule
- 3.50% ✓
- Cap rate
- 31.22%
- Cash-on-cash
- 89.03%
- DSCR
- 4.96
- GRM
- 2.4
CMA / ARV
- ARV (median comp)
- $73,409
- List price
- $93,000
- Delta
- 26.69%
- Verdict
- OVERPRICED
- Comps
- 20 within 1.0 mi
Show comp detail 4 sales within ~0.75 mi
| Address | Dist | Beds/Ba | Sqft | Sold | Price | $/sf | Match |
|---|---|---|---|---|---|---|---|
| 6010 Bartmer Ave | 0.16mi | 5/2.0 (+1) | 2,784 (+7%) | 2mo | $85,000 | $31 | 70 |
| 953 Catalpa St | 0.33mi | 4/2.0 | 2,350 (-10%) | 2mo | $168,000 | $71 | 63 |
| 5866 Etzel Ave | 0.16mi | 5/2.0 (+1) | 2,806 (+8%) | 13mo | $174,900 | $62 | 60 |
| 5717 Page Blvd | 0.47mi | 5/2.0 (+1) | 2,352 (-10%) | 12mo | $60,000 | $26 | 43 |
Match score weights: distance 35% · size 25% · config 20% · recency 20%. Top-matched comps best support the ARV.
Projected returns pro-forma
-3.0% appreciation · 2.39% rent growth · sell at horizon
- IRR
- 89.0%
- Equity multiple
- 5.07×
- Total profit
- $106,035
- Equity at exit
- $13,867
- IRR
- 91.8%
- Equity multiple
- 10.33×
- Total profit
- $242,914
- Equity at exit
- $8,041
Cash invested: $26,040 (down + closing). Projections, not guarantees.
Landlord ↔ Tenant lean methodology
- Overall (STATE)
- 81 Strongly Landlord-Friendly
- State Missouri
- 81 Strongly Landlord-Friendly · R+10
- County
- — inherits STATE
- City
- — inherits STATE
ZIP-level market 63112
- Rents YoY
- 2.4%
- Active inventory
- 118
- Price-to-rent
- 4.8×
Monthly cashflow live
- Estimated rent
- $3,259 high interval (Pro) →
- Mortgage (P&I)
- −$488
- Tax est. 1.5%
- −$116 /mo · $1,395/yr
- Insurance
- −$39
- HOA
- −$0
- Vacancy / Maint / Mgmt
- −$684
- Net cashflow
- $1,932
Break-even live
2-unit breakdown (identical units grouped — click to expand)
| Units | Beds | Baths | Est. rent |
|---|---|---|---|
| 2× units | 2 | 1 | $3,258 |
| #1 | 2 | 1 | $1,629 |
| #2 | 2 | 1 | $1,629 |
| Total (2 units) | $3,259 | ||
UW: 25.0% down · 7.5% · 30yr · 1.5% tax · 5.0% vac · 8.0% maint · 8.0% mgmt
Financing live
Cash to close
- Down payment
- $23,250
- Closing costs
- $2,790
- Reserves months
- —
- Total cash needed
- —
Loan-product check · same deal, 3 products live
Conventional
25% down · 7.5% · 30yr
- Down + closing
- —
- Monthly P&I
- —
- Monthly cashflow
- —
- DSCR
- —
- Eligible?
- —
Personal DTI + credit; lowest rate.
DSCR
20% down · 8.5% · 30yr
- Down + closing
- —
- Monthly P&I
- —
- Monthly cashflow
- —
- DSCR
- —
- Eligible?
- —
No personal income docs; deal must DSCR.
Hard money
10% down · 12.0% · 12mo
- Down + closing
- —
- Monthly P&I
- —
- Monthly cashflow
- —
- DSCR
- —
- Eligible?
- —
Short-term bridge; refi at stabilization.
Rent comps 7 comps
| Address | Beds | Baths | Sqft | Rent | $/sqft | DOM | Units | Dist |
|---|---|---|---|---|---|---|---|---|
| 14 Parkland Pl Saint Louis, MO | 5.0 | 3.0 | 2830 | $2,500 | $0.88 | 23d | 1 | 0.21mi |
| 14 Parkland Pl Unit NA St. Louis, MO | 5.0 | 3.0 | 2830 | $2,700 | $0.95 | 43d | 1 | 0.21mi |
| 14 Parkland Pl Saint Louis, MO | 5.0 | 3.0 | 2830 | $2,500 | $0.88 | 7d | 1 | 0.21mi |
| 14 Parkland Pl Unit 1 St. Louis, MO | 5.0 | 3.0 | 2830 | $2,700 | $0.95 | 23d | 1 | 0.21mi |
| 5345 Wells Ave Saint Louis, MO | 3.0 | 1.0 | 2254 | $1,295 | $0.57 | 43d | 1 | 1.07mi |
| 5096 Minerva Ave Unit C St. Louis, MO | 3.0 | 1.0 | 1800 | $1,395 | $0.78 | 43d | 1 | 1.33mi |
| 275 Union Blvd St. Louis, MO | 3.0 | 1.0–3.0 | 1317 | $4,686 | $3.56 | 2d | 58 | 1.49mi |
Listing history 14 events
-
2026-06-18days on market $93,000 Active 63 DOM
-
2026-06-17days on market $93,000 Active 62 DOM
-
2026-06-16days on market $93,000 Active 61 DOM
-
2026-06-15days on market $93,000 Active 60 DOM
-
2026-06-13days on market $93,000 Active 58 DOM
-
2026-06-09days on market $93,000 Active 54 DOM
-
2026-06-08pricedays on market $93,000 Active 53 DOM
-
2026-06-07days on market $98,000 Active 52 DOM
-
2026-06-05days on market $98,000 Active 49 DOM
-
2026-06-03days on market $98,000 Active 48 DOM
-
2026-06-02days on market $98,000 Active 47 DOM
-
2026-06-01days on market $98,000 Active 46 DOM
-
2026-05-31days on market $98,000 Active 45 DOM
-
2026-04-16$98,000 Active 835-char remark
Show marketing remark (835 chars)
First time on the market in over 50 plus years. Value-add duplex opportunity in the West End with rare features and flexible living potential. Property includes original hardwood floors, two enclosed back porches, and a basement with additional living space and kitchenette, ideal for extended use or entertaining. Off-street parking and a detached 4-car garage add significant utility, though the garage is being sold as-is with condition and access unknown. Property will require renovation, including a new roof, and is being sold strictly as-is. Potential for conversion to a spacious 2,600 sqft single-family residence. Ideal for investors or buyers looking to create value in a developing area. Property is owner-occupied. Showings by appointment only, agent must accompany client. Professional photos coming soon. Happy showing!
ⓘ Source: listings_history table (triggers on properties + properties_extension) + one-shot
backfill from property_details.listing_events for pre-trigger history.
Climate risk First Street
- Flood 1/10 Low FEMA zone X (unshaded) · 0% chance over 30 yrs
- Wildfire 1/10 Low
- Heat 5/10 Major 7 d/yr ≥107°F today · 20 d/yr by 30 yrs out
- Wind 2/10 Low 100% chance of damaging wind over 30 yrs
- Air quality 4/10 Moderate 4 unhealthy d/yr today · 5 by 30 yrs out
Nearby sold comps map
Loading sold comps map…
Walkable amenities ~0.75 mi
Loading nearby amenities…
Taxation est. · year 1
- Rental income
- $39,108
- − Mortgage interest
- −$5,209
- − Property taxes
- −$1,395
- − Insurance
- −$465
- − Repairs & maintenance
- −$3,129
- − Management
- −$3,129
- − Depreciation
- −$2,705
- Taxable income
- $23,076
- Est. tax owed @ 24.0%
- −$5,538
- After-tax cash flow
- $17,645/yr
For passive investors: Depreciation is non-cash, so a rental often shows a tax loss while cash-flowing — sheltering income. Rental losses are passive: they offset passive income freely, and up to $25,000/yr can offset ordinary (W-2) income if you actively participate and your MAGI is under $100k (phasing out to $0 by $150k); unused losses carry forward. On sale, claimed depreciation is recaptured at up to 25%, and gains may owe capital-gains tax (a 1031 exchange can defer both). Figures are a year-1 estimate at your 24.0% rate — not tax advice; consult a CPA.
Condition & rehab AI · 1 photo
This property requires extensive renovation, including a new roof, exterior siding repair, interior renovation, HVAC/mechanical upgrades, and landscaping improvements. It presents a significant opportunity for investors to create value in a developing area.
Repairs flagged
- Major roof — The roof appears old and possibly leaking.
- Major exterior siding — The siding shows significant wear and tear.
- Major interior walls and flooring — The property will require renovation, which likely includes these areas.
- Major HVAC/mechanicals — The property will require renovation, which likely includes these systems.
- Major landscaping — The landscaping is overgrown and needs significant maintenance to improve curb appeal.
Value-add opportunities
- Both new roof — A new roof will improve the property's appearance and functionality.
- Both exterior siding repair — Repairing the siding will enhance the property's curb appeal and structural integrity.
- Both interior renovation — Renovating the interior will improve the living spaces and make the property more attractive to potential buyers or renters.
- Both HVAC/mechanical upgrades — Upgrading the HVAC and mechanical systems will improve comfort and energy efficiency.
- Both landscaping and curb appeal — A well-maintained landscape will enhance the property's curb appeal and attract potential buyers or renters.
Renovation cost estimate screening
| Repair item | Severity | Est. cost |
|---|---|---|
| roof · The roof appears old and possibly leaking. | Major | $15,000–50,000 |
| exterior siding · The siding shows significant wear and tear. | Major | $15,000–50,000 |
| interior walls and flooring · The property will require renovation, which likely includes these areas. | Major | $15,000–50,000 |
| HVAC/mechanicals · The property will require renovation, which likely includes these systems. | Major | $15,000–50,000 |
| landscaping · The landscaping is overgrown and needs significant maintenance to improve curb appeal. | Major | $15,000–50,000 |
| Total estimated repair cost · 5 items | $75,000–250,000 |
Value-add ROI direction
- Both new roof — A new roof will improve the property's appearance and functionality. ↑
- Both exterior siding repair — Repairing the siding will enhance the property's curb appeal and structural integrity. ↑
- Both interior renovation — Renovating the interior will improve the living spaces and make the property more attractive to potential buyers or renters. ↑
- Both HVAC/mechanical upgrades — Upgrading the HVAC and mechanical systems will improve comfort and energy efficiency. ↑
- Both landscaping and curb appeal — A well-maintained landscape will enhance the property's curb appeal and attract potential buyers or renters. ↑
ⓘ Cost ranges are severity-bucket heuristics (US national rule-of-thumb). Get contractor quotes + a written scope before underwriting a rehab budget.
Schools (NCES district)
- District
- St. Louis City
- NCES district ID
- 2929280
- Math proficiency
- 10% ▼ -6.00%
- Reading proficiency
- 18% ▼ -3.00%
- Median HH income
- $35,685
- Composite
- 11.54/100
- National rank
- #9699
- State rank
- #312 of 324 in MO
Livability — St. Louis
No livability data for this city. (Only ~50 U.S. cities are tracked.)
Census & demographics
- Census place
- St. Louis, MO
- County
- Saint Louis City · 254,015 people
- City population
- 283,259
- Metro
- St. Louis, MO-IL
- Population (ZIP)
- 17,985
- Household income
- $45,542
- Rent vs Own
- Severe rent burden
- 1457.0
Population outlook (St. Louis County) Hauer SSP2
- Today (2025)
- 315,737 people
- By 2030
- 313,865 · -0.6%
- By 2040
- 305,439 · -3.3%
- By 2050
- 296,529 · -6.1%
- By 2075
- 271,028 · -14.2%
- By 2100
- 255,359 · -19.1%
Race, ethnicity, and origin ACS 2023
- Neighborhood character
- Majority Black (63%)
- Race & ethnicity
- Black 63% White 24% Asian 6% Two or more races 5% Hispanic / Latino 4%
- Common ancestry
- Lithuanian 1% Scotch-Irish 1% Romanian 1%
- Foreign-born
- 9% · China, South Korea, Canada
- Languages at home
- 88% English-only · Spanish 3% Chinese 2% Korean 2%
Political lean MEDSL · St. Louis
- 2024 margin
- Solid D (+64.7) · D 81.4% · R 16.7% · Other 2.0%
- 2008→2024 swing
- -3.5pp toward R · 2008: 68.2pp · 2024: 64.7pp
- All cycles
- 2024: D+64.7 2020: D+66.2 2016: D+63.7 2012: D+66.6 2008: D+68.2
Not yet ingested
- Civics
- —
Market trends
- HPI YoY
- ▼ -158.94%
- Current HPI
- 115.1863
- Rent YoY
- ▲ 2.39%
- Metro
- St. Louis, MO-IL
- State GDP YoY
- ▲ 1.84%
- F500 in state
- 20
Industry mix (Fortune 500 HQ in MO)
| Industry | F500 HQs | Revenue |
|---|---|---|
| Healthcare | 1 | $163B |
|
||
| Insurance | 1 | $21B |
|
||
| Industrial Technology | 1 | $17B |
|
||
| Retail | 1 | $16B |
|
||
| Industrial Distribution | 1 | $10B |
|
||
| Utilities | 1 | $9B |
|
||
Price history
1 event — show timeline
- 2026-04-16 Listed $98,000 MARIS as Distributed by MLS Grid
Cash-flow waterfall
monthlySold comps — $/sqft
last 12 mo · ≤1 miLoading sold comps…