16335 Abbotts Pond Rd · Milford, DE
Flood risk 6/10 · Moderate
- FEMA flood zone
- X (unshaded)
- Chance of flooding over 30 yrs
- 0.68%
- Est. flood insurance / yr
- $473 – $860
Fire risk 3/10 · Minor
- Est. fire insurance / yr
- $476 – $884
Heat risk 8/10 · Major
- Hot days now (above 102°F)
- 7 days/yr
- Hot days in 30 yrs
- 16 days/yr
Wind risk 8/10 · Major
- Chance of severe wind over 30 yrs
- 80.0%
Air-quality risk 2/10 · Minimal
- Unhealthy air days now
- 1 days/yr
- Unhealthy air days in 30 yrs
- 1 days/yr
Risk factors via First Street. Map © Google.
Why this score? — see what drove the D grade
The composite is a weighted blend of 9 inputs, each scored 0–100. Each bar is that input's sub-score; the figure is the points it added to the 100-point composite (weight × sub-score).
- ARV discount +13.3/15.0
- Cash flow +11.4/30.0
- 1% rule +3.3/10.0
- DSCR +3.3/10.0
- Livability +3.1/5.0
- Rent growth +2.5/5.0
- Condition / age +2.5/5.0
- Schools +2.2/10.0
- Appreciation +0.0/10.0
$240,000
🖨 Deal sheet (PDF) 📄 Offer letter ✓ Due diligence
Listing remarks MLS
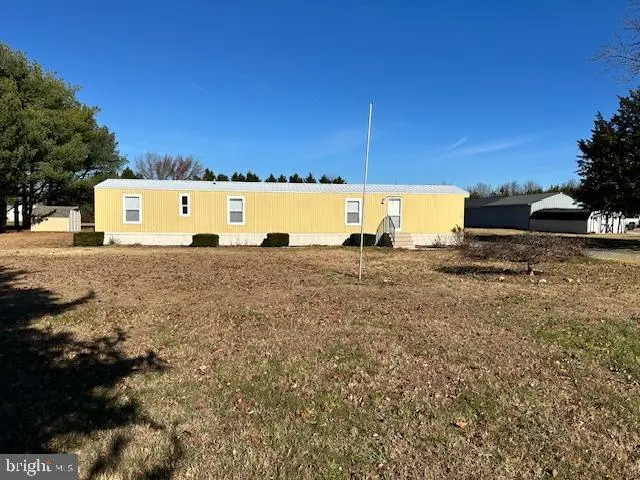
Discover the charm of this well-maintained 1993 Fleetwood manufactured home, offering a cozy retreat on a spacious 1.34-acre lot. With 980 sq. ft. of living space, this single-wide home features three inviting bedrooms and a full bathroom, perfect for relaxation and comfort. Step outside to find a generous front and rear yard, ideal for outdoor gatherings or quiet moments in nature. The ample driveway provides off-street parking for up to four vehicles, ensuring easy access for you and your guests. This property combines the warmth of home with the potential for outdoor enjoyment, making it a perfect choice for those seeking a peaceful lifestyle, yet close to shopping and just 30 minutes to the area's resort beaches. Plenty of room for a shop / detached garage. No HOA fees or city taxes. Embrace the opportunity to create lasting memories in this delightful space!
Key facts
- Ample driveway
- Spacious lot
- Generous front yard
Tags
Neighborhood map
What this means for you Summary
Snapshot
- This is a 3-bed/1.0-bath other listed at $240k.
Deal economics
- At list price, monthly cash flow is $-83 ($-990/yr) — negative.
- To cash-flow at today's rent, offer at most $228k (5.0% below list).
- To meet the 1% rule (rent ≥ 1% of price), the offer needs to be $200k (16.9% below list).
- Recommended offer: $200k (16.9% below list) — sets the bar for 1% rule.
- Cap rate 5.9% vs local median 3.6% in Milford — top-decile yield for the area; either an underpriced asset or a hidden risk that comps aren't pricing in. Stress-test before assuming the spread holds.
Location & tenants
- Location reads 62/100 on livability (#61 in DE) — a middle-class / working-renter tenant base. Strengths: cost of living A+, health & safety A+, housing A-; Watch: crime F, amenities F, commute F.
- Milford School District (town): math 18% / reading 32% proficiency, ranked #22 of 26 in DE (top 85%) — low school quality limits family demand, transient renter base, plan for 1-2y turnover.
- Zoned schools: Mispillion Elementary (math 13% / reading 27%, grade F, #76 of 105 statewide, top 72%, 561 students, 0% FRL); Milford Central Academy (math 21% / reading 36%, grade F, #17 of 36 statewide, top 46%, 1,068 students, 0% FRL); Milford Senior High School (math 17% / reading 32%, grade F, #27 of 40 statewide, top 69%, 1,279 students, 0% FRL) — zoned schools average 0% FRL vs 51% district-wide (51 pts lower); this property's tenant base skews higher-income than the district average.
- Market conditions: 208 active listings in the ZIP; 1 comparable units currently listed for rent nearby; 4,354 units permitted in Sussex County in 2024 (344 in 5+ unit buildings).
Forward outlook
- Local home prices are declining (-3.0%/yr); year-one equity from $2k of loan paydown is wiped out by about $7k of value loss. Plan a longer hold.
- Sussex County population projected at +25% by 2050 — long-run rental-demand tailwind backs the buy-and-hold thesis.
Negotiation context
- It's been on market 191 days — a 12% lower offer ($211k) is reasonable based on typical stale-listing flexibility.
- 2 sale attempts with the ask held roughly flat each time — persistent listings suggest the price (not the market) is what's stuck; bring a comps-based counter.
- Current owner paid $22k; list at $240k implies a 991% gain — meaningful room to come down on a strong offer.
Risks & watch-outs
- Climate carrying-cost: major flood risk; severe wind risk, 80% chance of damaging wind over 30y; extreme-heat days projected 7→16/yr by 2055 (HVAC capex compounding) — expect insurance premiums to compound above CPI over the hold.
Questions for the listing agent
- What do current leases actually rent for vs. the listed asking? Can we see a recent rent roll and the last 12 months of T-12 income?
- It's been on market 191 days. Have you received any prior offers? Is the seller open to a 17% concession, seller financing, or rate buy-down credit?
- Why hasn't it sold? Are there any deal-killer items the seller is aware of (foundation, flood, title, zoning, code violations)?
- Is there a deadline driving the sale (1031 exchange, divorce, estate, relocation)? That informs how much negotiation room exists.
- Schools are D-rated, which usually means shorter tenancies and higher turnover. Who's the typical renter profile here, and what's been the actual vacancy rate?
- Crime grade is F in this area — have there been break-ins, vandalism, or insurance claims at this property in the last 3 years? What carrier currently insures it and at what premium?
- The area grade is low — what's the realistic commute time and amenity access for the typical tenant pool here? Any planned neighborhood developments (good or bad) we should know about?
- What's the average days-on-market for RENTAL listings here right now (not sales)? A rising rental-DOM trend means longer vacancies and softer asking-rent achievability than the comps imply.
- What's the recent tenant-quality profile in this submarket — average credit score on applications, eviction rate, late-payment / NSF rate, and stable-employment percentage? A property-management company in the area should have these aggregated.
- How much new for-sale + rental construction is in the pipeline within 1–3 miles? Heavy new supply typically softens prices + rents 12–24 months out; constrained supply supports both.
Investment metrics
- 1% rule
- 0.83% ✗
- Cap rate
- 5.88%
- Cash-on-cash
- -1.47%
- DSCR
- 0.93
- GRM
- 10.0
CMA / ARV
- ARV (median comp)
- $275,822
- List price
- $240,000
- Delta
- -12.99%
- Verdict
- UNDERPRICED
- Comps
- 8 within 1.0 mi
Projected returns pro-forma
-3.0% appreciation · 3.0% rent growth · sell at horizon
- IRR
- -18.7%
- Equity multiple
- 0.34×
- Total profit
- $-44,117
- Equity at exit
- $35,785
- IRR
- -11.1%
- Equity multiple
- 0.33×
- Total profit
- $-45,063
- Equity at exit
- $20,751
Cash invested: $67,200 (down + closing). Projections, not guarantees.
Landlord ↔ Tenant lean methodology
- Overall (STATE)
- 70 Landlord-Friendly
- State Delaware
- 70 Landlord-Friendly · D+7
- County
- — inherits STATE
- City
- — inherits STATE
ZIP-level market 19963
- Active inventory
- 208
- Price-to-rent
- 10.0×
Monthly cashflow live
- Estimated rent
- $1,995 medium interval (Pro) →
- Mortgage (P&I)
- −$1,259
- Tax est. 1.5%
- −$300 /mo · $3,600/yr
- Insurance
- −$100
- HOA
- −$0
- Vacancy / Maint / Mgmt
- −$419
- Net cashflow
- $-83
Break-even live
Sensitivity live
| Price | -10% $83 | -5% $0 | +0% $-83 | +5% $-165 | +10% $-248 |
|---|---|---|---|---|---|
| Rent | -10% $-240 | -5% $-161 | +0% $-83 | +5% $-4 | +10% $75 |
| Rate | -1.0pp $38 | -0.5pp $-21 | base $-83 | +0.5pp $-145 | +1.0pp $-208 |
UW: 25.0% down · 7.5% · 30yr · 1.5% tax · 5.0% vac · 8.0% maint · 8.0% mgmt
Financing live
Cash to close
- Down payment
- $60,000
- Closing costs
- $7,200
- Reserves months
- —
- Total cash needed
- —
Loan-product check · same deal, 3 products live
Conventional
25% down · 7.5% · 30yr
- Down + closing
- —
- Monthly P&I
- —
- Monthly cashflow
- —
- DSCR
- —
- Eligible?
- —
Personal DTI + credit; lowest rate.
DSCR
20% down · 8.5% · 30yr
- Down + closing
- —
- Monthly P&I
- —
- Monthly cashflow
- —
- DSCR
- —
- Eligible?
- —
No personal income docs; deal must DSCR.
Hard money
10% down · 12.0% · 12mo
- Down + closing
- —
- Monthly P&I
- —
- Monthly cashflow
- —
- DSCR
- —
- Eligible?
- —
Short-term bridge; refi at stabilization.
Rent comps 1 comps
| Address | Beds | Baths | Sqft | Rent | $/sqft | DOM | Units | Dist |
|---|---|---|---|---|---|---|---|---|
| 300 Lynx Ln Milford, DE | 1.0–3.0 | 1.0–2.0 | 1272 | $1,995 | $1.57 | 23d | 1 | 1.01mi |
Listing history 21 events
-
2026-06-21days on market $240,000 Active 191 DOM
-
2026-06-19days on market $240,000 Active 189 DOM
-
2026-06-18days on market $240,000 Active 188 DOM
-
2026-06-17days on market $240,000 Active 187 DOM
-
2026-06-16days on market $240,000 Active 186 DOM
-
2026-06-15days on market $240,000 Active 185 DOM
-
2026-06-14days on market $240,000 Active 183 DOM
-
2026-06-13days on market $240,000 Active 182 DOM
-
2026-06-10days on market $240,000 Active 180 DOM
-
2026-06-09days on market $240,000 Active 179 DOM
-
2026-06-08days on market $240,000 Active 178 DOM
-
2026-06-07days on market $240,000 Active 177 DOM
-
2026-06-03days on market $240,000 Active 173 DOM
-
2026-06-02days on market $240,000 Active 172 DOM
-
2026-06-01days on market $240,000 Active 171 DOM
-
2026-05-31days on market $240,000 Active 170 DOM
-
2026-05-30days on market $240,000 Active 169 DOM
-
2026-04-25status Active 875-char remark
Show marketing remark (875 chars)
Discover the charm of this well-maintained 1993 Fleetwood manufactured home, offering a cozy retreat on a spacious 1.34-acre lot. With 980 sq. ft. of living space, this single-wide home features three inviting bedrooms and a full bathroom, perfect for relaxation and comfort. Step outside to find a generous front and rear yard, ideal for outdoor gatherings or quiet moments in nature. The ample driveway provides off-street parking for up to four vehicles, ensuring easy access for you and your guests. This property combines the warmth of home with the potential for outdoor enjoyment, making it a perfect choice for those seeking a peaceful lifestyle, yet close to shopping and just 30 minutes to the area's resort beaches. Plenty of room for a shop / detached garage. No HOA fees or city taxes. Embrace the opportunity to create lasting memories in this delightful space!
-
2026-04-16historical Active Under Contract 875-char remark
Show marketing remark (875 chars)
Discover the charm of this well-maintained 1993 Fleetwood manufactured home, offering a cozy retreat on a spacious 1.34-acre lot. With 980 sq. ft. of living space, this single-wide home features three inviting bedrooms and a full bathroom, perfect for relaxation and comfort. Step outside to find a generous front and rear yard, ideal for outdoor gatherings or quiet moments in nature. The ample driveway provides off-street parking for up to four vehicles, ensuring easy access for you and your guests. This property combines the warmth of home with the potential for outdoor enjoyment, making it a perfect choice for those seeking a peaceful lifestyle, yet close to shopping and just 30 minutes to the area's resort beaches. Plenty of room for a shop / detached garage. No HOA fees or city taxes. Embrace the opportunity to create lasting memories in this delightful space!
-
2025-12-03$240,000 Active 875-char remark
Show marketing remark (875 chars)
Discover the charm of this well-maintained 1993 Fleetwood manufactured home, offering a cozy retreat on a spacious 1.34-acre lot. With 980 sq. ft. of living space, this single-wide home features three inviting bedrooms and a full bathroom, perfect for relaxation and comfort. Step outside to find a generous front and rear yard, ideal for outdoor gatherings or quiet moments in nature. The ample driveway provides off-street parking for up to four vehicles, ensuring easy access for you and your guests. This property combines the warmth of home with the potential for outdoor enjoyment, making it a perfect choice for those seeking a peaceful lifestyle, yet close to shopping and just 30 minutes to the area's resort beaches. Plenty of room for a shop / detached garage. No HOA fees or city taxes. Embrace the opportunity to create lasting memories in this delightful space!
-
2002-06-06soldstatus $22,000
ⓘ Source: listings_history table (triggers on properties + properties_extension) + one-shot
backfill from property_details.listing_events for pre-trigger history.
Climate risk First Street
- Flood 6/10 Major FEMA zone X (unshaded) · 68% chance over 30 yrs
- Wildfire 3/10 Moderate
- Heat 8/10 Severe 7 d/yr ≥102°F today · 16 d/yr by 30 yrs out
- Wind 8/10 Severe 80% chance of damaging wind over 30 yrs
- Air quality 2/10 Low 1 unhealthy d/yr today · 1 by 30 yrs out
Nearby sold comps map
Loading sold comps map…
Walkable amenities ~0.75 mi
Loading nearby amenities…
Taxation est. · year 1
- Rental income
- $23,940
- − Mortgage interest
- −$13,444
- − Property taxes
- −$3,600
- − Insurance
- −$1,200
- − Repairs & maintenance
- −$1,915
- − Management
- −$1,915
- − Depreciation
- −$6,982
- Taxable loss
- −$5,116
- Est. tax savings @ 24.0%
- +$1,228
- After-tax cash flow
- $237/yr
For passive investors: Depreciation is non-cash, so a rental often shows a tax loss while cash-flowing — sheltering income. Rental losses are passive: they offset passive income freely, and up to $25,000/yr can offset ordinary (W-2) income if you actively participate and your MAGI is under $100k (phasing out to $0 by $150k); unused losses carry forward. On sale, claimed depreciation is recaptured at up to 25%, and gains may owe capital-gains tax (a 1031 exchange can defer both). Figures are a year-1 estimate at your 24.0% rate — not tax advice; consult a CPA.
Schools (NCES district)
- District
- Milford School District
- NCES district ID
- 1001080
- Math proficiency
- 18% ▼ -26.00%
- Reading proficiency
- 32% ▼ -19.00%
- Median HH income
- $51,794
- Composite
- 22.18/100
- National rank
- #8162
- State rank
- #22 of 26 in DE
Livability — Milford
- Score
- 62/100
- State rank
- #61
- US rank
- #16211
Category grades
Schools grade is shown separately in the Schools card above.
Census & demographics
- Population (ZIP)
- 22,544
Population outlook (Sussex County) Hauer SSP2
- Today (2025)
- 248,853 people
- By 2030
- 264,464 · +6.3%
- By 2040
- 290,980 · +16.9%
- By 2050
- 311,259 · +25.1%
- By 2075
- 352,488 · +41.6%
- By 2100
- 367,406 · +47.6%
Race, ethnicity, and origin ACS 2023
- Neighborhood character
- Diverse neighborhood (Simpson 0.56)
- Race & ethnicity
- White 62% Black 20% Hispanic / Latino 10% Two or more races 7% Asian 3%
- Hispanic origin (detail)
- Mexican 4% Puerto Rican 2%
- Common ancestry
- Hispanic 3% Romanian 2% Slovak 1%
- Foreign-born
- 11% · Canada, China
- Languages at home
- 84% English-only · Spanish 7% French/Haitian/Cajun 5% Other Indo-European 2%
Political lean MEDSL · Sussex
- 2024 margin
- R (+11.0) · D 43.9% · R 54.9% · Other 1.2%
- 2008→2024 swing
- -2.4pp toward R · 2008: -8.6pp · 2024: -11.0pp
- All cycles
- 2024: R+11.0 2020: R+11.2 2016: R+22.0 2012: R+13.0 2008: R+8.6
Not yet ingested
- Civics
- —
Market trends
- HPI YoY
- ▼ -135.01%
- Current HPI
- 227.2369
- Rent YoY
- —
- Metro
- —
- State GDP YoY
- —
- F500 in state
- 0
Price history
+990.9% since first listed4 events — show timeline
- 2026-04-25 Relisted — BRIGHT MLS
- 2026-04-16 Contingent — BRIGHT MLS
- 2025-12-03 Listed $240,000 BRIGHT MLS
- 2002-06-06 Sold (Public Records) $22,000 Public Records
Property tax history
-3.4%/yrLatest (2025): $258 · +104.7% YoY. Source: county tax records.
Cash-flow waterfall
monthlySold comps — $/sqft
last 12 mo · ≤1 miLoading sold comps…