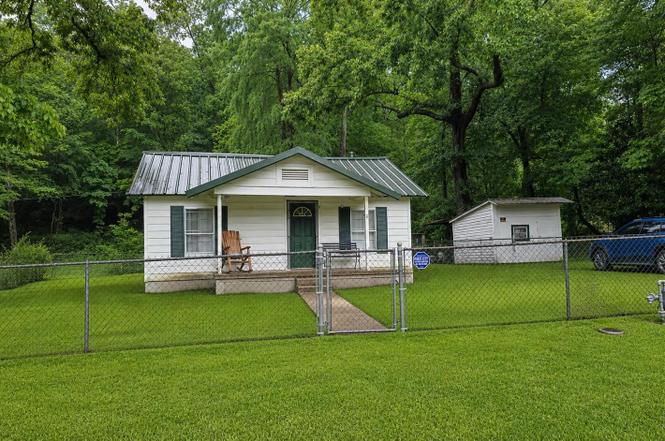
249 Highway 7 N · Hot Springs, AR
Flood risk 7/10 · Major
- FEMA flood zone
- X (unshaded)
- Chance of flooding over 30 yrs
- 0.99%
- Est. flood insurance / yr
- $507 – $1,088
Fire risk 6/10 · Moderate
- Est. fire insurance / yr
- $1,499 – $2,785
Heat risk 6/10 · Moderate
- Hot days now (above 111°F)
- 7 days/yr
- Hot days in 30 yrs
- 19 days/yr
Wind risk 3/10 · Minor
- Chance of severe wind over 30 yrs
- 8.0%
Air-quality risk 2/10 · Minimal
- Unhealthy air days now
- 0 days/yr
- Unhealthy air days in 30 yrs
- 1 days/yr
Risk factors via First Street. Map © Google.
Why this score? — see what drove the C+ grade
The composite is a weighted blend of 9 inputs, each scored 0–100. Each bar is that input's sub-score; the figure is the points it added to the 100-point composite (weight × sub-score).
- Cash flow +24.6/30.0
- ARV discount +15.0/15.0
- DSCR +8.0/10.0
- 1% rule +5.3/10.0
- Schools +3.6/10.0
- Livability +3.2/5.0
- Rent growth +2.5/5.0
- Condition / age +2.5/5.0
- Appreciation +0.0/10.0
$120,000
🖨 Deal sheet 📄 Offer letter ✓ Due diligence
Listing remarks
CUTE 1930's farmhouse!! This cute farmhouse sits on just over an acre. The home boasts hardwood floors, new interior paint, new gas range, new faucets and new commode. New gas water heater. Metal roof only 6 years old. Large laundry/ utility room. Fully fenced yard. Property goes beyond fence line. Outbuilding. level lot. Great location!! Located in Hot Springs just outside Fountain Lake. See agent remarks.
Key facts
- New gas range
- Metal roof
- New gas water heater
Tags
Property features AI
Finance
- HOA & community: No fee/None
Exterior
- Parking: Parking pads
- Utilities: Public water; Septic system
- Home design: Frame construction
- Construction: Crawl space foundation; Metal roof
- Exterior features: Fully fenced yard; Paved road access; Level lot
Interior
- Kitchen: Free-standing stove; Gas range
- Flooring: Wood flooring; Laminate flooring
- Bathrooms: 1 full bathroom
- Heating & cooling: Central gas heat; Window air conditioning units
- Interior features: Gas water heater; Ceiling fans
- Laundry & utility: Laundry room
Neighborhood map
What this means for you Summary
Snapshot
- This is a 2-bed/1.0-bath single-family listed at $120k.
Deal economics
- At list price, monthly cash flow is $183 ($2k/yr) — positive.
- The deal already cash-flows at list — no discount required.
- Meets the 1% rule at list price ($1k rent vs $120k).
- Recommended offer: $116k (3.0% below list) — sets the bar for market timing.
- Cap rate 8.8% vs local median 2.8% in Hot Springs — top-decile yield for the area; either an underpriced asset or a hidden risk that comps aren't pricing in. Stress-test before assuming the spread holds.
Location & tenants
- Location reads 65/100 on livability (#140 in AR) — a middle-class / working-renter tenant base. Strengths: cost of living A+, housing A+, health & safety A-; Watch: crime F, amenities F, commute F.
- Fountain Lake School District (rural): math 43% / reading 40% proficiency, ranked #49 of 238 in AR (top 21%) — families likely to look elsewhere, expect single-tenant / working-renter base with shorter leases.
- Zoned schools: Fountain Lake Elementary (math 55% / reading 35%, grade D-, #138 of 454 statewide, top 31%, 514 students, 54% FRL).
- Market conditions: 766 active listings in the ZIP; 2 comparable units currently listed for rent nearby; solid renter incomes; 117 units permitted in Garland County in 2024 (24 in 5+ unit buildings).
Forward outlook
- Local home prices are declining (-3.0%/yr); year-one equity from $830 of loan paydown is wiped out by about $4k of value loss. Plan a longer hold.
- Garland County population projected at +7% by 2050 — modest demand growth; plan on rents tracking national, not racing it.
Negotiation context
- It's been on market 44 days — a 3% lower offer ($116k) is reasonable based on typical stale-listing flexibility.
- 2 sale attempts with the ask held roughly flat each time — persistent listings suggest the price (not the market) is what's stuck; bring a comps-based counter.
- Current owner paid $22k; list at $120k implies a 445% gain — meaningful room to come down on a strong offer.
Risks & watch-outs
- Watch-outs: flood insurance adds $66/mo; built in 1930 — expect roof / HVAC / electrical / plumbing capex.
- Climate carrying-cost: major flood risk; major wildfire risk; extreme-heat days projected 7→19/yr by 2055 (HVAC capex compounding) — expect insurance premiums to compound above CPI over the hold.
Questions for the listing agent
- It's been on market 44 days. Have you received any prior offers? Is the seller open to a 3% concession, seller financing, or rate buy-down credit?
- Built in 1930 — when were the roof, HVAC, electrical panel, plumbing, and water heater last replaced?
- What's the actual annual flood-insurance premium (NFIP or private), and is the property in a SFHA with mandatory coverage?
- Is there a deadline driving the sale (1031 exchange, divorce, estate, relocation)? That informs how much negotiation room exists.
- Schools are D-rated, which usually means shorter tenancies and higher turnover. Who's the typical renter profile here, and what's been the actual vacancy rate?
- Crime grade is F in this area — have there been break-ins, vandalism, or insurance claims at this property in the last 3 years? What carrier currently insures it and at what premium?
- What's the average days-on-market for RENTAL listings here right now (not sales)? A rising rental-DOM trend means longer vacancies and softer asking-rent achievability than the comps imply.
- What's the recent tenant-quality profile in this submarket — average credit score on applications, eviction rate, late-payment / NSF rate, and stable-employment percentage? A property-management company in the area should have these aggregated.
- How much new for-sale + rental construction is in the pipeline within 1–3 miles? Heavy new supply typically softens prices + rents 12–24 months out; constrained supply supports both.
Investment metrics
- 1% rule
- 1.03% ✓
- Cap rate
- 8.78%
- Cash-on-cash
- 8.89%
- DSCR
- 1.40
- GRM
- 8.1
CMA / ARV
- ARV (median comp)
- $159,297
- List price
- $120,000
- Delta
- -24.67%
- Verdict
- UNDERPRICED
- Comps
- 2 within 1.0 mi
Projected returns pro-forma
-3.0% appreciation · 3.0% rent growth · sell at horizon
- IRR
- -6.3%
- Equity multiple
- 0.77×
- Total profit
- $-7,819
- Equity at exit
- $17,892
- IRR
- 3.4%
- Equity multiple
- 1.24×
- Total profit
- $8,152
- Equity at exit
- $10,375
Cash invested: $33,600 (down + closing). Projections, not guarantees.
Landlord ↔ Tenant lean methodology
- Overall (STATE)
- 92 Strongly Landlord-Friendly
- State Arkansas
- 92 Strongly Landlord-Friendly · R+14
- County
- — inherits STATE
- City
- — inherits STATE
ZIP-level market 71909
- Home prices YoY
- -10.9%
- Active inventory
- 766
- Price-to-rent
- 8.1×
Monthly cashflow live
- Estimated rent
- $1,235 medium interval (Pro) →
- Mortgage (P&I)
- −$629
- Tax from tax record
- −$48 /mo · $571/yr
- Insurance
- −$50
- Flood insurance flood zone
- −$66 /mo · $798/yr
- HOA
- −$0
- Vacancy / Maint / Mgmt
- −$259
- Net cashflow
- $183
Break-even live
UW: 25.0% down · 7.5% · 30yr · 1.5% tax · 5.0% vac · 8.0% maint · 8.0% mgmt
Financing live
Cash to close
- Down payment
- $30,000
- Closing costs
- $3,600
- Reserves months
- —
- Total cash needed
- —
Loan-product check · same deal, 3 products live
Conventional
25% down · 7.5% · 30yr
- Down + closing
- —
- Monthly P&I
- —
- Monthly cashflow
- —
- DSCR
- —
- Eligible?
- —
Personal DTI + credit; lowest rate.
DSCR
20% down · 8.5% · 30yr
- Down + closing
- —
- Monthly P&I
- —
- Monthly cashflow
- —
- DSCR
- —
- Eligible?
- —
No personal income docs; deal must DSCR.
Hard money
10% down · 12.0% · 12mo
- Down + closing
- —
- Monthly P&I
- —
- Monthly cashflow
- —
- DSCR
- —
- Eligible?
- —
Short-term bridge; refi at stabilization.
Rent comps 2 comps
| Address | Beds | Baths | Sqft | Rent | $/sqft | DOM | Units | Dist |
|---|---|---|---|---|---|---|---|---|
| 153 Baywood Trl Hot Springs Village, AR | 2.0 | 2.0 | 1000 | $850 | $0.85 | 23d | 1 | 0.94mi |
| 140 Baywood Trl Hot Springs Village, AR | 3.0 | 2.0 | 1100 | $1,000 | $0.91 | 23d | 1 | 0.96mi |
Listing history 21 events
-
2026-06-19days on market $120,000 Active 44 DOM
-
2026-06-18days on market $120,000 Active 43 DOM
-
2026-06-17days on market $120,000 Active 42 DOM
-
2026-06-16days on market $120,000 Active 41 DOM
-
2026-06-15statusdays on market $120,000 Active 40 DOM
-
2026-06-14days on market $120,000 Back on Market 38 DOM
-
2026-06-13days on market $120,000 Back on Market 37 DOM
-
2026-06-10days on market $120,000 Back on Market 35 DOM
-
2026-06-09days on market $120,000 Back on Market 34 DOM
-
2026-06-09status $120,000 Back on Market 33 DOM
-
2026-06-08days on market $120,000 Take Backups 33 DOM
-
2026-06-07days on market $120,000 Take Backups 32 DOM
-
2026-06-03days on market $120,000 Take Backups 28 DOM
-
2026-06-02days on market $120,000 Take Backups 27 DOM
-
2026-06-01days on market $120,000 Take Backups 26 DOM
-
2026-05-31days on market $120,000 Take Backups 25 DOM
-
2026-05-30days on market $120,000 Take Backups 24 DOM
-
2026-05-10historical Take Backups 410-char remark
-
2026-05-06$120,000 New Listing 410-char remark
-
2017-03-01soldstatus $22,000
-
2003-10-02soldstatus $33,000
ⓘ Source: listings_history table (triggers on properties + properties_extension) + one-shot
backfill from property_details.listing_events for pre-trigger history.
Tax reassessment forecast AR · Resets to sale price
- Current annual tax
- $571 · $48/mo
- Projected year-2 tax
- $768 · $64/mo
- Expected delta
- +$197/yr (+$16/mo · 34.4%)
ⓘ Screening estimate from a state-policy table — verify with the county assessor before closing.
Climate risk First Street
- Flood 7/10 Severe FEMA zone X (unshaded) · 99% chance over 30 yrs
- Wildfire 6/10 Major
- Heat 6/10 Major 7 d/yr ≥111°F today · 19 d/yr by 30 yrs out
- Wind 3/10 Moderate 8% chance of damaging wind over 30 yrs
- Air quality 2/10 Low 0 unhealthy d/yr today · 1 by 30 yrs out
Nearby sold comps map
Loading sold comps map…
Walkable amenities ~0.75 mi
Loading nearby amenities…
Taxation est. · year 1
- Rental income
- $14,825
- − Mortgage interest
- −$6,722
- − Property taxes
- −$571
- − Insurance
- −$1,398
- − Repairs & maintenance
- −$1,186
- − Management
- −$1,186
- − Depreciation
- −$3,491
- Taxable income
- $271
- Est. tax owed @ 24.0%
- −$65
- After-tax cash flow
- $2,126/yr
For passive investors: Depreciation is non-cash, so a rental often shows a tax loss while cash-flowing — sheltering income. Rental losses are passive: they offset passive income freely, and up to $25,000/yr can offset ordinary (W-2) income if you actively participate and your MAGI is under $100k (phasing out to $0 by $150k); unused losses carry forward. On sale, claimed depreciation is recaptured at up to 25%, and gains may owe capital-gains tax (a 1031 exchange can defer both). Figures are a year-1 estimate at your 24.0% rate — not tax advice; consult a CPA.
Schools (NCES district)
- District
- Fountain Lake School District
- NCES district ID
- 0506420
- Math proficiency
- 43% ▼ -10.00%
- Reading proficiency
- 40% ▼ -6.00%
- Median HH income
- $52,435
- Composite
- 35.99/100
- National rank
- #4789
- State rank
- #49 of 238 in AR
Livability — Hot Springs
- Score
- 65/100
- State rank
- #140
- US rank
- #12498
Category grades
Schools grade is shown separately in the Schools card above.
Census & demographics
- County
- Saline County · 77,216 people
- City population
- 76,414
- Metro
- Little Rock-North Little Rock-Conway, AR
- Population (ZIP)
- 18,449
- Household income
- $75,433
- Rent vs Own
- Severe rent burden
- 207.0
Population outlook (Garland County) Hauer SSP2
- Today (2025)
- 100,343 people
- By 2030
- 101,880 · +1.5%
- By 2040
- 104,804 · +4.4%
- By 2050
- 107,292 · +6.9%
- By 2075
- 113,182 · +12.8%
- By 2100
- 112,247 · +11.9%
Race, ethnicity, and origin ACS 2023
- Neighborhood character
- Predominantly White (93%)
- Race & ethnicity
- White 93% Two or more races 3% Hispanic / Latino 2%
- Common ancestry
- Slovak 3% Romanian 3% Serbian 2%
- Foreign-born
- 2% · Canada, Vietnam
- Languages at home
- 97% English-only · Spanish 1%
Political lean MEDSL · Garland
- 2024 margin
- Solid R (+36.2) · D 30.8% · R 67.0% · Other 2.2%
- 2008→2024 swing
- -11.3pp toward R · 2008: -25.0pp · 2024: -36.2pp
- All cycles
- 2024: R+36.2 2020: R+34.0 2016: R+34.1 2012: R+29.9 2008: R+25.0
Not yet ingested
- Civics
- —
Market trends
- HPI YoY
- ▼ -24.00%
- Current HPI
- 195.9499
- Rent YoY
- —
- Metro
- Little Rock-North Little Rock-Conway, AR
- State GDP YoY
- ▲ 3.80%
- F500 in state
- 10
Industry mix (Fortune 500 HQ in AR)
| Industry | F500 HQs | Revenue |
|---|---|---|
| Retail | 1 | $681B |
|
||
| Food / Agriculture | 1 | $53B |
|
||
| Retail / Energy | 1 | $22B |
|
||
| Transportation / Logistics | 1 | $12B |
|
||
| Energy | 1 | $4B |
|
||
Price history
+263.6% since first listed5 events — show timeline
- 2026-06-08 Relisted — CARMLS
- 2026-05-10 Contingent — CARMLS
- 2026-05-06 Listed $120,000 CARMLS
- 2017-03-01 Sold (Public Records) $22,000 Public Records
- 2003-10-02 Sold (Public Records) $33,000 Public Records
Property tax history
+3.8%/yrLatest (2025): $571 · +5.5% YoY. Source: county tax records.
Cash-flow waterfall
monthlySold comps — $/sqft
last 12 mo · ≤1 miLoading sold comps…