 🌊 Lakefront
155 S Shore Dr · Highland Acres, DE
Flood risk 1/10 · Minimal
- FEMA flood zone
- X (unshaded)
- Chance of flooding over 30 yrs
- 0.0%
- Est. flood insurance / yr
- $507 – $1,088
Fire risk 1/10 · Minimal
- Est. fire insurance / yr
- $476 – $884
Heat risk 8/10 · Major
- Hot days now (above 102°F)
- 7 days/yr
- Hot days in 30 yrs
- 15 days/yr
Wind risk 8/10 · Major
- Chance of severe wind over 30 yrs
- 80.0%
Air-quality risk 2/10 · Minimal
- Unhealthy air days now
- 1 days/yr
- Unhealthy air days in 30 yrs
- 2 days/yr
Risk factors via First Street. Map © Google.
Why this score? — see what drove the B- grade
The composite is a weighted blend of 9 inputs, each scored 0–100. Each bar is that input's sub-score; the figure is the points it added to the 100-point composite (weight × sub-score).
- Cash flow +30.0/30.0
- DSCR +10.0/10.0
- 1% rule +9.4/10.0
- ARV discount +7.5/15.0
- Livability +3.5/5.0
- Schools +3.3/10.0
- Rent growth +3.0/5.0
- Condition / age +2.5/5.0
- Appreciation +0.0/10.0
$162,000
🖨 Deal sheet 📄 Offer letter ✓ Due diligence
Listing remarks
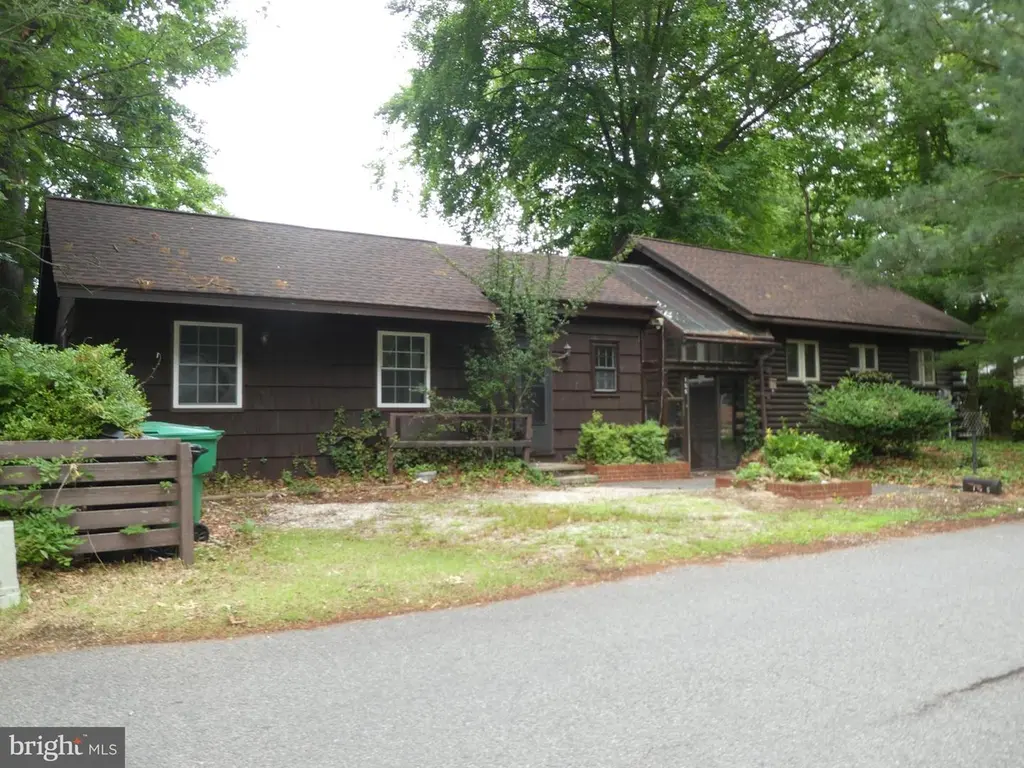
Rare opportunity for affordable lakefront living on Moore’s Lake! This charming log cabin is tucked away on a quiet dead-end street while still being conveniently located close to everything Dover has to offer. Enjoy beautiful water views from multiple decks and the enclosed porch off the primary bedroom. Perfect for nature lovers looking for a peaceful retreat. The family room features a cozy fireplace, and the walkout lower level includes a bedroom with its own full bath—ideal for guests or additional living space. Homes on Moore’s Lake at this price point are hard to find. Schedule your showing today!
Key facts
- Lakefront living
- Water views
- Walkout lower level
Tags
Neighborhood map
What this means for you Summary
Snapshot
- This is a 3-bed/2.0-bath other listed at $162k.
Deal economics
- At list price, monthly cash flow is $793 ($10k/yr) — positive.
- The deal already cash-flows at list — no discount required.
- Meets the 1% rule at list price ($2k rent vs $162k).
Location & tenants
- Location reads 70/100 on livability (#22 in DE) — a middle-class / working-renter tenant base. Strengths: employment A+, housing A+, crime A; Watch: amenities F, commute F, health & safety F.
- Caesar Rodney School District (suburban): math 26% / reading 49% proficiency, ranked #9 of 26 in DE (top 35%) — families likely to look elsewhere, expect single-tenant / working-renter base with shorter leases.
- Market conditions: Rents rising (+2.0%/yr); 184 active listings in the ZIP; 5 comparable units currently listed for rent nearby; rentals lingering (median 44d on market — plan ~5-8 weeks vacancy on turnover, expect pricing pressure); 100% of comp listings sitting > 30 days — soft ceiling on asking rent; 1,201 units permitted in Kent County in 2024 (116 in 5+ unit buildings).
- This rent runs 42% of the median local income ($66k/yr) — at the standard rent-burdened threshold; future hikes will face affordability resistance.
Forward outlook
- Local home prices are declining (-3.0%/yr); year-one equity from $1k of loan paydown is wiped out by about $5k of value loss. Plan a longer hold.
- Kent County population projected at +22% by 2050 — long-run rental-demand tailwind backs the buy-and-hold thesis.
- At projected returns (-3.0% appreciation + 2.0% rent growth), your $45k cash investment doubles in ~7 years — after that, you're playing with house money.
Negotiation context
- Only 8 days on market — expect competitive offers; lowballing is unlikely to land.
- 6 sale attempts since 21y ago with the ask held roughly flat each time — persistent listings suggest the price (not the market) is what's stuck; bring a comps-based counter.
Risks & watch-outs
- Watch-outs: built in 1950 — expect roof / HVAC / electrical / plumbing capex.
- Climate carrying-cost: severe wind risk, 80% chance of damaging wind over 30y; extreme-heat days projected 7→15/yr by 2055 (HVAC capex compounding) — expect insurance premiums to compound above CPI over the hold.
Questions for the listing agent
- Built in 1950 — when were the roof, HVAC, electrical panel, plumbing, and water heater last replaced?
- Is there a deadline driving the sale (1031 exchange, divorce, estate, relocation)? That informs how much negotiation room exists.
- This sits on a lake — are riparian / water-frontage rights deeded with the parcel? Any dock permits, shoreline easements, or HOA water-use restrictions?
- What's the documented flood / surge / shoreline-erosion history here (FEMA AND non-FEMA — e.g., storm surge, creek backup, septic-field saturation)?
- Any water-quality or seasonal algae-bloom issues that affect tenant satisfaction or short-term-rental demand?
- What's the average days-on-market for RENTAL listings here right now (not sales)? A rising rental-DOM trend means longer vacancies and softer asking-rent achievability than the comps imply.
- What's the recent tenant-quality profile in this submarket — average credit score on applications, eviction rate, late-payment / NSF rate, and stable-employment percentage? A property-management company in the area should have these aggregated.
- How much new for-sale + rental construction is in the pipeline within 1–3 miles? Heavy new supply typically softens prices + rents 12–24 months out; constrained supply supports both.
Investment metrics
- 1% rule
- 1.44% ✓
- Cap rate
- 12.16%
- Cash-on-cash
- 20.97%
- DSCR
- 1.93
- GRM
- 5.8
CMA / ARV
No comps found within radius.
Projected returns pro-forma
-3.0% appreciation · 2.03% rent growth · sell at horizon
- IRR
- 12.3%
- Equity multiple
- 1.48×
- Total profit
- $21,960
- Equity at exit
- $24,155
- IRR
- 20.5%
- Equity multiple
- 2.65×
- Total profit
- $75,006
- Equity at exit
- $14,007
Cash invested: $45,360 (down + closing). Projections, not guarantees.
Landlord ↔ Tenant lean methodology
- Overall (STATE)
- 70 Landlord-Friendly
- State Delaware
- 70 Landlord-Friendly · D+7
- County
- — inherits STATE
- City
- — inherits STATE
ZIP-level market 19901
- Rents YoY
- 2.0%
- Active inventory
- 184
- Price-to-rent
- 5.8×
Monthly cashflow live
- Estimated rent
- $2,337 high interval (Pro) →
- Mortgage (P&I)
- −$850
- Tax from tax record
- −$136 /mo · $1,636/yr
- Insurance
- −$68
- HOA
- −$0
- Vacancy / Maint / Mgmt
- −$491
- Net cashflow
- $793
Break-even live
UW: 25.0% down · 7.5% · 30yr · 1.5% tax · 5.0% vac · 8.0% maint · 8.0% mgmt
Financing live
Cash to close
- Down payment
- $40,500
- Closing costs
- $4,860
- Reserves months
- —
- Total cash needed
- —
Loan-product check · same deal, 3 products live
Conventional
25% down · 7.5% · 30yr
- Down + closing
- —
- Monthly P&I
- —
- Monthly cashflow
- —
- DSCR
- —
- Eligible?
- —
Personal DTI + credit; lowest rate.
DSCR
20% down · 8.5% · 30yr
- Down + closing
- —
- Monthly P&I
- —
- Monthly cashflow
- —
- DSCR
- —
- Eligible?
- —
No personal income docs; deal must DSCR.
Hard money
10% down · 12.0% · 12mo
- Down + closing
- —
- Monthly P&I
- —
- Monthly cashflow
- —
- DSCR
- —
- Eligible?
- —
Short-term bridge; refi at stabilization.
Rent comps 5 comps
| Address | Beds | Baths | Sqft | Rent | $/sqft | DOM | Units | Dist |
|---|---|---|---|---|---|---|---|---|
| 200 Beechwood Ave Unit 55 Dover, DE | 2.0 | 2.0 | 1168 | $1,550 | $1.33 | 43d | 1 | 0.69mi |
| 215 Royal Grant Way Dover, DE | 4.0 | 2.5 | 2028 | $2,500 | $1.23 | 43d | 1 | 1.19mi |
| 541 Ruth Way Dover, DE | 4.0 | 2.5 | 1761 | $3,200 | $1.82 | 43d | 1 | 1.44mi |
| 511 Nickerjack Way Dover, DE | 3.0 | 2.0 | 1569 | $2,800 | $1.78 | 43d | 1 | 1.47mi |
| 502 Horsey Blvd Dover, DE | 3.0 | 2.0 | 1604 | $2,900 | $1.81 | 43d | 1 | 1.49mi |
Listing history 18 events
-
2026-05-04status Pending
-
2026-04-22historical
-
2026-04-14$162,000 Active
-
2023-11-07status Pending
-
2023-10-30historical
-
2023-10-30historical
-
2023-10-30price $180,000
-
2023-10-23$136,000 Active
-
2023-07-01status Pending
-
2023-06-29historical
-
2023-06-29historical
-
2023-06-16$180,000 Active
-
2007-06-20historical
-
2007-06-19historical
-
2007-01-07$297,000
-
2007-01-07$297,000
-
2006-09-06historical
-
2005-11-07$336,000
ⓘ Source: listings_history table (triggers on properties + properties_extension) + one-shot
backfill from property_details.listing_events for pre-trigger history.
Tax reassessment forecast DE · Partial reset (capped growth)
- Current annual tax
- $1,636 · $136/mo
- Projected year-2 tax
- $1,636 · $136/mo
- Expected delta
- $0/yr ($0/mo · 0.0%)
ⓘ Screening estimate from a state-policy table — verify with the county assessor before closing.
Climate risk First Street
- Flood 1/10 Low FEMA zone X (unshaded) · 0% chance over 30 yrs
- Wildfire 1/10 Low
- Heat 8/10 Severe 7 d/yr ≥102°F today · 15 d/yr by 30 yrs out
- Wind 8/10 Severe 80% chance of damaging wind over 30 yrs
- Air quality 2/10 Low 1 unhealthy d/yr today · 2 by 30 yrs out
Nearby sold comps map
Loading sold comps map…
Walkable amenities ~0.75 mi
Loading nearby amenities…
Taxation est. · year 1
- Rental income
- $28,039
- − Mortgage interest
- −$9,075
- − Property taxes
- −$1,636
- − Insurance
- −$810
- − Repairs & maintenance
- −$2,243
- − Management
- −$2,243
- − Depreciation
- −$4,713
- Taxable income
- $7,319
- Est. tax owed @ 24.0%
- −$1,757
- After-tax cash flow
- $7,753/yr
For passive investors: Depreciation is non-cash, so a rental often shows a tax loss while cash-flowing — sheltering income. Rental losses are passive: they offset passive income freely, and up to $25,000/yr can offset ordinary (W-2) income if you actively participate and your MAGI is under $100k (phasing out to $0 by $150k); unused losses carry forward. On sale, claimed depreciation is recaptured at up to 25%, and gains may owe capital-gains tax (a 1031 exchange can defer both). Figures are a year-1 estimate at your 24.0% rate — not tax advice; consult a CPA.
Schools (NCES district)
- District
- Caesar Rodney School District
- NCES district ID
- 1000180
- Math proficiency
- 26% ▼ -21.00%
- Reading proficiency
- 49% ▼ -14.00%
- Median HH income
- $61,187
- Composite
- 33.4/100
- National rank
- #5475
- State rank
- #9 of 26 in DE
Livability — Highland Acres
- Score
- 70/100
- State rank
- #22
- US rank
- #7537
Category grades
Schools grade is shown separately in the Schools card above.
Census & demographics
- Census place
- Highland Acres, DE
- County
- Kent County · 82,184 people
- Metro
- Dover, DE
- Population (ZIP)
- 37,763
- Household income
- $66,388
- Rent vs Own
- Severe rent burden
- 1320.0
Population outlook (Kent County) Hauer SSP2
- Today (2025)
- 194,477 people
- By 2030
- 204,351 · +5.1%
- By 2040
- 222,135 · +14.2%
- By 2050
- 236,483 · +21.6%
- By 2075
- 266,327 · +36.9%
- By 2100
- 275,335 · +41.6%
Race, ethnicity, and origin ACS 2023
- Neighborhood character
- Diverse neighborhood (Simpson 0.68)
- Race & ethnicity
- White 44% Black 34% Hispanic / Latino 13% Two or more races 11% Asian 2%
- Hispanic origin (detail)
- Mexican 3% Puerto Rican 6%
- Common ancestry
- Romanian 2% Hispanic 1% Lithuanian 1%
- Foreign-born
- 7% · Canada, South Korea
- Languages at home
- 88% English-only · Spanish 7% French/Haitian/Cajun 1% Other Asian/Pacific 1%
Political lean MEDSL · Kent
- 2024 margin
- Toss-up / Even · D 50.2% · R 48.2% · Other 1.7%
- 2008→2024 swing
- -7.8pp toward R · 2008: 9.8pp · 2024: 2.0pp
- All cycles
- 2024: D+2.0 2020: D+4.1 2016: R+4.9 2012: D+4.9 2008: D+9.8
Not yet ingested
- Civics
- —
Market trends
- HPI YoY
- ▼ -113.29%
- Current HPI
- 199.5132
- Rent YoY
- ▲ 2.03%
- Metro
- Dover, DE
- State GDP YoY
- —
- F500 in state
- 0
Price history
-51.8% since first listed18 events — show timeline
- 2026-05-04 Pending — BRIGHT MLS
- 2026-04-22 Listing Removed — BRIGHT MLS
- 2026-04-14 Listed $162,000 BRIGHT MLS
- 2023-11-07 Pending — BRIGHT MLS
- 2023-10-30 Price Changed $180,000 BRIGHT MLS
- 2023-10-30 Listing Removed — BRIGHT MLS
- 2023-10-30 Listing Removed — BRIGHT MLS
- 2023-10-23 Listed $136,000 BRIGHT MLS
- 2023-07-01 Pending — BRIGHT MLS
- 2023-06-29 Listing Removed — BRIGHT MLS
- 2023-06-29 Listing Removed — BRIGHT MLS
- 2023-06-16 Listed $180,000 BRIGHT MLS
- 2007-06-20 Listing Removed — BRIGHT MLS
- 2007-06-19 Listing Removed — BRIGHT MLS
- 2007-01-07 Listed $297,000 BRIGHT MLS
- 2007-01-07 Listed $297,000 BRIGHT MLS
- 2006-09-06 Listing Removed — BRIGHT MLS
- 2005-11-07 Listed $336,000 BRIGHT MLS
Property tax history
+8.2%/yrLatest (2025): $1,636 · +2.2% YoY. Source: county tax records.
Cash-flow waterfall
monthlySold comps — $/sqft
last 12 mo · ≤1 miLoading sold comps…