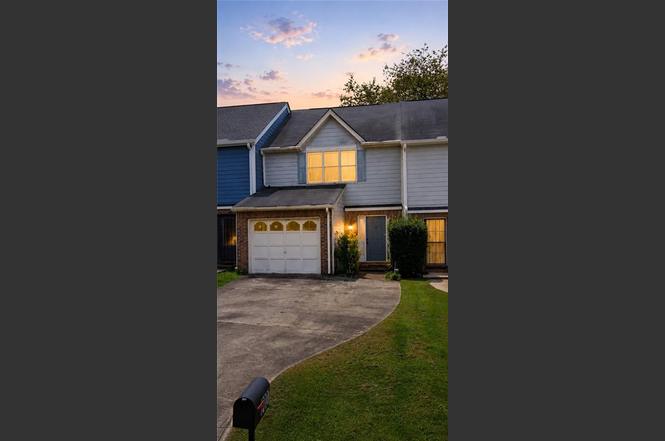
8007 Woodlake Dr · Riverdale, GA
Flood risk 1/10 · Minimal
- FEMA flood zone
- X (unshaded)
- Chance of flooding over 30 yrs
- 0.0%
- Est. flood insurance / yr
- $507 – $1,088
Fire risk 2/10 · Minimal
- Est. fire insurance / yr
- $963 – $1,789
Heat risk 6/10 · Moderate
- Hot days now (above 105°F)
- 7 days/yr
- Hot days in 30 yrs
- 18 days/yr
Wind risk 6/10 · Moderate
- Chance of severe wind over 30 yrs
- 27.0%
Air-quality risk 4/10 · Minor
- Unhealthy air days now
- 4 days/yr
- Unhealthy air days in 30 yrs
- 6 days/yr
Risk factors via First Street. Map © Google.
Why this score? — see what drove the B+ grade
The composite is a weighted blend of 9 inputs, each scored 0–100. Each bar is that input's sub-score; the figure is the points it added to the 100-point composite (weight × sub-score).
- Cash flow +30.0/30.0
- ARV discount +15.0/15.0
- 1% rule +10.0/10.0
- DSCR +10.0/10.0
- Livability +3.5/5.0
- Rent growth +2.8/5.0
- Condition / age +2.5/5.0
- Schools +1.3/10.0
- Appreciation +0.0/10.0
$99,000
🖨 Deal sheet (PDF) 📄 Offer letter ✓ Due diligence
Listing remarks MLS
Welcome home to this spacious 2-bedroom, 2.5-bath townhome nestled in the established Woodlake community of Riverdale. Offering approximately 1,500 square feet of living space, this well-designed residence features a functional floor plan with generously sized bedrooms, each providing comfort and privacy. A cozy fireplace serves as the focal point of the living area, creating the perfect space to relax or entertain guests. The home boasts a brick exterior, low-maintenance living, and ample space for first-time homebuyers, downsizers, or investors looking to expand their portfolio. Conveniently located near shopping, dining, major highways, and just minutes from Atlanta and Hartsfield-Jackson Airport, this property offers both accessibility and value. Whether you're searching for your next home or a great investment opportunity, 8007 Woodlake Drive delivers comfort, convenience, and affordability in one package. Schedule your showing today and discover all the potential this Riverdale gem has to offer!
Key facts
- 2 garage spots
- Built 1986
- Listed 8 days
Property features AI
Exterior
- Parking: 2-car garage; Garage parking
- Utilities: Public water; Public sewer; Cable available; Electricity available; Water available
- Home design: Two levels; Resale property; Ownership: Other
- Construction: Composition roof; Slab foundation; Construction materials: Other
- Exterior features: Asphalt road access; Public water and public sewer (listed under utilities)
Interior
- Kitchen: Breakfast bar; Electric oven; Dishwasher
- Bedrooms: 2 bedrooms on the upper level; No special bedroom features listed
- Flooring: Carpet
- Bathrooms: 2 full bathrooms; 1 half bathroom; All upper-level baths: 2 full and 1 half; Master bathroom: none listed
- Heating & cooling: Central air; Ceiling fan(s); Heating: other
- Interior features: Wet bar; 2+ common walls
- Laundry & utility: Gas dryer hookup; Dryer included
Neighborhood map
What this means for you Summary
Snapshot
- This is a 2-bed/3.0-bath townhouse listed at $99k.
Deal economics
- At list price, monthly cash flow is $464 ($6k/yr) — positive.
- The deal already cash-flows at list — no discount required.
- Meets the 1% rule at list price ($2k rent vs $99k).
- Cap rate 11.9% vs local median 5.5% in Riverdale — top-decile yield for the area; either an underpriced asset or a hidden risk that comps aren't pricing in. Stress-test before assuming the spread holds.
Location & tenants
- Location reads 70/100 on livability (#100 in GA) — a middle-class / working-renter tenant base. Strengths: cost of living A+, housing A+; Watch: crime D, amenities F, commute F.
- Clayton County (suburban): math 11% / reading 20% proficiency, ranked #155 of 174 in GA (top 89%) — low school quality limits family demand, transient renter base, plan for 1-2y turnover; 78% free/reduced lunch — lower-income household profile, screen leases tightly.
- Zoned schools: Callaway Elementary School (math 24% / reading 24%, grade F, #753 of 1,228 statewide, top 64%, 706 students, 90% FRL); Kendrick Middle School (math 17% / reading 27%, grade F, #333 of 470 statewide, top 72%, 696 students, 90% FRL); Riverdale High School (math 12% / reading 17%, grade F, #315 of 424 statewide, top 76%, 1,333 students, 90% FRL).
- Market conditions: Rents rising (+1.3%/yr); 189 active listings in the ZIP; 40 comparable units currently listed for rent nearby; rentals leasing fast (median 7d on market — plan ~1-2 weeks tenant-placement turnaround); 865 units permitted in Clayton County in 2024 (448 in 5+ unit buildings).
- This rent runs 36% of the median local income ($52k/yr) — at the standard rent-burdened threshold; future hikes will face affordability resistance.
Forward outlook
- Local home prices are declining (-3.0%/yr); year-one equity from $684 of loan paydown is wiped out by about $3k of value loss. Plan a longer hold.
- Clayton County population projected at +29% by 2050 — long-run rental-demand tailwind backs the buy-and-hold thesis.
- At projected returns (-3.0% appreciation + 1.3% rent growth), your $28k cash investment doubles in ~7 years — after that, you're playing with house money.
Negotiation context
- Only 8 days on market — expect competitive offers; lowballing is unlikely to land.
- 2 sale attempts with the ask held roughly flat each time — persistent listings suggest the price (not the market) is what's stuck; bring a comps-based counter.
- Current owner paid $86k; 15% above their basis — modest negotiation headroom, anchor on the comps not their cost.
Risks & watch-outs
- Watch-outs: property tax is 2.5% of price.
- Climate carrying-cost: major wind risk, 27% chance of damaging wind over 30y; extreme-heat days projected 7→18/yr by 2055 (HVAC capex compounding) — expect insurance premiums to compound above CPI over the hold.
Questions for the listing agent
- Property tax is high relative to price — has the assessment been appealed recently, and will the sale trigger a re-assessment?
- Is there a deadline driving the sale (1031 exchange, divorce, estate, relocation)? That informs how much negotiation room exists.
- Schools are D-rated, which usually means shorter tenancies and higher turnover. Who's the typical renter profile here, and what's been the actual vacancy rate?
- Crime grade is D in this area — have there been break-ins, vandalism, or insurance claims at this property in the last 3 years? What carrier currently insures it and at what premium?
- What's the average days-on-market for RENTAL listings here right now (not sales)? A rising rental-DOM trend means longer vacancies and softer asking-rent achievability than the comps imply.
- What's the recent tenant-quality profile in this submarket — average credit score on applications, eviction rate, late-payment / NSF rate, and stable-employment percentage? A property-management company in the area should have these aggregated.
- How much new for-sale + rental construction is in the pipeline within 1–3 miles? Heavy new supply typically softens prices + rents 12–24 months out; constrained supply supports both.
Investment metrics
- 1% rule
- 1.58% ✓
- Cap rate
- 11.92%
- Cash-on-cash
- 20.08%
- DSCR
- 1.89
- GRM
- 5.3
CMA / ARV
- ARV (on-the-fly)
- $178,308
- Comps found
- 8
Show comp detail 8 sales within ~0.75 mi
| Address | Dist | Beds/Ba | Sqft | Sold | Price | $/sf | Match |
|---|---|---|---|---|---|---|---|
| 366 N Beach Ct | 0.09mi | 3/2.5 (+1) | 1,326 (-6%) | 2mo | $70,000 | $53 | 78 |
| 8040 Creekstone Way | 0.07mi | 3/2.5 (+1) | 1,332 (-5%) | 5mo | $178,500 | $134 | 77 |
| 8023 Creekstone Way | 0.07mi | 2/3.5 | 1,300 (-7%) | 13mo | $107,000 | $82 | 71 |
| 8114 Woodlake Dr | 0.14mi | 3/2.0 (+1) | 1,267 (-10%) | 7mo | $195,000 | $154 | 63 |
| 8080 Woodlake | 0.13mi | 2/2.5 | 1,280 (-9%) | 19mo | $140,000 | $109 | 61 |
| 390 Lakeridge Ct | 0.13mi | 3/2.0 (+1) | 1,256 (-10%) | 10mo | $149,900 | $119 | 60 |
| 8168 Canyon Forge Dr | 0.51mi | 3/2.0 (+1) | 1,260 (-10%) | 9mo | $175,000 | $139 | 42 |
| 8205 Canyon Forge Dr | 0.55mi | 2/1.5 | 1,224 (-13%) | 18mo | $155,250 | $127 | 32 |
Match score weights: distance 35% · size 25% · config 20% · recency 20%. Top-matched comps best support the ARV.
Projected returns pro-forma
-3.0% appreciation · 1.3% rent growth · sell at horizon
- IRR
- 10.2%
- Equity multiple
- 1.40×
- Total profit
- $10,950
- Equity at exit
- $14,761
- IRR
- 17.8%
- Equity multiple
- 2.35×
- Total profit
- $37,470
- Equity at exit
- $8,560
Cash invested: $27,720 (down + closing). Projections, not guarantees.
Landlord ↔ Tenant lean methodology
- Overall (STATE)
- 90 Strongly Landlord-Friendly
- State Georgia
- 90 Strongly Landlord-Friendly · R+3
- County
- — inherits STATE
- City
- — inherits STATE
ZIP-level market 30274
- Home prices YoY
- -19.6%
- Rents YoY
- 1.3%
- Active inventory
- 189
- Price-to-rent
- 5.3×
Monthly cashflow live
- Estimated rent
- $1,561 high interval (Pro) →
- Mortgage (P&I)
- −$519
- Tax from tax record
- −$209 /mo · $2,509/yr
- Insurance
- −$41
- HOA
- −$0
- Vacancy / Maint / Mgmt
- −$328
- Net cashflow
- $464
Break-even live
Sensitivity live
| Price | -10% $520 | -5% $492 | +0% $464 | +5% $436 | +10% $408 |
|---|---|---|---|---|---|
| Rent | -10% $341 | -5% $402 | +0% $464 | +5% $526 | +10% $587 |
| Rate | -1.0pp $514 | -0.5pp $489 | base $464 | +0.5pp $438 | +1.0pp $412 |
UW: 25.0% down · 7.5% · 30yr · 1.5% tax · 5.0% vac · 8.0% maint · 8.0% mgmt
Financing live
Cash to close
- Down payment
- $24,750
- Closing costs
- $2,970
- Reserves months
- —
- Total cash needed
- —
Loan-product check · same deal, 3 products live
Conventional
25% down · 7.5% · 30yr
- Down + closing
- —
- Monthly P&I
- —
- Monthly cashflow
- —
- DSCR
- —
- Eligible?
- —
Personal DTI + credit; lowest rate.
DSCR
20% down · 8.5% · 30yr
- Down + closing
- —
- Monthly P&I
- —
- Monthly cashflow
- —
- DSCR
- —
- Eligible?
- —
No personal income docs; deal must DSCR.
Hard money
10% down · 12.0% · 12mo
- Down + closing
- —
- Monthly P&I
- —
- Monthly cashflow
- —
- DSCR
- —
- Eligible?
- —
Short-term bridge; refi at stabilization.
Rent comps 40 comps
| Address | Beds | Baths | Sqft | Rent | $/sqft | DOM | Units | Dist |
|---|---|---|---|---|---|---|---|---|
| 8062 Creekstone Way Riverdale, GA | 2.0 | 2.5 | 1232 | $1,286 | $1.04 | 45d | 1 | 0.11mi |
| 8066 Woodlake Dr Riverdale, GA | 2.0 | 2.5 | 1280 | $1,505 | $1.18 | 5d | 1 | 0.14mi |
| 8078 Woodlake Dr Riverdale, GA | 2.0 | 2.5 | 1280 | $1,445 | $1.13 | 3d | 1 | 0.15mi |
| 7943 Taylor Cir Riverdale, GA | 3.0 | 2.0 | 1344 | $1,665 | $1.24 | 45d | 1 | 0.21mi |
| 426 Park Ridge Cir Riverdale, GA | 3.0 | 2.0 | 1578 | $1,773 | $1.12 | 45d | 1 | 0.31mi |
| 8104 Webb Rd Riverdale, GA | 1.0–2.0 | 1.0–2.0 | 890 | $1,481 | $1.66 | 0d | 18 | 0.31mi |
| 8050 Taylor Rd Riverdale, GA | 1.0–3.0 | 1.0–2.0 | 944 | $1,148 | $1.22 | 0d | 12 | 0.31mi |
| 8183 Rhodes Way Riverdale, GA | 3.0 | 2.5 | 1650 | $1,945 | $1.18 | 21d | 1 | 0.45mi |
| 8195 Rhodes Way Riverdale, GA | 3.0 | 2.0 | 1546 | $2,090 | $1.35 | 26d | 1 | 0.48mi |
| 8194 Canyon Forge Dr Riverdale, GA | 3.0 | 2.5 | 1488 | $1,555 | $1.05 | 6d | 1 | 0.53mi |
| 8200 Webb Rd Riverdale, GA | 3.0 | 2.0 | 1222 | $1,741 | $1.42 | 0d | 1 | 0.59mi |
| 8226 Canyon Forge Dr Riverdale, GA | 3.0 | 2.5 | 1512 | $1,631 | $1.08 | 14d | 1 | 0.60mi |
| 8238 Canyon Forge Dr Riverdale, GA | 2.0 | 2.5 | 1246 | $1,400 | $1.12 | 6d | 1 | 0.63mi |
| 8038 Flamingo Dr Jonesboro, GA | 3.0 | 1.5 | 1178 | $1,553 | $1.32 | 26d | 1 | 0.64mi |
| 8147 Mountain Pass Riverdale, GA | 3.0 | 2.0 | 1432 | $1,935 | $1.35 | 0d | 1 | 0.68mi |
| 269 Highway 138 SW Riverdale, GA | 1.0–2.0 | 1.0–2.0 | 995 | $1,405 | $1.41 | 0d | 37 | 0.70mi |
| 14 Cardinal Ln Jonesboro, GA | 3.0 | 2.0 | 1118 | $1,446 | $1.29 | 0d | 1 | 0.71mi |
| 102 Palisades Pointe Riverdale, GA | 2.0 | 2.5 | 1224 | $1,673 | $1.37 | 6d | 1 | 0.77mi |
| 53 Skylark Ln Jonesboro, GA | 3.0 | 1.5 | 1176 | $1,595 | $1.36 | 26d | 1 | 0.82mi |
| 7560 Taylor Rd #26 Riverdale, GA | 2.0 | 1.0 | 1158 | $1,250 | $1.08 | 45d | 1 | 0.84mi |
| 8443 Cedar Creek Rdg Riverdale, GA | 3.0 | 2.0 | 1476 | $1,735 | $1.18 | 21d | 1 | 0.85mi |
| 7 Old Roundtree Rd Riverdale, GA | 3.0 | 2.5 | 1620 | $1,840 | $1.14 | 12d | 1 | 0.88mi |
| 8150 Flamingo Dr Jonesboro, GA | 3.0 | 2.0 | 1092 | $1,615 | $1.48 | 0d | 1 | 0.91mi |
| 8225 Attleboro Dr Jonesboro, GA | 3.0 | 2.0 | 1040 | $1,295 | $1.25 | 20d | 1 | 0.96mi |
| 66 Darwin Dr Jonesboro, GA | 3.0 | 2.0 | 1118 | $1,425 | $1.27 | 6d | 1 | 1.00mi |
| 8600 Cedar Creek Rdg Riverdale, GA | 3.0 | 2.0 | 1555 | $1,745 | $1.12 | 7d | 1 | 1.04mi |
| 8614 Cedar Creek Rdg Riverdale, GA | 3.0 | 2.5 | 1728 | $1,500 | $0.87 | 45d | 1 | 1.07mi |
| 222 Peartree Ln Riverdale, GA | 3.0 | 1.5 | 1028 | $1,480 | $1.44 | 26d | 1 | 1.07mi |
| 8612 Thomas Rd Riverdale, GA | 3.0 | 2.5 | 1532 | $1,623 | $1.06 | 45d | 1 | 1.08mi |
| 8609 Thomas Ln Riverdale, GA | 3.0 | 2.5 | 1530 | $1,628 | $1.06 | 0d | 1 | 1.09mi |
| 8206 Huntington Dr Jonesboro, GA | 3.0 | 2.0 | 1275 | $1,520 | $1.19 | 0d | 1 | 1.11mi |
| 8630 Thomas Rd Riverdale, GA | 3.0 | 2.5 | 1530 | $1,500 | $0.98 | 26d | 1 | 1.11mi |
| 950 Lake Ridge Pkwy Riverdale, GA | 1.0–2.0 | 1.0–2.0 | 966 | $1,457 | $1.51 | 0d | 30 | 1.11mi |
| 100 Chase Ridge Dr Riverdale, GA | 1.0–2.0 | 1.0–2.0 | 1002 | $1,545 | $1.54 | 7d | 6 | 1.13mi |
| 100 Chase Ridge Dr Riverdale, GA | 2.0 | 2.0 | 1175 | $1,545 | $1.31 | 45d | 1 | 1.13mi |
| 8631 Thomas Ln Riverdale, GA | 3.0 | 2.5 | 1530 | $1,673 | $1.09 | 23d | 1 | 1.13mi |
| 7432 Meadows Dr Riverdale, GA | 3.0 | 2.0 | 1640 | $1,716 | $1.05 | 7d | 1 | 1.13mi |
| 8640 Thomas Ln Riverdale, GA | 3.0 | 2.5 | 1530 | $1,643 | $1.07 | 0d | 1 | 1.14mi |
| 8584 Guthrie Dr Riverdale, GA | 3.0 | 2.0 | 1445 | $1,650 | $1.14 | 17d | 1 | 1.14mi |
| 233 Lucan Way Riverdale, GA | 3.0 | 2.0 | 1201 | $1,665 | $1.39 | 6d | 1 | 1.14mi |
Listing history 7 events
-
2026-06-21days on market $99,000 Active 8 DOM
-
2026-06-18days on market $99,000 Active 5 DOM
-
2026-06-17days on market $99,000 Active 4 DOM
-
2026-06-16days on market $99,000 Active 3 DOM
-
2026-06-15days on market $99,000 Active 2 DOM
-
2026-06-13remarks 699-char remark
-
2026-06-13$99,000 Active 1 DOM
ⓘ Source: listings_history table (triggers on properties + properties_extension) + one-shot
backfill from property_details.listing_events for pre-trigger history.
Tax reassessment forecast GA · Resets to sale price
- Current annual tax
- $2,509 · $209/mo
- Projected year-2 tax
- $2,509 · $209/mo
- Expected delta
- $0/yr ($0/mo · 0.0%)
ⓘ Screening estimate from a state-policy table — verify with the county assessor before closing.
Climate risk First Street
- Flood 1/10 Low FEMA zone X (unshaded) · 0% chance over 30 yrs
- Wildfire 2/10 Low
- Heat 6/10 Major 7 d/yr ≥105°F today · 18 d/yr by 30 yrs out
- Wind 6/10 Major 27% chance of damaging wind over 30 yrs
- Air quality 4/10 Moderate 4 unhealthy d/yr today · 6 by 30 yrs out
Nearby sold comps map
Loading sold comps map…
Walkable amenities ~0.75 mi
Loading nearby amenities…
Taxation est. · year 1
- Rental income
- $18,735
- − Mortgage interest
- −$5,546
- − Property taxes
- −$2,509
- − Insurance
- −$495
- − Repairs & maintenance
- −$1,499
- − Management
- −$1,499
- − Depreciation
- −$2,880
- Taxable income
- $4,307
- Est. tax owed @ 24.0%
- −$1,034
- After-tax cash flow
- $4,532/yr
For passive investors: Depreciation is non-cash, so a rental often shows a tax loss while cash-flowing — sheltering income. Rental losses are passive: they offset passive income freely, and up to $25,000/yr can offset ordinary (W-2) income if you actively participate and your MAGI is under $100k (phasing out to $0 by $150k); unused losses carry forward. On sale, claimed depreciation is recaptured at up to 25%, and gains may owe capital-gains tax (a 1031 exchange can defer both). Figures are a year-1 estimate at your 24.0% rate — not tax advice; consult a CPA.
Schools (NCES district)
- District
- Clayton County
- NCES district ID
- 1301230
- Math proficiency
- 11% ▼ -13.00%
- Reading proficiency
- 20% ▼ -9.00%
- Median HH income
- $42,266
- Composite
- 13.41/100
- National rank
- #9527
- State rank
- #155 of 174 in GA
Livability — Riverdale
- Score
- 70/100
- State rank
- #100
- US rank
- #7907
Category grades
Schools grade is shown separately in the Schools card above.
Census & demographics
- County
- Clayton County · 230,153 people
- City population
- 61,126
- Metro
- Atlanta-Sandy Springs-Alpharetta, GA
- Population (ZIP)
- 34,081
- Household income
- $52,209
- Rent vs Own
- Severe rent burden
- 2586.0
Population outlook (Clayton County) Hauer SSP2
- Today (2025)
- 310,777 people
- By 2030
- 329,762 · +6.1%
- By 2040
- 368,052 · +18.4%
- By 2050
- 401,196 · +29.1%
- By 2075
- 472,488 · +52.0%
- By 2100
- 500,446 · +61.0%
Race, ethnicity, and origin ACS 2023
- Neighborhood character
- Predominantly Black (76%)
- Race & ethnicity
- Black 76% Hispanic / Latino 14% Two or more races 5% Asian 5% White 5%
- Hispanic origin (detail)
- Mexican 9% Puerto Rican 1%
- Foreign-born
- 15% · Canada, Vietnam
- Languages at home
- 80% English-only · Spanish 12% Vietnamese 2% Other Asian/Pacific 2%
Political lean MEDSL · Clayton
- 2024 margin
- Solid D (+69.2) · D 84.3% · R 15.1%
- 2008→2024 swing
- +2.8pp toward D · 2008: 66.4pp · 2024: 69.2pp
- All cycles
- 2024: D+69.2 2020: D+70.9 2016: D+71.9 2012: D+70.1 2008: D+66.4
Not yet ingested
- Civics
- —
Market trends
- HPI YoY
- ▼ -57.82%
- Current HPI
- 236.3592
- Rent YoY
- ▲ 1.30%
- Metro
- Atlanta-Sandy Springs-Alpharetta, GA
- State GDP YoY
- ▲ 2.66%
- F500 in state
- 28
Industry mix (Fortune 500 HQ in GA)
| Industry | F500 HQs | Revenue |
|---|---|---|
| Paper / Packaging | 2 | $29B |
|
||
| Retail | 1 | $160B |
|
||
| Transportation / Logistics | 1 | $91B |
|
||
| Airlines | 1 | $62B |
|
||
| Consumer Goods | 1 | $47B |
|
||
| Utilities | 1 | $25B |
|
||
Price history
+76.8% since first listed5 events — show timeline
- 2026-06-12 Listed $99,000 GAMLS
- 2026-06-12 Listed $99,000 FMLS
- 2005-06-23 Sold (Public Records) $85,900 Public Records
- 1994-02-28 Sold (Public Records) $65,000 Public Records
- 1988-12-16 Sold (Public Records) $56,000 Public Records
Property tax history
+9.2%/yrLatest (2025): $2,509 · +9.4% YoY. Source: county tax records.
Cash-flow waterfall
monthlySold comps — $/sqft
last 12 mo · ≤1 miLoading sold comps…